THE METEOROLOGICAL OBSERVATORY AT NEUMAYER STATIONS (GVN AND NM-II) ANTARCTICA
←
→
Page content transcription
If your browser does not render page correctly, please read the page content below
Umbruch PF 76 15.08.2007 16:58 Uhr Seite 25
Polarforschung 76 (1-2), 25 – 38, 2006 (erschienen 2007)
The Meteorological Observatory
at Neumayer Stations (GvN and NM-II) Antarctica
by Gert König-Langlo1 and Bernd Loose1
Abstract: Since March 1981 a meteorological observatory program is carried
out at Georg von Neumayer Station (GvN, 70°37’S, 8°22’W) continuously. The general circulation of the whole atmosphere is mainly
On 16 March 1992 the program was extended and transferred to the new
Neumayer Station (NM-II, 70°39’S, 8°15’W) in a close neighbourhood of the driven from the temperature difference between the equatorial
former one. Today, the meteorological observatory of NM-II is an integral part and the polar regions, resulting from the differential absorp-
of many international networks, mostly associated with the World Meteorolo- tion of solar energy. Without the knowledge of the Antarctic
gical Organization (WMO). The data from NM-II help to close significant
gaps in the global weather and climate observing networks. NM-II takes part climatology the general circulation of the whole atmosphere
in the Global Telecommunication System (GTS), the Global Climate Observ- cannot be understood. Thus, meteorological observatories in
ing System (GCOS), the Global Atmospheric Watch (GAW), the Network for Antarctica have a fundamental importance, not only for Antarc-
the Detection of Atmospheric Composition Change (NDACC, formerly
NDSC), and the Baseline Surface Radiation Network (BSRN). Three-hourly
tica but for the whole world. Antarctica is frequently regarded
synoptic observations, daily upper air soundings including weekly ozone to be very sensitive to anthropogenic induced climate changes.
profiling, and substantial surface radiation measurements are the main parts The ozone depletion – firstly observed in Antarctica – is one
of the measurements. Additionally, the meteorological observatory of NM-II well known example. Also the collapse of parts of the Larsen
evolved more and more into the meteorological forecast centre for the whole
Dronning Maud Land. Meanwhile, data from 25 years are measured and Ice Shelf in 1995 and 2002 is frequently regarded as a result of
archived in a carefully validated and post processed form in the Meteorolo- global climate changes.
gical Information System at the Alfred Wegener Institute (MISAWI). Within
this publication, the observatory will be described and some results from the
long-term measurements will be presented. Despite the fact that Antarctica belongs to the “motors” of our
climate system and its sensitivity to climate changes, only
Zusammenfassung: Seit März 1981 wird an der Georg-von-Neumayer- very few meteorological measurements are available. From no
Station (GvN, 70°37’S, 8°22’W) kontinuierlich ein meteorologisches Obser- other continent less data exist. Only the oceanic regions face a
vatoriumsprogramm durchgeführt. Am 16. März 1992 wurde das Programm
erweitert und in die in der Nachbarschaft errichtete neue Neumayer Station II comparable problem. To reduce this problem, the World
(NM-II, 70°39’S, 8°15’W) überführt. Das meteorologische Observatorium Meteorological Organization (WMO) strongly recommends
von NM-II ist heute ein integraler Bestandteil vieler, meist mit der World that any research station established in Antarctica should run a
Meteorological Organization (WMO) verbundener internationaler Netzwerke.
Die Daten von NM-II tragen dazu bei, wesentliche Lücken im globalen
Wetter- und Klimabeobachtungsnetz zu schließen. NM-II ist Bestandteil des
Global Telecommunication Systems (GTS), des Global Climate Observing
Systems (GCOS), des Global Atmospheric Watch (GAW), des Network for
the Detection of Atmospheric Composition Change (NDACC, vormals
NDSC) und des Baseline Surface Radiation Networks (BSRN). Alle drei
Stunden durchgeführte synoptische Beobachtungen, tägliche Radiosondie-
rungen mit wöchentlichen Ozonsondenprofilierungen sowie umfangreiche
bodennahe Strahlungsmessungen machen den Hauptteil der Messungen aus.
Zusätzlich hat sich das meteorologische Observatorium von NM-II nach und
nach zum Wettervorhersagezentrum für das gesamte Dronning-Maud-Land
entwickelt. Mittlerweile sind die sorgfältig validierten und nachprozessierten
Daten von 25 Jahren Observatoriumsbetrieb im Meteorologischen Informa-
tionssystem des Alfred-Wegener-Instituts (MISAWI) archiviert. In dieser
Publikation wird das Observatorium beschrieben und einige Ergebnisse aus
den Langzeitmessungen dargestellt.
Introduction
Antarctica is a continent of superlatives, especially from the
climatologically point of view. It is the most isolated conti-
nent, completely surrounded by the only circumpolar ocean
current of the Earth. It is the highest, driest as well as the
coldest continent. More than 98 % of its surface is covered by
snow and ice.
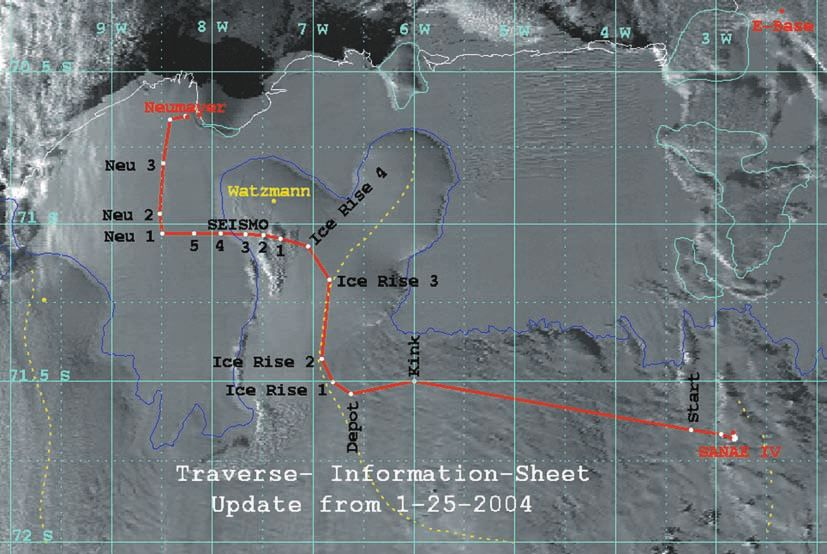
Fig. 1: The geographical position of the Neumayer site in the Antarctic and the
mean location of the sea-ice edge for February (minimum) and September
(maximum).
____________
1
Stiftung Alfred-Wegener-Institut für Polar- und Meeresforschung (AWI) in der Helm-
holtz-Gemeinschaft, Postfach 120161, 27515 Bremerhaven, Germany. Abb. 1: Die geographische Position der Neumayer-Stationen in der Antarktis
sowie die mittlere Lage der Meereisausdehnung im Februar (Minimum) und
Manuscript received 12 May 2006, accepted 03 August 2006 September (Maximum).
25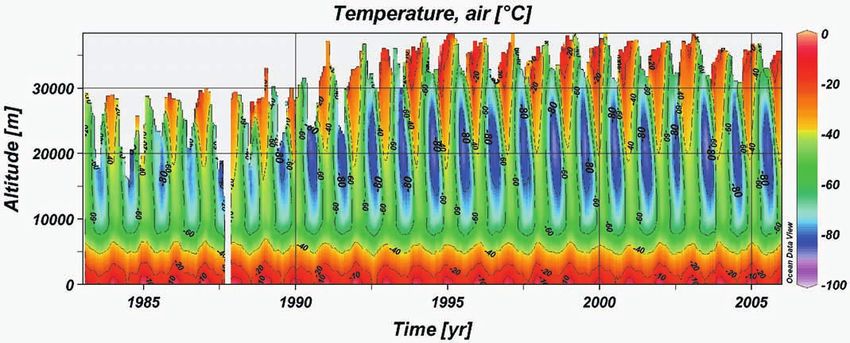
Umbruch PF 76   15.08.2007 16:58 Uhr         Seite 26

       meteorological observatory. The obtained data should be deliv-       data-collecting platform (DCP).
       ered without delay into the Global Telecommunication System
       (GTS), the worldwide data backbone of any national weather           In March 1992 the GvN observatory was transferred – without
       service agency. Georg von Neumayer Station (GvN; marked as           interrupting the measurements – into the new Neumayer
       Neumayer in Fig. 1) became part of the GTS from its very             Station II (NM-II), built in the very vicinity of the former one.
       beginning on. Meanwhile the successor, Neumayer Station II           The surface radiation measurements were extended to meet
       (NM-II) is member in many world wide weather and climate             the high quality standards of the Baseline Surface Radiation
       monitoring networks. They are mostly organised or associated         Network (BSRN). Furthermore, the weekly ozone sounding
       with programs founded by the WMO such as:                            measurements – started in 1985 at the nearby Georg Forster
       • The Global Telecommunication System (GTS).                         Station (70°46'S, 11°41'E) – were transferred to GvN. The
       The aim of the GTS is to transfer in real time standardized          Neumayer site obtained the status of a complementary NDSC
       synoptic surface weather observations and upper air sound-           station.
       ings. The data are mainly used from a variety of meteorolo-
       gical agencies worldwide for weather forecasts products. The         During the last decade the infrastructure of the observatory
       data from Neumayer within the GTS are tagged with the                improved significantly. The measurements were automated
       WMO number 89002.                                                    wherever possible. The observatory program could be
       • The Global Climate Observing System (GCOS).                        extended further although the personal had to be reduced from
       It was established to ensure that the observations and informa-      two to one meteorologist. A satellite image receiving station
       tion needed to address climate-related issues are obtained and       was installed for the online reception of pictures (visible and
       made available to all potential users.                               infrared) from the NOAA- and DMSP-satellites. Due to the
       • The Network for the Detection of Atmospheric Composition           highly sophisticated scientific and logistic infrastructure of the
       Change (NDACC, formerly NDSC)                                        station, which since 1999 includes a worldwide communica-
       This network was established to study the temporal and spatial       tionsystem via a permanent data link, NM-II became the
       variability of atmospheric composition and structure in order        weather forecasting centre of the Dronning Maud Land. The
       to provide early detection and subsequent long-term monitor-         full forecast service, especially essential for the growing air
       ing of changes in the physical and chemical state of the stra-       operations, is carried out during the summer months from
       tosphere and upper troposphere.                                      specialists of the German Weather Service (DWD).
       • The Baseline Surface Radiation Network (BSRN).
       The objective of the BSRN is to provide worldwide observa-
       tions of short- and long-wave surface radiation fluxes to            TECHNICAL ASPECTS OF THE METEOROLOGICAL
       monitor their changes with the best methods currently avai-          OBSERVATORY
       lable, to provide data for the validation and evaluation of satel-
       lite-based estimates and to produce high quality observational       Measuring site
       data for comparison to global climate model (GCM) calcula-
       tions and for the development of local regionally representa-        The whole Neumayer Station II (NM-II) is buried completely
       tive radiation climatologies.                                        below the snow surface. Only the entrance towers, some
       • The Global Atmospheric Watch (GAW).                                antennas and exhaust pipes are visible (Fig. 2). Most of the
       The main goal of the GAW program is to produce high quality          meteorological sensors are installed 75 m southeast of the
       data of selected atmospheric parameters and to make these            easterly entrance tower. Even the rarely occurring winds from
       data available to the scientific community. The parameters are       north-westerly directions are not disturbed by the station.
       focussed on chemical constituents as well as on meteorolo-           Directly north of the meteorological tower all radiation sensors
       gical measurements.                                                  are mounted. The horizon is nearly free of obstacles. Shadows
                                                                            from the meteorological lattice tower are rather unimportant
       Most of these goals cannot be achieved by using unmanned             and reach the radiation measurements only during sunny polar
       automatic weather stations. Despite the amazing technical            day nights. The snow surface is modulated by so called sastru-
       progress, permanently manned stations will be needed at least        gies, giant snow ripples created during blowing snow events.
       within the next 25 years to run highly sophisticated observato-      The surface gently inclines towards the station.
       ries in a remote and harsh environment such as Antarctica.

                                                                            Data acquisition
       HISTORY OF THE METEOROLOGICAL OBSERVATORY
       AT NEUMAYER STATIONS (GVN, NM-II)                                    Close to the sensors all analogue signals get digitized every
                                                                            fifth second by a data logger (CR7, Campbell Scientific,
       Since the very beginning of the Georg von Neumayer Station           USA) positioned in an isolated waterproof box above the snow
       (GvN) in March 1981 three-hourly synoptic observations have          surface. The CR7 works autonomously, performs the
       been performed continuously and transferred without delay            analogue/digital conversion and the 1-minute averages or
       into the GTS via short-wave communication. In March 1982             maxima of all data. Every minute the results are transferred
       surface energy budget measurements started. Upward and               serial into the station. Common mode reduction (very impor-
       downward short- and long-wave radiation fluxes, turbulent            tant since the whole station has no defined electrical earth
       heat fluxes in the atmospheric boundary and the heat fluxes          potential) is realized by differential measurements and opto-
       within the snow are measured continuously. From 1983 on              electronic couplers. Due to carefully shielded cables interfer-
       daily upper air soundings have been launched. The data were          ences with the local short-wave transmitter and other sources
       transferred without delay into the GTS via a satellite-based         of electrical noise are excluded. Power failures are minimized

       26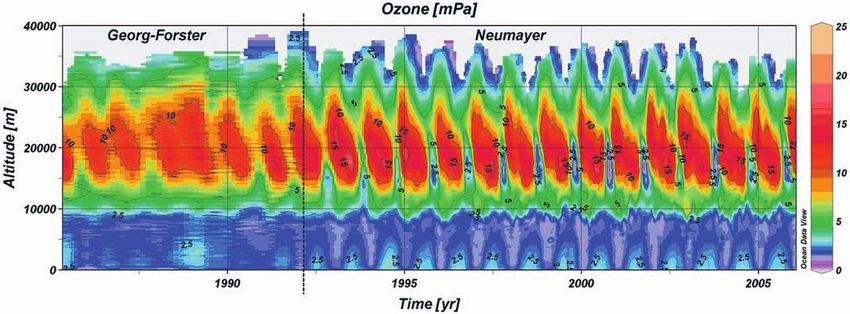
Umbruch PF 76   15.08.2007 16:58 Uhr         Seite 27

                                                                                                                 Fig. 2: View over Neumayer
                                                                                                                 Station II from the 15 m high
                                                                                                                 meteorological tower. The
                                                                                                                 whole station is buried below
                                                                                                                 the snow. Only the entrance
                                                                                                                 towers (1), exhaust pipes (2),
                                                                                                                 antennas (3), emergency huts
                                                                                                                 (4), garage entrance (5) and
                                                                                                                 the cables (6) toward the
                                                                                                                 meteorological measuring site
                                                                                                                 are visible.

                                                                                                                 Abb. 2: Blick auf die Neumay-
                                                                                                                 er-Station II vom 15 m hohen
                                                                                                                 meteorologischen Mast. Die
                                                                                                                 gesamte Station ist im
                                                                                                                 Schnee/Firn verborgen. Nur
                                                                                                                 die Eingangstürme (1), Lüfter-
                                                                                                                 rohre (2), Antennen (3), Ret-
                                                                                                                 tungshütten (4), die Gara-
                                                                                                                 geneinfahrt (5) und die Kabel-
                                                                                                                 kette (6) zum Messplatz der
                                                                                                                 Meteorologie sind zu erken-
                                                                                                                 nen.

       by uninterruptible power supply units (UPS). The digitized          radiation. The dew point temperature is measured with two
       data from the CR7, as well as all other measurements already        hygrometers (Vaisala, HMP233, Finland) mounted in naturally
       obtained directly digital are collected by a terminal server        ventilated radiation shields at a height of 2 m. The hygrome-
       (Lantronix ETS 16PR, USA). The terminal server transfers the        ters are permanently checked against each other. The relative
       whole dataset into the computer network of NM II. Worksta-          humidity is calculated using the dew point temperature and the
       tions (SUN, USA) are used to post process the data. They get        artificially ventilated temperature measurements to minimize
       automatically visualized online, validated to a certain extent,     radiation errors during calm and sunny days. The resulting
       archived, and distributed to any user worldwide via the             accuracy is about 5 %.
       internet.
                                                                           Surface air pressure is detected by using three quartz systems
                                                                           (Digiquartz, 215-AW002, USA). The Digiquartzes are perma-
       Instrumentation for the synoptic observations                       nently checked against each other. They are installed inside the
                                                                           station but connected to a pipe, which ends outside the station
       The synoptic observations are carried out every three hours.        at a depth of about half a meter below the snow surface. Thus,
       They include measurements of air temperature (at 2 m and 10         influences due to wind induced pressure fluctuations or effects
       m height), air pressure (values are reduced to mean sea level),     caused by the air-conditioning inside the station are elimi-
       wind vector (at 2 m and 10 m height), dew point temperature         nated. For the reduction of the air pressure to mean sea level
       (at 2 m height), clouds (cloud amount, type and height), hori-      an instrument height has to be determined. Due to tidal move-
       zontal visibility, present and past weather, snowdrift and          ments of the whole Ekström Ice Shelf and its more or less
       whiteout. The full program is carried out at 0, 9, 12, 15, 18, 21   isostatic movements with respect to snow accumulation and
       UTC. During night-time at 3 and 6 UTC the synoptic observa-         basal melting the instrument height has an uncertainty of
       tions are performed automatically. Thus, no visual observa-         about 4 m. Compared with this uncertainty (~0.5 hPa) other
       tions are available. All data are generally coded                   errors in the pressure measurements can be neglected.
       (FM12-SYNOP) and transferred directly into the GTS via
       mail using a permanent data link. Additionally, they are avai-      The wind vector is determined at 2 and 10 m height by a
       lable from                                                          combined instrument consisting of a cup anemometer and a
       . All              wind vane (Thies 4.3323.21.002, Germany). All axes are
       datasets covering a whole year of synoptic observations are         heated. Ultrasonic anemometers have been tested several
       published at PANGAEA, e.g., KÖNIG-LANGLO (2005).                    times. But they failed during blowing snow events. Cloud base
                                                                           heights below 12000 feet are measured using a ceilograph
       Temperature measurements at 2 and 10 m height are carried           (LD-WHX 05, Impulsphysik, Germany). Bases above 12000
       out with PT-100 platinum resistance sensors with an accuracy        feet are estimated visually. Visibility is automatically
       of 0.1 °C (Thies 2.1265.10.000, Germany). The thermometers          measured by a visibility sensor (Vaisala, FS11, Finland).
       are ventilated artificially and are double protected against

                                                                                                                                            27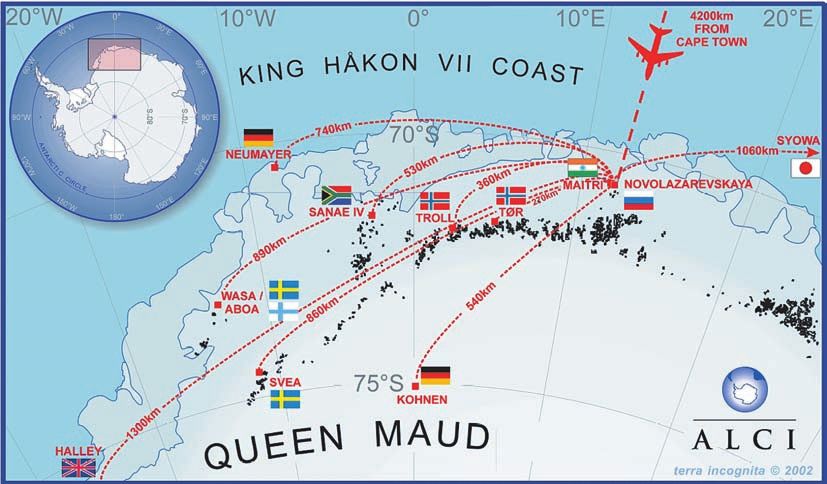
Umbruch PF 76   15.08.2007 16:58 Uhr         Seite 28

       Instrumentation for the daily upper air soundings

       Once daily (about 10:45 UTC) a radiosonde is launched to
       measure vertical profiles of air pressure, temperature, relative
       humidity and the wind vector. The resulting TEMP message is
       transferred into the GTS via a permanent data link and into
       internet at .
       All upper air soundings are published at PANGAEA with full
       height resolution of up to 25 m, see KÖNIG-LANGLO (2006).
       The upper air soundings are carried out with RS92-SGPW
       radiosondes (VAISALA, Finland). They directly measure air
       pressure, air temperature and relative humidity. The wind
       vector is determined with the aid of the GPS navigation
       system, the height information is calculated using the
       hydrostatic approximation. Helium filled balloons (TOTEX
       600 g, 800 g, Japan) are taken to obtain an ascent velocity of
       about 5 m s-1. Typically, two hours later the balloons burst at
       heights between 25 and 37 km. To reach such height levels
       also during wintertime when the stratosphere is extremely
       cold, the balloons are pretreated by heating and oil dipping. All
       balloons were filled inside an inflation shed equipped with a
       sliding door 3 m wide and 4 m high (Fig. 3). During strong
       wind conditions (>20 m s-1), only 350/600 g balloons can be
       launched with a reasonable chance of success. The data recep-
       tion and evaluation is carried out by a DigiCora III MW31
       (VAISALA, Finland).
                                                                                    Fig. 3: The balloon filling hall at Neumayer Station II.

                                                                                    Abb. 3: Die Ballonfüllhalle an der Neumayer-Station II.
       Instrumentation for the weekly ozone soundings

       Normally, one ozone sonde is launched every week to measure         conditions. The radiation measurements are carried out with:
       the vertical ozone profile through the troposphere and the          • 5 pyranometers (CM11, Kipp & Zonen, Netherlands) for
       lower stratosphere. For the ozone soundings an ozone sonde          global radiation (glass, OG1-, RG8-filter), diffuse sky radia-
       (ECC-6AB, Science Pump Corporation, USA) is connected               tion and reflected solar radiation,
       via an interface to a RS92 radio sonde. The ozone is measured       • 1 normal incidence pyrheliometer (NIP, Eppley, USA) for
       by pumping air through a chemical solution and using the            direct radiation,
       principal of iodide redox reaction to release electrons. 1500 g     • 1 uv-meter (TUVR, Eppley, USA) for broadband uv radia-
       TOTEX balloons are used for these ascents. The DigiCora III         tion,
       is able to handle the data reception and evaluation of both, the    • 2 pyrgeometers (PIR, Eppley, USA) for upward and down-
       normal RS92 radio sonde and the ozone sonde at the same             ward long-wave radiation,
       time.                                                               • 1 photoelectric sunshine detector (Solar 111b, Haenni and
                                                                           Cie., Switzerland).

       Instrumentation for the surface radiation measurements              The normal incidence pyrheliometer is mounted on a sun
                                                                           tracker (SCI-TEC 2AP, Kipp & Zonen, Netherlands), which
       The following radiation quantities are measured every fifth         follows the azimuth and elevation direction of the sun automa-
       second and stored together with all other meteorological            tically. The diffuse sky radiation is obtained using a shadow
       measurements described below in form of one minute aver-            disk pointed from the tracker (see background of Fig. 4). From
       ages:                                                               the pyrgeometers the thermopile output, one body temperature
       • global (solar) radiation with glass-filter (305-2800 nm)          and three dome temperatures are recorded separately. All
       • global radiation with OG1-filter           (530-2800 nm)          instruments are calibrated at the World Radiation Centre,
       • global radiation with RG8-filter           (695-2800 nm)          Davos Switzerland. After one year of operation the sensors get
       • uv radiation                                 (300-370 nm)         exchanged with newly calibrated ones.
       • diffuse sky radiation                      (305-2800 nm)
       • direct solar radiation                     (305-2800 nm)          Together with the radiation data one-minute averages of the
       • reflected solar radiation                   (305-2800nm)          surface air pressure, relative humidity (2 m), air temperature
       • downward long-wave radiation                    (4-50 µm)         (2 m and 10 m) and the wind vector (2 m and 10 m) are
       • upward long-wave radiation                      (4-50 µm)         recorded. The minimum value of the ceilometer record within
       • sunshine duration.                               (yes / no)       a 1 min. interval is taken as cloud base height. Data are avail-
                                                                           able below  or from the World Radiation Monitoring
       preheated air (Eigenbroth, FRG) to minimize hoar frost              Centre, ETH Zürich, Switzerland.
       problems and zero offset effects during cloud- and windless

       28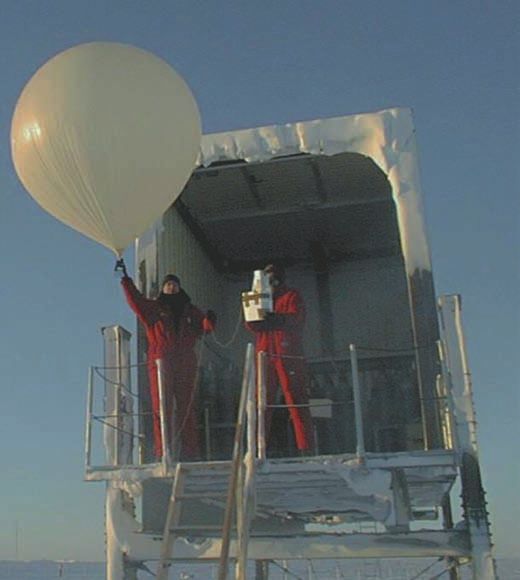
Umbruch PF 76     15.08.2007 16:58 Uhr             Seite 29

                                                                                     maximum incidence angle is 42.8° at 22 December. The sun
                                                                                     stays permanently above the horizon from 19 November to 24
                                                                                     January (polar day) and permanently below the horizon from
                                                                                     19 May to 27 July (polar night).

                                                                                     Owing to the low sun elevations at high latitudes and the high
                                                                                     albedo of snow and ice the surface radiation balance of Antarc-
                                                                                     tica is mostly negative, which means that the ground loses
                                                                                     more energy by radiation than it gains. Corresponding to the
                                                                                     radiation balance, the cooling of the lower atmosphere is faster
                                                                                     in high than in middle latitudes, which induces a meridional
                                                                                     temperature gradient through the mean troposphere, which
                                                                                     varies with season and reaches equinoctial maxima in March
                                                                                     and September. To a large extent this gradient controls the
                                                                                     number and strength of the depressions which move in east-
                                                                                     ward direction around Antarctica in a circumpolar trough at
       Fig. 4: The radiation sensors at Neumayer Station II. In the background the
                                                                                     approximately 65 °S. This trough can be depicted as a contin-
       sun tracker is visible.                                                       uous belt surrounding Antarctica where pressure is minimum
                                                                                     on average. North of 65 °S, westerly surface winds are predo-
       Abb. 4: Die Strahlungssensoren an der Neumayer-Station II. Im Hintergrund     minant, while south of 65 °S, easterlies surface winds prevail.
       ist der Sonnenfolger zu erkennen.
                                                                                     The Neumayer site is situated at the southern edge of this low-
                                                                                     pressure belt. Thus, the mean sea level pressure at Neumayer is
                                                                                     comparably low. Strong easterly winds associated with
       SELECTED RESULTS                                                              cyclonic disturbances are common. Only few cyclonic disturb-
                                                                                     ances penetrate into the interior of Antarctica.
       Meanwhile, time series from data of up to 25 years are avail-
       able from the Neumayer site. Within this chapter some results                 The surface circulation over most parts of the Antarctic conti-
       from the long-term measurements will be discussed. For a                      nent is dominated by katabatic effects, initiated by a horizontal
       better interpretation first the general climatologically condi-               density gradient due to a slope between the cold air neighbour-
       tions at Neumayer will be presented briefly.                                  ing the surface and the relatively warmer upper air. At
                                                                                     Neumayer the katabatic winds are typically during high pres-
                                                                                     sure regimes associated with clear skies and negative radiation
       General climatological conditions at Neumayer stations                        balance. Since the Ekström Ice Shelf slopes only gently
                                                                                     upward to the south, the katabatic winds have a south-north
       The sea-ice extent around Antarctica has a pronounced annual                  orientation and stay always below 10 m s-1.
       cycle with a minimum in February and a maximum in
       September (Fig. 1). During summertime the coastlines at
       Neumayer are sometimes ice free. In wintertime the area                       Surface station climatology
       between the coastline and the sea-ice edge – frequently more
       than 1000 km away – includes a few percent of cracks, leads                   The annual averaged temperature at the Neumayer site is
       and polynyas not covered by sea ice. The sea ice, as well as the              -16.1 °C. The day-to-day temperature variations are largest
       open-water patches, are an important source for many aerosols                 during winter, when the temperature variations between the air
       measured at Neumayer.                                                         masses from the interior of Antarctica and the surrounding
                                                                                     ocean are most pronounced (Fig. 6). An additional reduction
       The station’s annual course of the sun elevation (without                     of the temperature variations in summer results from some
       refraction) from Neumayer is shown in Figure 5. The                           minor melting processes, which tend to constrain near surface

                                                                                              Fig. 5: Annual cycle of the maximum of the solar elevation at
                                                                                              Neumayer calculated after IQBAL (1983).

                                                                                              Abb. 5: Jahresgang der maximalen Sonnenhöhe bei Neumayer be-
                                                                                              rechnet nach IQBAL (1983).

                                                                                                                                                        29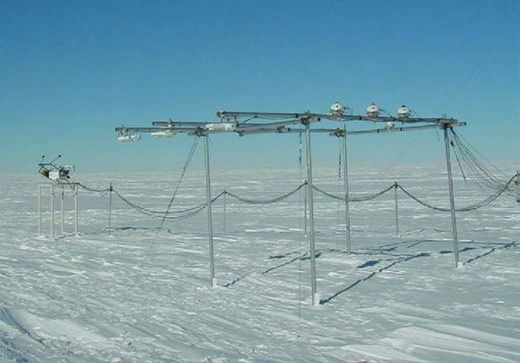
Umbruch PF 76   15.08.2007 16:58 Uhr        Seite 30

                                                                                     Fig. 6: Monthly mean, maximum and minimum values of air tem-
                                                                                     peratures from Neumayer. Mean temperature values are plotted
                                                                                     with standard deviation with respect to the three-hourly synoptic
                                                                                     observations.

                                                                                     Abb. 6: Monatliche Mittel, Maxima und Minima der Lufttempera-
                                                                                     tur bei Neumayer. Die mittleren Temperaturen sind mit den Stan-
                                                                                     dardabweichungen aus den drei-stündlichen synopticschen Beob-
                                                                                     achtungen dargestellt.

                                                                                     Fig. 7: Time series of the annually averaged air temperature at
                                                                                     Neumayer stations 2 m above the snow surface.

                                                                                     Abb. 7: Zeitserie der Jahresmittel der Lufttemperatur an den Neu-
                                                                                     mayer-Stationen 2 m über der Schneeoberfläche.

       air temperatures to 0 °C. Within the last 25 years remarkable
       year-to-year temperature variations were measured but no
       significant trend can be observed (Fig. 7). This finding is in
       contrast to measurements at the Antarctic Peninsular where a
       significant warming took place, but it is typical for the major-
       ity of all other Antarctic stations.

       Neumayer is a rather windy site with an averaged wind speed
       of 9 m s-1. Severe easterly storms are common. They can reach
       wind velocities well above 30 m s-1. Only during summer
       blizzards are less frequent. Drifting and blowing snow events
       are common at Neumayer. This makes meteorological and air-
       chemistry measurements to be a rather complicate task.
       Frequently, precipitation events are hidden behind severely
       blowing snow events. Drifting or blowing snow is reported in
       40 % of all visual observations. Depending on the surface
       conditions, snow begins to drift at wind speeds of 6-12 m s-1      Fig. 8: Accumulated frequency distribution of snow-drift observations at Neu-
       (Fig. 8). If the saltated snow reaches heights above the eye       mayer stations versus wind velocity 10 m above the snow surface.
       level of the observer, the phenomenon is called blowing snow
                                                                          Abb. 8: Akkumulierte Häufigkeitsverteilung von Schneedriftbeobachtungen
       which gets reported in 20 % of all observations from               bei Neumayer in Abhängigkeit von der Windgeschwindigkeit 10 m über der
       Neumayer. Drifting and blowing snow events are restricted to       Schneeoberfläche.
       synoptic disturbances, which are connected mainly with the
       advection of air masses from the east.                             with wind speeds exceeding 2.5 knots. Certain wind directions
                                                                          are correlated with rather distinct wind speeds. Two combina-
       The surface wind observations are performed with a wind            tions occur most frequently at Neumayer: The synoptic disturb-
       speed resolution of 1 knot (0.5144 m s-1) and a resolution of      ances are responsible for the maximum at 90° and 25 knots,
       the wind direction of 10°. The two-dimensional frequency           the katabatic flows for the combination around 180° and 10
       distribution (Fig. 9) is based directly on these observations      knots. The medium strong westerly winds are associated with

       30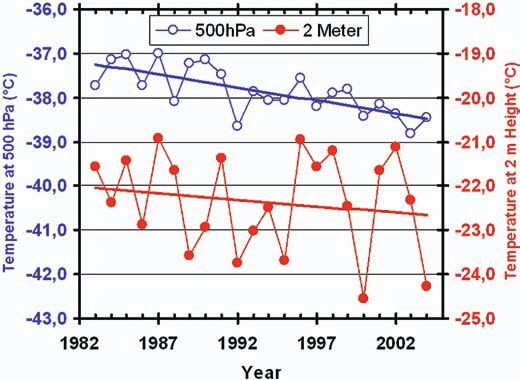
Umbruch PF 76     15.08.2007 16:58 Uhr               Seite 31

                                                                                        Upper air soundings

                                                                                        The prevailing easterly surface wind dominates the tropo-
                                                                                        sphere just within the lowest 2 km. Only between November
                                                                                        and February do easterlies exist at any higher levels (Fig. 10).
                                                                                        During the rest of the year, a pronounced circumpolar cyclonic
                                                                                        vortex, with westerly winds increasing with height, is well
                                                                                        established. This vortex is strongest within the stratosphere but
                                                                                        also present in the troposphere above 5 km (Fig. 11). The
                                                                                        whole upper air climatology of Antarctica is governed by this
                                                                                        vortex. In the stratosphere the flow is driven by horizontal
                                                                                        temperature gradients that are maintained by radiative heating
                                                                                        and cooling. During the austral summer, the Antarctic strato-
                                                                                        sphere receives more solar radiation than lower latitudes and
                                                                                        thus becomes relatively warm, generating a weak easterly
                                                                                        circulation. From February onward, as solar heating decreases,

       Fig. 9: Two-dimensional frequency distribution of wind speed and wind direc-
       tion in percent of all observations with a wind speed exceeding 2.5 knots. The
       class widths are 5 knots and 20°, respectively.

       Abb. 9: Zweidimensionale Häufigkeitsverteilung der Windgeschwindigkeit
       und der Windrichtung in Prozent aller Beobachtungen mit einer Windge-
       schwindigkeit über 2,5 Knoten. Die Klassenweiten betragen 5 Knoten sowie
       20°.

       super geostrophic flows resulting from a high-pressure ridge
       north of Neumayer. Northerly winds hardly occur.

       Since the Neumayer site is located at the southern edge of the
       circumpolar low-pressure belt surrounding whole Antarctica
       the mean sea-level pressure of the station is just 986.5 hPa.
       According to VAN LOON at al. (1984a, 1984b) a half-year cycle
       in the pressure data with minima during spring and autumn
       should exist. To a certain extend this cycle is detectable in the
                                                                                        Fig. 10: Time-height section of zonal wind in m s-1 from daily radiosonde so-
       full dataset, but mostly hidden behind synoptic disturbances if                  undings in 1993 at Neumayer. Positive values denote wind from west to east;
       only single years are regarded. Precipitation events occur all                   negative values denote wind from east to west.
       year around. In very rare cases during summer, drizzle and
       rainfall are possible. Most of the precipitation is due to slight                Abb. 10: Höhen-Zeit-Schnitt des Zonalwindes in m s-1 aus Radiosondierungen
                                                                                        1993 im Bereich Neumayer. Positive Werte bedeuten Winde von West nach
       to moderate fall of snowflakes, while showers seldom occur.                      Ost, negative Werte bedeuten Winde von Ost nach West.
       Drifting and blowing snow make the quantification of the
       amount of precipitation impossible. Only the annual averaged
       accumulation rate of about 340 mm water equivalent can be
       obtained.

       The annually averaged total cloud amount at Neumayer is 5.1
       octa. During darkness, the total cloud amount can only be
       observed while the moon or stars are visible. Therefore, the
       tendency toward lower total cloud amounts during winter is
       questionable. The mean annual sunshine duration accumulates
       to 1430 hours. The lowest annual sunshine hours were
       recorded 1983 (1134 hours) while the highest value was
       reached in 2003 (2047 hours). The overall tendency is towards
       a significant increase of the sunshine duration.

       All data from the synoptic observations from the Neumayer
       site are stored within MISAWI. Via internet
        they can be obtained interactively. More detailed                       Fig. 11: Mean summer (December, January, February) and winter (June, July,
       analyses of the synoptic observations from distinct years are                    August) profiles of zonal and meridional wind components from Neumayer
       published from by GUBE-LENHARDT et al. 1986, GUBE-                               1983-2005.
       LENHARDT 1987, HELMES 1989, KÖNIG-LANGLO 1992, KÖNIG-
                                                                                        Abb. 11: Mittlere Sommer (Dezember, Januar, Februar) und Winter (Juni, Ju-
       LANGLO et al. 1996, KÖNIG-LANGLO et al. 1998 and SCHMIDT                         li, August) Profile zonaler und meridionaler Windkomponenten im Bereich
       et al. 1994.                                                                     Neumayer 1983-2005.

                                                                                                                                                                 31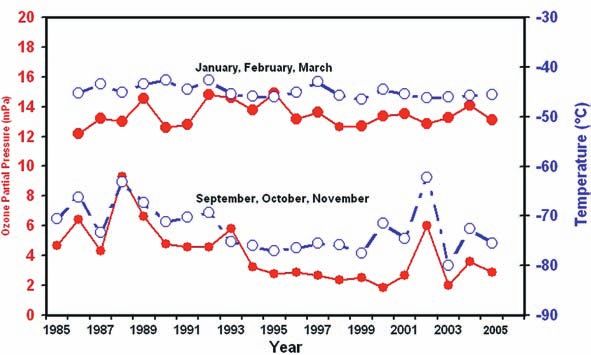
Umbruch PF 76     15.08.2007 16:58 Uhr               Seite 32

       the Antarctic stratosphere cools rapidly, and an intense                         While the circumpolar vortex exists, it isolates its interior effi-
       westerly vortex develops until the stratosphere warms once                       ciently from any significant transport of warm air masses from
       again in the austral spring.                                                     the lower latitudes. The stratospheric winter temperatures
                                                                                        inside the vortex – where no solar absorption takes place
       The meridional components of the upper air wind field are                        during polar night – drop frequently below -80 °C (Figs. 13,
       comparable weak (Fig. 12). At Neumayer a mean meridional                         14). The coldest ever measured temperature at Neumayer was
       transport is hardly observed (Fig. 11). Meridional advection                     -96.9 °C at August 23 2003 in a height of 16033 m. Neumayer
       takes place only during events associated with cyclonic disturb-                 is normally surrounded by this vortex and cold stratospheric
       ances, which affect all height levels of the atmosphere at the                   winter temperatures are predominant. In rare cases, the vortex
       same time. These disturbances can occur in all seasons, and                      dynamically breaks down during winter (1988, 2002) and
       they create southerly as well as northerly winds. The only                       much warmer air masses exist above Neumayer.
       remarkable advection from lower latitudes takes place above
       30 km in November each year, when the upper part of the                          Recent publications denote a significant warming of the
       circumpolar vortex vanishes and sudden stratospheric                             Antarctic winter troposphere (TURNER et al. 2006). The
       warming takes place.                                                             authors analysed long-time radiosonde measurements of nine
                                                                                        Antarctic stations covering the whole continent. The data from
                                                                                        Neumayer, which have not been taken into account in this

       Fig. 12: Time-height section of meridional wind in m s-1 from daily radiosonde
       soundings in 1993 at GvN station. Positive values denote wind from south to
       north; negative values denote wind from north to south.                          Fig. 13: Time-height section of temperature from daily radiosonde soundings
                                                                                        in 1993 at Neumayer Station II.
       Abb. 12: Höhen-Zeit-Schnitt des Meridionalwindes in m s aus Radiosondie-
                                                                 -1

       rungen 1993 an GvN. Positive Werte bedeuten Winde von Süd nach Nord, ne-         Abb. 13: Höhen-Zeit-Schnitt der Temperatur aus den täglichen Radiosondie-
       gative Werte bedeuten Winde von Nord nach Süd.                                   rungen von 1993 bei Neumayer-Station II.

                           Fig. 14: Time-height section of temperature from daily radiosonde soundings from 1983 to 2005 at Neumayer stations.

                     Abb. 14: Höhen-Zeit-Schnitt der Temperatur aus den täglichen Radiosondierungen von 1983 bis 2005 an den Neumayer-Stationen.

       32
Umbruch PF 76 15.08.2007 16:58 Uhr Seite 33
publication, show a comparable trend, but vice versa (Fig. 15). efficiently. This happens normally during the first half of
The winter cooling at Neumayer can be observed in the whole September. Afterwards, the ozone layer within the whole
troposphere down to 2 m above ground. Thus, at this moment vortex is severely depleted or locally destroyed completely.
it seems to be questionable whether the proposed warming of The area with a vertically integrated ozone amount of less than
the Antarctic winter troposphere is significant for whole 200 Dobson is called ozone hole. The ozone hole frequently
Antarctica. covers the total area within the stratospheric vortex. The
worldwide increasing anthropogenic CFC concentration led to
Surface inversions are a common phenomenon at Neumayer. an increasing ozone depletion.
They are created by radiative cooling typically during anticy-
clonic conditions. During wintertime the surface inversions The decreasing ozone concentrations in the Antarctic strato-
can reach heights up to about 2 km. Only from November to sphere lead to a diminished absorption of uv-radiation. Thus,
February, when short-wave radiation gains more than compen- the warming of the Antarctic stratosphere during spring is
sate the long-wave radiative cooling of the surface inversions reduced. The isolating polar vortex – a thermal wind – resists
are rare and are mainly restricted to heights of less than 1 km. longer and the possibility for polar stratified clouds leading to
During stronger cyclonic events they may vanish completely. further ozone depletion is rising. This positive feedback
The difference between the temperatures at the surface inver- mechanism ends when the stratosphere gets warm enough that
sion tops and the surface reach values up to 25 K. At polar stratified clouds cannot exist any longer. The tempera-
Neumayer 75 % of all soundings show an inversion strength of ture gradient across the polar vortex becomes weaker till the
at least 1 K and a minimum height of 50 m. Thus, although vortex loses its isolating character and warm, ozone rich air
surface inversions are a common feature, they are no persistent from lower latitudes can penetrate into the Antarctic strato-
barrier against vertical air mass exchange, even during winter- sphere. This happens normally during November. In rare cases
time. the stratospheric vortex is dynamically unstable and gets de-
stroyed during winter. Comparable high temperatures and high
ozone concentrations during the following spring are the
consequences.
In 1992 a weekly ozone sounding programme (started in 1985
at the near by Georg Forster Station) was transfered to
Neumayer Station II. Both stations are situated comparably
within the area normally surrounded by the Antarctic strato-
spheric vortex. The measurements contribute to the “Global
Atmospheric Watch” (GAW) as well as to the “Network for the
Detection of Stratospheric Change” (NDSC). As can bee seen
clearly (Fig. 16) the ozone layer above the Forster/Neumayer
stations shows a pronounced annual cycle. High ozone partial
pressures are measured at altitudes around 20 km from
December/January till end of August. This ozone originates
from lower latitudes while the polar stratospheric vortex did
not exist. Later, it stays more or less without mayor concentra-
tion changes inside the isolated vortex. From January to
Fig. 15: Time series of the averaged winter (April–September) air temperature August the ozone layer descents about 3 km. The prevailing
of the 2 m (red) and 500 hPa (blue) levels above Neumayer stations. katabatic winds at the surface of Antarctica, leading to a mass
Abb. 15: Zeitserien der gemittelten Lufttemperatur im Winter (April bis Sep- transport out of the area of the polar vortex, are the reason.
tember) in der 2 m (rot) sowie 500 hPa-Ebene (blau) an den Neumayer-Statio- During Antarctic spring (September to November) the ozone
nen. layer vanishes more or less completely. Within the troposphere
the ozone partial pressure is comparable constant with time
and height. Close to the surface an annual variation with
Ozone soundings maxima during polar night and minima during polar day is
evident.
While the polar vortex is established, the advection of ozone
rich and warm air from lower latitudes into the stratosphere of The ozone layer during Antarctic spring shows remarkable
Antarctica is strongly reduced. Thus, during polar night, when inter-annual variations as well as an overall reduction of the
no solar uv-radiation can get absorbed from the ozone layer, ozone partial pressure with time. If the time series from the
the stratosphere cools down to temperatures below -78 °C Neumayer site gets extended with the measurements taken
which allows the formation of polar stratified clouds. With the from the near-by Georg Forster Station these effects are even
increasing meridional temperature gradient across the polar more pronounced (Fig. 17). The ozone reduction is strongly
vortex the wind velocities of the vortex increase. This thermal correlated with a cooling of the stratosphere. Corresponding
wind has mean zonal values well above 50 m s-1 and lead to a variations or a significant trend during other seasons could not
further separation of the air masses inside the vortex. be ascertained. From 1985 till 1989 a biannual oscillation of
the spring ozone concentrations is evident. It is strongly corre-
After the Antarctic winter, when the sun rises above the lated with the temperature in the height of the ozone layer.
horizon and polar stratified clouds are frequent, the solar LABITZKE et al. (1992) explained this behaviour as dynamic-
radiation has the potential to destroy ozone molecules very ally induced from the quasi-biannual oscillation of strato-
33Umbruch PF 76 15.08.2007 16:58 Uhr Seite 34
Fig. 16: Time-height section of ozone partial pressure above Forster/Neumayer Station II from 1985 to 2005.
Abb. 16: Höhen-Zeit-Schnitt des Ozonpartialdrucks über Forster/Neumayer Station II von 1985 bis 2005.
Fig. 17: Time series of seasonally averaged ozone partial pressures
(solid red line) and temperatures (dotted blue line) in the 70 hPa
level above Georg Forster Station and Neumayer Station II.
Abb. 17: Zeitserie des jahreszeitlich gemittelten Ozonpartial-
drucks (durchgezogene rote Linie) und der Temperatur (gestri-
chelte blaue Linie) in der 70 hPa-Ebene über den Stationen Georg-
Forster und Neumayer II.
spheric wind above the equator. In the nineties, no biannual (2006) found a strong correlation between the negative ozone
oscillation of the spring ozone concentration was measured anomalies and the flux of energetic electrons in the radiation
any longer. The data show a more or less continuously reduc- belt, which is modulated by the eleven-year solar cycle. These
tion of the ozone concentration and a cooling of the air around findings suggest a previously unrecognized mechanism by
70 hPa. CRUTZEN et al. (1986) explained this kind of behaviour which solar variability impacts on climate through changes in
as a chemically effect with respect to the worldwide rising polar ozone.
anthropogenic CFC concentrations.
Between 2001 and 2004 the springtime ozone concentrations Radiation measurements
measured above an altitude of 20 km were rising again. This
finding was obvious in the data from NM-II as well as from The averaged surface radiation fluxes at the Neumayer site
the Polar Ozone and Aerosol Measurement satellites (POAM). (Fig. 18) are denoted positive if the surface gains energy. Posi-
This effect was discussed as the beginning of the recovery of tive fluxes contribute to warm the atmospheric boundary layer
the “ozone hole” after the worldwide ban of nearly any CFC or snow, evaporate or sublimate snow, or melting processes.
product. Recent results (HOPPEL et al. 2005) from NM-II Energy losses, associated with cooling, freezing or condensa-
support the assumption that the recovery of the ozone hole tion, are denoted negative. With an averaged global radiation
does not take place yet. Especially, the very high temperatures flux of 118 W m-2 Neumayer receives a comparable high
and ozone concentrations during spring 2002 could be energy input from the sun, but due to the high albedo of the
explained as a result from a dynamically break down of the snow surface (84 %) 99 W m-2 gets reflected without contribut-
Antarctic stratospheric vortex during winter. Although the ing as local energy input. The remaining net short-wave radia-
CFC concentrations in the troposphere are significantly falling tion flux of 19 W m-2 is very small. Low surface temperatures
and start to fall in the stratosphere the recovery of the ozone are the consequence.
layer will most probably not take place within the next decade.
Caused by wind snow surfaces tends to create ripples, so
As a third contribution to the changes in the polar ozone layers called sastrugies. They have a height scale of up to 1 m and a
solar activities are discussed. As an example Sinnhuber et al. length scale of about 10 m. During direct sunshine they can
34Umbruch PF 76 15.08.2007 16:58 Uhr Seite 35
Fig. 18: Mean surface radiation fluxes at Neumayer stations from
1983 to 2005.
Abb. 18: Mittlere Strahlungsflüsse am Boden bei den Neumayer-
Stationen von 1983 bis 2005.
influence instantaneous albedo measurements significantly. advection processes. Small positive monthly averaged net total
Especially during low solar elevations they case shadows or radiation fluxes are observed only in November, December
act as focussing disks. Sastrugies make instantaneous clear and January (Fig. 19). During the rest of the year negative net
sky albedo measurements to a rather questionable task. Fortu- total radiation fluxes exist. Within the 25-years average they
nately, daily averages are still quite unaffected from sastrugies never fall below -21 W m-2. The stabilizing negative feedback
and no problems remain if the global radiation is totally mechanism between the surface temperature and the net total
diffuse. Albedo measurements at stations with a permanent radiation prevent more negative net total radiation fluxes.
snow surface, such as an ice shelf, suffer from a second
problem. Drifting snow tends to get accumulated with respect The mean annual diffuse sky radiation is 76 W m-2 at
to the prevailing wind direction behind the sensors. Even Neumayer. In relation to the mean annual global radiation the
behind delicate platforms (see Fig. 4) the snow surface relative mean annual diffuse sky radiation is 62 %. In the
becomes inclined. This process may take years till it reaches average the sun shines at Neumayer 1429 hours per year which
equilibrium. At Neumayer the prevailing easterly winds lead to is 33.2 % of the theoretically possible sunshine duration. The
a daily cycle in the albedo measurements during direct sun- relative sunshine duration is comparable constant throughout
shine. Monthly averaged albedo values are quite constant. the whole summer. Neumayer becomes more and more sunny.
They only show a slight tendency towards lower value during While the relative sunshine duration was frequently below 30
summer caused by higher solar elevations and some seldom % at the beginning of the measurements, values about 40 %
occurring melting events. During overcast days the averaged are nowadays common.
albedo is 86 %, the averaged clear sky albedo is 5 % less.
The daily averaged measured global radiation fluxes vary only
The snow surface emits the average upward long-wave radia- within rather distinct limits from the corresponding extraterres-
tion flux of 245 W m-2. This corresponds to a black body radia- trial insolation calculated after IQBAL (1983), (Fig. 20). The
tion of -16.8 °C which is very close to the average air upper envelope of the data points obviously present cloud free
temperature of -16.1 °C in 2 m height. The black body appro- days while days totally obscured by opaque clouds led to
ximation holds nearly perfect for the snow surface at
Neumayer. Thus, the upward long-wave radiation flux can be
used to determine the surface temperature quite accurately. In
the average the downward long-wave radiation fluxes is 218 W
m-2. This is significantly lower than the averaged thermal
emitted upward long-wave radiation flux from the surface and
results in an overall net long-wave radiation flux of -27 W m-2.
The downward long-wave radiation flux depends strongly on
clouds. During clear sky situations the flux can be parameter-
ized with the Stefan-Boltzmann radiation law, the 2 m air
temperature and an empirically derived effective atmospheric
emissivity of 0.765 (KÖNIG-LANGLO et al. 1994). Skies totally
obscured by opaque clouds lead to an effective atmospheric
emissivity of about unity and a net long-wave radiation flux of
about zero at the snow surface.
The energy gains from the short-wave budget normally exceed
the net long-wave energy losses. The overall net total radiation Fig. 19: Annual cycle of mean monthly averaged surface radiation fluxes at
is only -7 W m-2, which is more than one order of magnitude Neumayer stations from 1983 to 2005.
less compared with the single fluxes. In the long-time average Abb. 19: Jahresgang der mittleren Monatsmittel von Strahlungsflüssen am
the net total radiation has to be compensated by atmospheric Boden der Neumayer-Stationen von 1983 bis 2005.
35Umbruch PF 76 15.08.2007 16:58 Uhr Seite 36
Fig. 20: Scatter plot of the daily averaged global radiation versus
the daily averaged extraterrestrial insolation at Neumayer stations
from 1983 to 2005.
Abb. 20: Scatterplot der täglich gemittelten Globalstrahlung in
Abhängigkeit der täglich gemittelten extraterrestrischen Einstrah-
lung an den Neumayer-Stationen von 1983 bis 2005.
results at the lower envelope. Both envelopes are more or less increase in the global radiation between 1993 and 2002. This
linear. At totally cloud free days up to 84 % of the extraterres- trend is in good agreement to the increasing sunshine duration
trial insolation reaches the ground at Neumayer. This ex- at Neumayer and the reduced downward long-wave radiation
tremely high value denotes that rayleigh extinction above fluxes. Most probably a change from opaque low clouds
Neumayer dominates the extinction caused by aerosols. Even toward more transparent high clouds took place at Neumayer
during totally cloudy days at least 42 % of the extraterrestrial during the last decades. The reason for this change is unclear
insolation is measured as global radiation at Neumayer. In yet. A local change in the atmospheric circulation pattern
other regions of the world clouds influence the global radia- around Neumayer may be one reason.
tion much more. This small cloud forcing at Neumayer is a
result of the high mean albedo of the permanently snow
covered Ekstrøm Ice Shelf. Multi-reflection between the snow Meteorological forecast centre
surface and the cloud ceiling compensate significant parts of
the cloud extinction processes. During the summer season the meteorological observatory at
Neumayer Station II (NM-II) offers a detailed and individual
The determination of trends in the mean radiation fluxes is one weather forecast service for all activities in Dronning Maud
goal of the Baseline Surface Radiation Network (OHMURA et Land. This service is performed in close cooperation between
al. 1998). This is a rather difficult task since the measurement the AWI and the German Weather Service (DWD). The increas-
accuracy is in the order of possible signals. Only carefully ing flight activities (Fig. 21) within the Dronning Maud Land
performed and homogenized long-time measurements may be and especially the intercontinental air link between Cape Town
used for such kind of trend analysis. WILD et al. (2005) and Novolazarevskaja (DROMLAN) made the establishment
analysed data from Neumayer and found a remarkable of this service mandatory. NM-II Station was chosen for the
Fig. 21: The Dronning Maud
(Queen Maud) Land and the
typical flight routes within the
DROMLAN air network.
Abb. 21: Darstellung der typi-
schen Flugverbindungen im
Queen Maud (Dronning-
Maud) Land im Rahmen des
DROMLAN-Flugnetzes.
36Umbruch PF 76 15.08.2007 16:58 Uhr Seite 37
forecast service due to its central position within the Dronning Due to many previous voyages on board of the German RV
Maud Land, its good communication facilities including a “Polarstern” the summer forecasters from NM-II are well
permanent satellite data link (128 kb, Intelsat), and the modern experienced with the typical weather phenomena of Antarctica
infrastructure of the meteorological observatory. and its surrounding oceans. The forecaster can be reached
during summer at any time from all DROMLAN members by
The forecasts base on special model outputs from the Euro- mail, fax, telex, phone, and by short-wave communication.
pean Centre for Medium-Range Weather Forecasts (ECMWF), Typically, more than 1000 forecasts get performed in one
the Antarctic Mesoscale Prediction System (AMPS) and the summer season for about 20 different field parties, ships,
Global-Model of the German Weather Service (GME). New stations and especially aircrafts. It is obvious, that this service
outputs are available twice a day. They are used to cover a contributes considerably to the increase the safety of the ambi-
forecast period up to one week. For short-term forecasts and tious projects going on in the Dronning Maud Land. Further-
flight-following activities the satellite picture receiving station more, it helps to reduce weather induced idle times of
from NM II (HRPT, SeaSpace) is of great importance. Up to expensive flight operations to a minimum. During winter no
20 satellite passes can be obtained daily (NOAA 12, 14, 15, official forecast service is available. Nevertheless, the winter-
16, 17, 18 DMSP 12, 13, 14, and 15). Visual as well as ing meteorologist is able to give certain weather advices on
infrared pictures get geocoded automatically on a variety of request for all NM-II activities and the surrounding stations.
masters covering the synoptic scale (2500 x 5000 km, Fig. 22)
down to local scale with a spatial resolution up 500 x 500 m at
References
any place in the Dronning Maud Land (Fig. 23).
Crutzen, P.J. & Arnold, F. (1986): Nitric acid cloud formation in the cold
All information from the GTS including the three-hourly Antarctic stratosphere: A major cause for the springtime “ozone hole”.-
Nature 324: 651-655.
synoptic observations and daily upper air soundings are avail- Gube-Lenhard, M. & Obleitner F. (1986): The meteorological data of the
able via the permanent data link at any time. Information from Georg-von-Neumayer Station for 1981 and 1982.- Rep. Polar Res. 30:1-
surrounding automatic weather stations transponding via 41.
ARGOS but not included into the GTS get extracted automati- Gube-Lenhard, M. (1987): The meteorological data of the Georg-von-
Neumayer Station for 1983 and 1984.- Rep. Polar Res. 38: 1-110.
cally from the digital NOAA-satellite data stream received at Helmes, L. (1989): The meteorological data of the Georg-von-Neumayer
NM-II. Station for 1985, 1986 and 1987.- Rep. Polar Res. 64: 1-90.
Fig. 22: Example of a full
scale satellite picture received
and processed at Neumayer
Station II.
Abb. 22: Beispiel eines auf der
Neumayer-Station II empfan-
genen und prozessierten
großskaligen Satellitenbildes.
37Umbruch PF 76 15.08.2007 16:59 Uhr Seite 38
Fig. 23: Example of a local
scale satellite picture received
and processed at Neumayer II.
Abb. 23: Beispiel eines auf der
Neumayer-Station II empfan-
genen und prozessierten lo-
kalskaligen Satellitenbildes.
Hoppel, K., Nedoluha, G., Fromm, M., Allen, D., Bevilacqua, R., Alfred, J., Ohmura, A., Dutton, E., Forgan, B., Fröhlich, C., Gilgen, H., Hegner, H.,
Johnson, B. & König-Langlo, G. (2005): Changes in ozone loss at the Heimo, A., König-Langlo, G., Mcarthur, B., Müller, G., Philipona, R.,
upper edge of the Antarctic ozone hole during 1994-2005.- Proc. AGU Pinker, R., Whitlock, C. H., Wild, M. (1998): Baseline Surface Radiation
Fall Meeting 2005, San Francisco. Network (BSRN/WRMC), a new precision radiometry for climate rese-
Iqbal, M. (1983): An introduction to solar radiation.- Academic Press, arch.- Bull. Amer. Meteor. Soc. 79: 2115-2136.
Toronto. Schmidt, T. & König-Langlo, G. (1994): Radiation measurements at the
König-Langlo, G. (1992): The meteorological data of the Georg-von- German Antarctic Station Neumayer 1982-1992.- Rep. Polar Res. 146: 1-
Neumayer Station (Antarctica) for 1988, 1990 and 1991.- Rep. Polar Res. 66.
116:1-70. Sinnhuber, B.-M., Gathen, P. von der, Sinnhuber, M., Rex, M., König-Langlo,
König-Langlo, G. (2005): Meteorological synoptical observations from G. & Oltmans, S. J. (2006): Large decadal scale changes of polar ozone
Neumayer station, Antarctica during 2004.- PANGAEA, suggest solar influence.- Atmospheric Chemistry Physics
doi:10.1594/PANGAEA.269656. Turner, J., Lachlan-Cope, T.A., Colwell, S., Marshall, G.J. & Connolley, W.M.
König-Langlo, G. (2006): Radiosonde at Georg-von-Neumayer station on (2006): Significant warming of the Antarctic winter troposphere.-
1987-03-16 09:28h.- PANGAEA, doi:10.1594/PANGAEA.373190 Science 311: 1914-1917.
König-Langlo, G. & Augstein E. (1994): Parameterization of the downward Van Loon, H. & Rogers, J.C. (1984a): The yearly wave in pressure and zonal
long-wave radiation at the Earth’s surface in polar regions.- Meteorol. Z. geostrophic wind at sea level on the Southern Hemisphere and its interan-
N.F.3: 343-347. nual variability.- Tellus 36: 348-354.
König-Langlo, G. & Herber, A. (1996): The meteorological data of the Van Loon, H. & Rogers, J.C. (1984b): Interannual variations in the half-year
Neumayer Station (Antarctica) for 1992, 1993 and 1994.- Rep. Polar Res. cycle of pressure gradients and zonal wind at sea level on the Southern
187: 1-101. Hemisphere.- Tellus 36: 76-86.
König-Langlo, G., King, J. & Pettré, P. (1998): Climatology of the three Wild, M., Gilgen, H., Roesch, A., Ohmura, A., Long, C.N., Dutton, E.G.,
coastal Antarctic stations Dumont D'urville, Neumayer and Halley.- J. Forgan, B., Kallis, A., Russak, V. & Tsvetkov, A. (2005): From dimming to
Geophys. Res. 103/D9: 10935-10946. brightening: Decadal changes in solar radiation at Earth’s surface.-
Labitzke, K. & van Loon, H. (1992): On the association between the QBO and Science 308: 847-850.
the extratropical stratosphere.- J. Atmos. Terr. Phys. 54: 1453-1463
38You can also read