ACCESSIBILITY AND CONNECTIVITY CHALLENGES OF MASS RAPID TRANSIT IN KUALA LUMPUR, MALAYSIA
←
→
Page content transcription
If your browser does not render page correctly, please read the page content below
ACCESSIBILITY AND CONNECTIVITY CHALLENGES OF                       Vo Van Dut
MASS RAPID TRANSIT IN KUALA LUMPUR, MALAYSIA

ACCESSIBILITY AND
CONNECTIVITY CHALLENGES OF
MASS RAPID TRANSIT IN KUALA
LUMPUR, MALAYSIA
by Vo Van Dut
MIT-UTM Malaysia Sustainable Cities Program
Massachusetts Institute of Technology

         Abstract
        Mass Rapid Transit (MRT) is a modern public transportation mode,
involving highway lanes or rights-of-way dedicated exclusively to specially
designed buses. MRT is one of the most effective ways to reduce the use
of private vehicles for daily travel in big cities. The success of MRT,
however, depends on the reliability of service, the speed at which vehicles
can travel, and their overall attractiveness to passengers. This study of the
introduction of MRT in Kuala Lumpur, Malaysia, makes clear that the level
of accessibility and connectivity of MRT are vital.
        The study investigates how accessibility and connectivity affect the
“ride experience” of MRT users. Survey results suggest that:
           1) Feeder bus services in residential areas are crucial;
           2) Lack of connection with other public transport modes can
               undermine interest in switching to MRT;
           3) Multi-mode fare passes that link MRT to other transit
               connections are necessary;
           4) Limited park and ride space and bicycle parking at MRT
               stations, along with the cost of parking, can inhibit MRT use;
               and
           5) The availability of commercial services like shopping in and
               around MRT stations can adversely affect potential MRT
               riders’ decision to use MRT.
        Results show that the average number of trips per MRT user
depends primarily on the accessibility and connectivity of MRT stations.
The paper offers policy recommendations aimed at encouraging more
riders to reduce their reliance on private vehicles through increased use of
MRT services.

Malaysia Sustainable Cities Program, Working Paper Series                   1
© Vo Van Dut & Massachusetts Institute of Technology 2017
ACCESSIBILITY AND CONNECTIVITY CHALLENGES OF Vo Van Dut
MASS RAPID TRANSIT IN KUALA LUMPUR, MALAYSIA
Introduction
Traffic congestion and pollution are two significant problems that
confront many urban areas in Malaysia, including the capital region of
Kuala Lumpur (KL). Mass Rapid Transit (MRT) can increase rail
transportation opportunities by providing a premium quality service at a
reasonable fare, when compared with other transport modes—an option
that a significant segment of KL’s population wants—and by integrating
many of the existing rail networks (Fouracre, Dunkerley, and Gardner
2003). Furthermore, MRT expansion can reduce the number of travelers
using private vehicles and hence alleviate the severe traffic congestion
and pollution in the city.
To meet customers’ needs, public transport services, especially
MRT, must follow regular schedules; be safe and efficient; guarantee high-
quality service; and use resources effectively. For an MRT system to
achieve all of these qualities, both good accessibility and connectivity are
necessary. Good accessibility facilitates the convenient use of MRT
services by people with various needs and circumstances. Good
connectivity provides services between users’ origin and destination, and
offers return trips at times that suit users’ schedules.
Having recognized the potential benefits of MRT, Malaysian
transportation authorities undertook the first MRT project in 2010, with the
first entire Line MRT in KL beginning operations in July 2017. As with any
new public transport service introduced to the public, however, the MRT in
its initial stages faces challenges. The objective of this study is to
investigate those challenges—particularly the challenges of accessibility
and connectivity—and how they affect users’ MRT experience. By
documenting these challenges and offering policy implications, we hope to
help developing cities improve their planning of future MRT systems.
The next section of this study provides background on the role of
Mass Rapid Transit (MRT) in public transport, and its contributions to
reducing congestion and pollution in cities. This is followed by a review of
the importance of accessibility and connectivity for the success of an MRT
system. Next is an overview of the context for MRT in Malaysia. This is
followed by a summary of my research methodology. In the study’s final
section, I present findings and make policy recommendations.
Background: Mass Rapid Transit
What is mass rapid transit?
Mass rapid transit is defined as “modes of urban transport (both
road and rail based) that carry large volumes of passengers quickly”
Malaysia Sustainable Cities Program, Working Paper Series 2
© Vo Van Dut & Massachusetts Institute of Technology 2017ACCESSIBILITY AND CONNECTIVITY CHALLENGES OF Vo Van Dut
MASS RAPID TRANSIT IN KUALA LUMPUR, MALAYSIA
(Fouracre, Dunkerley, and Gardner 2003). These modes tend to be
located along well-defined corridors connecting suburbs to city centers,
and have reserved right-of-way for part or all of their route.
MRT systems have been categorized according to the type of
technology used and their degree of segregation from traffic. MRT
consists of a spectrum of modes of urban public transport that apply
specific fixed-track or exclusive and separated use of a potentially
common-user road track. The role and form of MRT, of course, depends
on the city context: its size, income level, asset base, institutions, existing
transport systems, and other cultural and behavioral factors (Rahman
2008).
MRT systems include several transport modes in both road and rail.
According to Fouracre et al. (2003), the most common MRT systems
include buses using dedicated rights-of-way (ROW); tramways using light,
electrically powered cars on ROW; Light Rapid Transit (LRT) that employs
a fully segregated and often grade-separated ROW and advanced control
systems; metros using fully segregated, and grade-separated, track that
may be elevated or underground. Suburban rail tends to be part of a larger
rail network, often at grade but separated from road traffic.
In this study, I focus on metros, which employ very advanced
control systems that allow high-frequency operations. They are also made
up of multiple units of high-capacity “heavy” cars. Although metros are the
most expensive type of system, they provide high levels of speed and
frequency in their service. The rest of this study uses the term “MRT” to
imply “metro.”
MRT’s role in public transport and contributions to
reduce traffic congestion
Most cities in the developing world have very limited resources to
cope with the high levels of public transport demand they experience. The
selection of the most appropriate mass transit mode can be difficult, in part
because there are many pressures on civic leaders to favor one system
over another. Several previous studies indicate that MRT can offer a high
level of energy savings and cleanliness, making it one of the most favored
types of transport modes (Rahman 2008; Li 2013). MRT has been
adopted in major cities around the world (e.g., Singapore, Hong Kong).
Many experts believe that MRT can reduce congestion, improve quality of
life through reducing pollution, and reduce fuel consumption by private
vehicles (Vanany et al. 2015). In addition, many scholars also point out
that MRT has other benefits such as high capacity, fast travel times and
high frequency, and is designed to stop at many stations in urban
centers).
Malaysia Sustainable Cities Program, Working Paper Series 3
© Vo Van Dut & Massachusetts Institute of Technology 2017ACCESSIBILITY AND CONNECTIVITY CHALLENGES OF Vo Van Dut
MASS RAPID TRANSIT IN KUALA LUMPUR, MALAYSIA
MRT also provides a premium quality service at a premium fare,
compared with buses. This segments the travel market, and results in
“competing” bus services, which are used by lower-income travelers. The
fee to ride MRT is in part determined by the competing bus services, and
is designed to attract premium bus passengers who would otherwise take
express/air-conditioned/guaranteed seating buses, as well as a large
number of lower middle-income bus passengers. Only if it attracts multiple
segments of bus ridership is the metro likely to attract the mass ridership
that its high cost requires.
Apart from these benefits, an MRT system holds the potential not
only to significantly leverage an existing inadequate rail network, but also
to integrate existing rail networks. For all of these reasons and more, MRT
is deemed as a crucial component to secure long term advances in public
transport—or at least to stabilize the share of people traveling by public
rather than private transport (How 1990). As a result, MRT has become
one of the most popular types of public transport in developing cities
around the world.
The role of MRT in reducing pollution
As noted, a crucial role of MRT is its contribution to reducing
pollution in cities. Experts indicate that an efficient, comfortable transport
system can convince many people leave their vehicles at home and use
the MRT to commute. Building an MRT system not only help commuters
avoid traffic congestion, but also helps reduce air pollution (Fox 2000).
The driverless technology and well-ventilated stations located at key areas
reduce commute time, and also help to decrease air pollution. Fox (2000)
also states that as an MRT system replaces existing buses, it skews the
traffic composition towards cleaner vehicles and reduces vehicle-
kilometers traveled. Overall, MRT can have a strategic impact upon the
city form, leading to a denser urban form and a more sustainable
development path (Fouracre, Dunkerley, and Gardner 2003).
Empirically, Kaho et al. (2008) estimate that at current levels of use,
public transit services in the United States such as MRT and commuter
trains avoid emissions of at least 6.9 million metric tons of CO2
equivalent—by substituting for automobile travel and reducing traffic
congestion—and possibly much more by creating more accessible land
use patterns (Kaho et al. 2008). They estimate that a typical household
could reduce its total greenhouse emissions by 25-30 percent by shifting
from two to one vehicles, as can occur if they move from an automobile-
dependent community to transit-oriented development. One study—
drawing on data from the National Transit Database combined with
information from the United State Department of Energy and the United
Malaysia Sustainable Cities Program, Working Paper Series 4
© Vo Van Dut & Massachusetts Institute of Technology 2017ACCESSIBILITY AND CONNECTIVITY CHALLENGES OF Vo Van Dut
MASS RAPID TRANSIT IN KUALA LUMPUR, MALAYSIA
State Environmental Protection Agency—indicates that the use of public
transportation offers a low-emissions alternative to driving (Hodges 2010).
Another national-level study, conducted by Kwan et al., estimates
the changes in carbon dioxide (CO 2 ) emissions and the health co-benefits
from two new mass rapid transit (MRT) lines in Greater Kuala Lumpur,
Malaysia. Changes in CO 2 and air pollutant emissions were estimated
from motor vehicle activity based on the travel information collected from a
survey. The result reveals that MRT lines would reduce 6 percent of CO 2
equivalent emission from private motor vehicles in Greater Kuala Lumpur,
and provide important health co-benefits to the population (S. C. Kwan et
al. 2017).
The importance of accessibility and
connectivity to MRT
Several previous works on public transport have focused on
accessibility (Morris, Dumble, and Wigan 1979; Handy and Niemeier
1997; Polzin 1999; M. P. Kwan and Weber 2003; Zhu and Liu 2004;
Wibowo and Olszewski 2005; Prasertsubpakij and Nitivattananon 2012;
Djurhuus et al. 2014; Papaioannou and Martinez 2015) and connectivity
(Guo and Wilson 2011; Hadas and Ranjitkar 2012; Mishra, Welch, and
Jha 2012; Welch and Mishra 2013; Papaioannou and Martinez 2015). The
review of this body of literature is composed of two parts. The first
subsection offers discussion on the importance of accessibility for the
development of public transport and the success of MRT in developing
cities, while the second subsection covers the importance of connectivity.
Accessibility
Based on previous studies (Morris, Dumble, and Wigan 1979;
Wibowo and Olszewski 2005; Papaioannou and Martinez 2015),
accessibility in this context is defined as the ease with which activities may
be reached from a given location by means of a particular mode of
transportation.
MRT accessibility has become a major issue for authorities in many
of the world’s large cities, because they aspire to shape the future through
implementation of efficient mass transit systems. Several studies stress
that accessibility plays an important role with respect to the success of
public transportation and MRT systems. Papaioannoua and Martinez
(2015) noted that one of the key factors affecting public transport mode
choice of users is accessibility. Accessibility represents the potential of the
user to perform his/her activities.
Accessibility can be considered from two perspectives. The first is
proximity relative to the points of access to the MRT system—both at
Malaysia Sustainable Cities Program, Working Paper Series 5
© Vo Van Dut & Massachusetts Institute of Technology 2017ACCESSIBILITY AND CONNECTIVITY CHALLENGES OF Vo Van Dut
MASS RAPID TRANSIT IN KUALA LUMPUR, MALAYSIA
origin and destination—which has been proven to be a key deciding factor
in the modal choice process (Givoni and Rietveld 2007; Moniruzzaman
and Páez 2012). The second is the ease of displacement considered in
relation to cost (of time or tariff) to reach the desired activities. This is
associated with the density, diversity, and design of the built environment,
both at trip origin and destination—sometimes referred to as the “3Ds”
(Cervero and Kockelman 1997).
Prasertsubpakij and Nitivattananon (2012) found that providing
suitable accessibility increased the use of MRT systems in Bangkok,
because certain segments of the population (e.g. women, the elderly and
disabled people) were able to take MRT easily (Prasertsubpakij and
Nitivattananon 2012). These authors note that women—who tend to have
less access to MRT—are likely to have multiple purposes associated with
their trips. Good accessibility of a MRT system can help them achieve
those multiple objectives.
Many studies (Geertman and Ritsema Van Eck 1995; Handy and
Niemeier 1997; Zhu and Liu 2004) use a potential gravity model to
delineate accessibility into two elements: the activity element (spatial
distribution and attraction of various activities), and the transportation
element (travel distance, time, or cost to reach specific sites by certain
transportation modes) (Figure 1). The greater accessibility is, the less time
and money are spent in travel, and the more activities that can be reached
in a given amount of time and within a certain budget (Zhu and Liu 2004;
Prasertsubpakij and Nitivattananon 2012). Hence, it is argued that
maximizing the accessibility of MRT system is one of the fundamental
goals of transportation planning and urban development—which in turn
facilitates the development and the success of MRT projects.
Spatial distribution
Activity
element
Attraction of various
MRT activities
accessibility
Travel distance
Transportation
element
Time and cost for
reaching specific sites
by certain transportation
modes
Malaysia Sustainable Cities Program, Working Paper Series 6
© Vo Van Dut & Massachusetts Institute of Technology 2017ACCESSIBILITY AND CONNECTIVITY CHALLENGES OF Vo Van Dut
MASS RAPID TRANSIT IN KUALA LUMPUR, MALAYSIA
Figure 1. Potential gravity model1
Similarly, Soltani et al. (2012) point out that accessibility is
increasingly recognized as a key element of a high quality, efficient, and
sustainable public transport system. According to Turcotte (2005),
inaccessibility to the built physical environment is one of the significant
barriers to full participation of persons with disabilities in society (Turcotte
2005)—for example, when disabled people face challenges and difficulties
in using MRT service.
“Accessibility” is also defined by the attractiveness of individual
destinations served by MRT. Individual origins may also be weighted by
their socioeconomic factors, such as the number of residents, age, and
social /economic status. These factors help determine the potential
demand for particular activities. Most accessibility measures assume that
accessibility between origins and destinations is directly proportional to the
associated demand and attraction, and inversely proportional to the
distance or time or cost for traveling between them. Over the last four
decades, various accessibility measures have been developed and used
to evaluate the performance of urban transportation systems, and serve
as a basis for making trade-offs between land use and transportation
policies (Davidson 1977; Páez, Scott, and Morency 2012; Moniruzzaman
and Páez 2012). Zhu and Liu (2012) indicate that maximizing accessibility
becomes an important agenda in urban transportation planning, and
creates new services and activities, which in turn persuades more people
to use metros.
In sum, addressing the multiple dimensions of accessibility
contributes significantly to the success of MRT projects.
Connectivity
Another issue that greatly influences the success of public
transport, including MRT, is connectivity (Beimborn, Greenwald, and Jin
2003; A. (Avi) Ceder and Teh 2010; Papaioannou and Martinez 2015).
Connectivity is deemed to be good when service exists between users’
origin and destination, and provides return trips at times that match the
users’ schedule. Connectivity also involves customer’s ease of transferring
from one public transit system (such as MRT) to another (Associates et al.
2006). Factors like long travel time and high number of transfers—
determined by the design of the network—sometimes discourage potential
users from choosing public transport (Guo and Wilson 2011). Other
aspects, including the route of the public transport service and the
travelling distance between origin and destination, affect the speed of
public transport (Papaioannou and Martinez 2015; Welch and Mishra
2013; Mishra, Welch, and Jha 2012). Private vehicles can follow direct
Malaysia Sustainable Cities Program, Working Paper Series 7
© Vo Van Dut & Massachusetts Institute of Technology 2017ACCESSIBILITY AND CONNECTIVITY CHALLENGES OF Vo Van Dut
MASS RAPID TRANSIT IN KUALA LUMPUR, MALAYSIA
routes to their destinations and—in many cases—achieve higher speeds,
and may dissuade potential users from choosing public transport
(Beimborn, Greenwald, and Jin 2003).
To sum up: Many scholars (Beimborn, Greenwald, and Jin 2003; A.
(Avi) Ceder and Teh 2010) argue that for MRT to prevail in the competition
for users, the system must good connectivity. Good connectivity is defined
as a convenient and seamless system that reduces travel times, provides
reliable connections, and ensures easy and safe transfers.
Conversely, poor connections can cause passengers to stop using
the MRT service (A. Ceder, Net, and Coriat 2009; Hadas and Ranjitkar
2012; Papaioannou and Martinez 2015). When connectivity is poor, trips
are lengthy and costly. In addition, weak segments of the public transport
connectivity network will experience increased congestion and passenger
accumulation at specific stations and stops, resulting in delays and
passenger frustration (A. Ceder and Perera 2014). For these reasons and
more, Ceder et al. (2009) state that improving connectivity is a vital task in
transit operations planning.
Public transport context and MRT system
in Malaysia
Kuala Lumpur (KL), the capital city of Malaysia, is ranked as the
second-most competitive global city in Southeast Asia by the Economist
Intelligence Unit. The city is a center for the country’s finance, insurance,
real estate, and media industries. It is Malaysia’s most populous city, with
(in 2017) 7 million residents within its 243 square kilometers—a population
total that is projected to increase to 20 million by 2020. Greater Kuala
Lumpur (also known as the Klang Valley) where the greatest percentage
of Malaysia’s population resides, contributes 30 percent of the national
gross domestic product (GDP) (S. C. Kwan et al. 2017).
Given the city’s and region’s economic importance, and in light of
its growing population density, an adequate public transport system is key.
Today’s system—intended, in part, to minimize heavy traffic congestion in
KL—includes a variety of services such as rapid bus transport (BRT), light
rail transit (LRT), one monorail line, commuter rail (Keretapi Tanah
Melayu, or KTM), an airport rail link, and an emerging MRT network. The
MRT project is considered a crucial component of the Greater Kuala
Lumpur National Key Economic Area, and the largest infrastructure project
in the country. Line One of the MRT system is currently in operation, with
Lines 2 and 3 now under construction.
The range of public transport modes that exist in KL poses the
question of why MRT was chosen over other available options, such as
Malaysia Sustainable Cities Program, Working Paper Series 8
© Vo Van Dut & Massachusetts Institute of Technology 2017ACCESSIBILITY AND CONNECTIVITY CHALLENGES OF Vo Van Dut
MASS RAPID TRANSIT IN KUALA LUMPUR, MALAYSIA
bus rapid transit. According to the Land Public Transport Master Plan, the
KL Local Plan calls for the public transport modal share to increase from
18 percent to 40 percent by 2020. The Land Public Transport authority
believes that the MRT project addresses several key challenges, such as
urban sprawl due to population increase, poor existing intra-modal and
inter-modal integration between various public transport modes, and
unsustainable growth in private transport demand. The project is intended
to substantially expand rail network coverage and capacity; provide
adequate connectivity between modes and rail lines; and run rail lines
through high travel demand areas. In terms of connectivity, the MRT Lines
in KL will have four interchange stations that would allow passengers to
transfer between lines easily. In addition, the MRT in KL is intended to
create an economically efficient urban environment; improve productivity,
and promote social equality and quality of life in the Klang Valley. In
addition, the project’s proponents make the case that it will effect travel-
time savings, reductions in vehicle operating costs, and reductions in
accidents (as rail is much safer than road transport). In addition, the
reduction in vehicle emissions resulting from the shift from road to rail is
expected to be substantial. Other benefits such as economic growth, job
creation and increased tax revenues to the government are anticipated to
continue during the latter phases of construction.
The MRT project in Malaysia—part of the country’s comprehensive
National Transformation Programme—is intended to propel Malaysia to
developed-nation status by 2020. Three lines have been planned for the
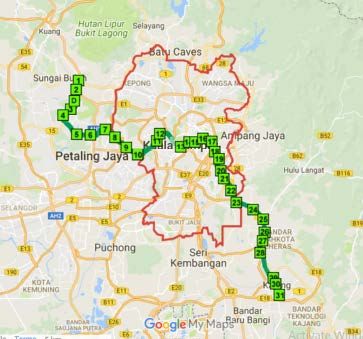
Klang Valley MRT Project. Line 1 is the main subject of this study (Figure
2): the 51 km MRT Sungai Buloh-Kajang (SBK) Line (known as MRT SBK
Line). It originates in Sungai Buloh, located to the northwest of Kuala
Lumpur, and runs through the city center before ending in Kajang, a
rapidly developing town to the southeast of the city. The line runs
underground for a distance of 9.5 km beneath the center of Kuala Lumpur,
while the rest of the alignment is elevated. The SBK Line has 31 stations,
of which seven are underground.
Malaysia Sustainable Cities Program, Working Paper Series 9
© Vo Van Dut & Massachusetts Institute of Technology 2017ACCESSIBILITY AND CONNECTIVITY CHALLENGES OF Vo Van Dut
MASS RAPID TRANSIT IN KUALA LUMPUR, MALAYSIA
Figure 2. The 31 stations of the MRT SBK Line in Greater Kuala
Lumpur
Each train serving the line has four cars, accommodating a total of
1,200 passengers. The daily ridership is estimated to be about 400,000
passengers. Trains run at a frequency of 3.5 minutes at peak hours.
Figure 3 displays MRT ridership in Kuala Lumpur, as recorded since the
first MRT Line began operating in December 2016. Figure 3 shows a
significant increase in the number of passengers between August and
September, due to half prices fares offered during the Southeast Asian
(SEA) Games leading up to Hari Merdeka, or Malaysian Independence
Day, on August 31.
Malaysia Sustainable Cities Program, Working Paper Series 10
© Vo Van Dut & Massachusetts Institute of Technology 2017ACCESSIBILITY AND CONNECTIVITY CHALLENGES OF Vo Van Dut
MASS RAPID TRANSIT IN KUALA LUMPUR, MALAYSIA
4,500,000
4,188,478
4,000,000
3,500,000
3,000,000
2,500,000 3,100,360
2,000,000 1,932,664
1,500,000
1,000,000 727,591
350,897 427,368 387,816 404,758
500,000 368,644
0
Figure 3. MRT SBK line ridership, January 2017−September 2017 2
The second MRT line in KL is the Sungai Buloh-Serdang-Putrajaya Line
(known as MRT SSP Line or MRT2), which will be 53 km long. Presently it
is 10 percent complete, and is due to open in two phases in 2021 and
2022. The third line, known as the “circle line” but still without a formal
name, will a 40-km to 50-km loop. It is now in the feasibility-study stage.
In terms of MRT project management, plan, and design, the Land
Public Transport Commission (Suruhanjaya Pengangkutan Awam Darat,
known as SPAD) plans, regulates, and enforces all matters related to land
public transport in Peninsular Malaysia. It is, therefore, the supervising
agency for the MRT project. A separate entity, Mass Rapid Transit
Corporation Sdn Bhd (known as MRT Corp) was set up in 2011 to develop
and own the assets of the MRT system. It is, in turn, fully owned by the
Minister of Finance. MRT Corp is responsible for the procurement
process, awarding of contracts, monitoring construction, dispute
resolution, scheduling adherence, and compliance with health, safety,
security, and environment requirements. Finally, Prasarana Malaysia
Berhad (Prasarana) is a 100 percent government-owned company set up
by the Ministry of Finance that owns the assets of all multi-modal public
transport in Malaysia, as part of the government's larger efforts to
restructure the city's public transport system. Prasarana acts as a co-
operator of MRT.
Research Methodology
Data Collection
Malaysia Sustainable Cities Program, Working Paper Series 11
© Vo Van Dut & Massachusetts Institute of Technology 2017ACCESSIBILITY AND CONNECTIVITY CHALLENGES OF Vo Van Dut
MASS RAPID TRANSIT IN KUALA LUMPUR, MALAYSIA
This study’s scope and problem statement were defined through an
initial review of literature, government reports, and blog articles. It is
informed by both secondary data and survey (primary) data. Secondary
data was collected from the websites of MRT Corporation, the Ministry of
Transport Malaysia, and SPAD. Information on stations, facilities,
interchange, bus, number of units, size of unit, type of business, name of
shops, etc. at each station have been collected from the official SBK MRT
Line website. These were then sorted into a spreadsheet matrix before
being integrated with the primary data.
Primary data were obtained from fieldwork that was conducted
between September 2017 and January 2018. A semi-structured
questionnaire was used to collect baseline data, which were then
combined with data from participatory methods (i.e., informant interviews
and in-depth interviews) to generate meaningful qualitative data. The
semi-structured questionnaire was written in both English and Malaysian,
and consisted of three parts: location and demographic characteristics, trip
characteristics, and public perception of the current challenges of MRT.
The survey was conducted at all 31 MRT stations in Kuala Lumpur.
In all, 106 questionnaires were conducted on site with individuals
who live near MRT stations in Kuala Lumpur. The participants, selected at
random, were interviewed face-to-face by research assistants who served
as local interviewers. To avoid oversampling from a particular station, no
more than six people were interviewed at any MRT station. To test the
reliability of the questionnaire, 12 people were selected as pilots. Once
compiled, the data were then disaggregated by social characteristics,
including gender, education, and occupation. In addition, to represent the
views of local transportation authority officials, five in-depth interviews
were conducted, with representatives from Prasarana Malaysia Berhad
(Prasarana), the Mass Rapid Transit Corporation Sdn Bhd (MRT Corp.),
the Land Public Transport Commission (SPAD: Suruhanjaya
Pengangkutan Awam Darat), and a member of Parliament (two
interviews).
Analysis
A qualitative technique was employed to interpret and analyze the
collected data. Survey results were compiled for the purpose of data
editing, “cleaning,” and data coding. Data processing and analysis were
performed using Stata. Data analysis of information gathered from the
questionnaire was sorted in the form of tables.
The analysis process was conducted in three steps. First, a
statistical analysis was conducted to determine the distribution of the
survey sample and the respondents’ characteristics. (This step reveals
whether there is a difference between users’ characteristics and their
Malaysia Sustainable Cities Program, Working Paper Series 12
© Vo Van Dut & Massachusetts Institute of Technology 2017ACCESSIBILITY AND CONNECTIVITY CHALLENGES OF Vo Van Dut
MASS RAPID TRANSIT IN KUALA LUMPUR, MALAYSIA
responses to questions about accessibility and connectivity at each MRT
station in KL.) Second, after cleaning the information obtained from the
collection of secondary data, that information was imported into one
spreadsheet matrix, enabling researchers to assess the current state of
accessibility and connectivity at each of the 31 MRT stations. This step
identifies facilities that are available in each of the stations, and how they
contribute to the accessibility and connectivity of each MRT station. Third,
the information derived through this the second step is integrated with the
respondents’ answers in the survey corresponding to the MRT station in
the second step. This method enabled the researchers to capture how
elements relating to accessibility and connectivity at each MRT station
affect the user’s MRT ride.
To make this possible, the respondents at each MRT station were
asked: “Given the current facilities provided at the nearest MRT station
(park and ride, sign, information, interchange, frequency of train, and other
facilities), how many times in a typical week do you ride MRT in Kuala
Lumpur?” Based on this information, the average number of trips per user
was calculated at each MRT station—data that could then be cross-
referenced with the results in the accessibility and connectivity matrix for
each MRT station. Again, the aim was to determine whether there is a
discernible relationship between the accessibility and connectivity and the
actual ridership—and by extension, to determine how users and non-users
respond to the current state of accessibility and connectivity at each MRT
station.
Findings and results
Distribution of sample
Table 1 represents the distribution of the 106 respondents at each
MRT station of the SBK MRT Line who participated the survey.
Passengers at all 31 MRT stations were surveyed. Bandar Utama, Parsa
Sani and Sematan stations had the largest number of respondents (6
respondents, 5.6 percent), followed by Bukit Bintang (5 respondents, 4.72
percent). Kwasa Damansara, Mutiara Damansara, Muzium Negara, Phileo
Damansara, Sri Raya, Sungai Buloh, Sugai Jernih, Taman Connaught and
Taman Mutiara stations had 4 respondents for the survey. Each of the
remaining MRT stations had either 2 or 3 respondents.
No. Name of MRT station Frequency
1 Bandar Utama (BU) 6
2 Batu Sebelas Cheras
(BSC) 2
Malaysia Sustainable Cities Program, Working Paper Series 13
© Vo Van Dut & Massachusetts Institute of Technology 2017ACCESSIBILITY AND CONNECTIVITY CHALLENGES OF Vo Van Dut
MASS RAPID TRANSIT IN KUALA LUMPUR, MALAYSIA
No. Name of MRT station Frequency
3 Bukit Bintang (BB) 5
4 Bukit Dukung (BD) 2
5 Cochrane (CO) 3
6 Hussien Onn (HO) 3
7 Kajang (KJ) 3
8 Kampung Selamat (KS) 2
9 Kota Damansara (KD) 3
10 Kwasa Damansara (KwD) 4
11 Kwasa Sentral (KwS) 3
12 Maluri (MA) 3
13 Merdeka (ME) 2
14 Mutiara Damansara (MD) 4
15 Muzium Negara (MN) 4
16 Pasar Seni (PS) 6
17 Phileo Damansara (PD) 4
18 Pusat Bandar Damansara
(PBD) 2
19 Semantan (SE) 6
20 Sri Raya (SR) 4
21 Stadium Kajang (SK) 3
22 Sungai Buloh (SB) 4
23 Sungai Jernih (SJ) 4
24 Surian (SU) 3
25 Taman Connaught (TC) 4
26 Taman Midah (TMi) 3
27 Taman Mutiara (TMu) 4
28 Taman Pertama (TP) 3
29 Taman Suntex (TS) 2
30 Taman Tun Dr Ismail
(TTDI) 3
31 Tun Razak Exchange
(TRX) 2
Total 106
Table 1. Distribution of respondents at 31 MRT stations in Kuala Lumpur
Users’ characteristics
Table 2 illustrates the demographic characteristics of the survey
respondents at the 31 stations. Among 106 respondents, more than half
(54 percent) were male, and 63 percent of the respondents had a
university degree. The majority of respondents (57.4 percent) worked in
Malaysia Sustainable Cities Program, Working Paper Series 14
© Vo Van Dut & Massachusetts Institute of Technology 2017ACCESSIBILITY AND CONNECTIVITY CHALLENGES OF Vo Van Dut MASS RAPID TRANSIT IN KUALA LUMPUR, MALAYSIA companies (48.0 percent), government positions (4.7 percent), or self- owned business (4.7 percent). More than 40 percent of respondents were not working, including students and unemployed or temporary workers. The average income of respondents ranged from 3,000−5,000 MYR per month (USD $755−1,260). Pearson’s Chi-square test at 95 percent confidence level reveals that there is no difference between the user’s characteristics at the various stations along the SBK MRT Line. These results imply that the characteristics of respondents do not matter when considering the effect of accessibility and connectivity on the MRT user’s ride. Table 1 also shows that 56 percent of 106 respondents in the sample own private vehicles. The majority of respondents (80 percent) make trips very often (>10 trips per week: 26 percent), often (6-9 trips per week: 30 percent), moderate (4-5 trips per week: 24 percent). The results mean that the traveling need of respondents living around MRT station are high. Malaysia Sustainable Cities Program, Working Paper Series 15 © Vo Van Dut & Massachusetts Institute of Technology 2017
ACCESSIBILITY AND CONNECTIVITY CHALLENGES OF                                                                              Vo Van Dut
                MASS RAPID TRANSIT IN KUALA LUMPUR, MALAYSIA

                                                                                                                  MRT station                                                                                Total   (%)     Pearson chi- Sig.
                                                                                                                                                                                                                             square
Respondents’ characteristics    BU   BSC   BB   BD   CO   HO   KJ   KS   KD   KwD   KwS   MA   ME   MD   MN   PS       PD       PBD   SE    SR   SK   SB   SJ   SU   TC   TMi   TMu   TP   TS   TTDI   TRX
1. Gender
Female                          3    2     1    2    1    1    2    1    1    3     2     0    1    1    2    2        2        1     4     3    1    2    2    2    1    1     3     0    0    1      1     49      0.46    22.65        0.829
Male                            3    0     4    0    2    2    1    1    2    1     1     3    1    3    2    4        2        1     2     1    2    2    2    1    3    2     1     3    2    2      1     57      0.54
Total                           6    2     5    2    3    3    3    2    3    4     3     3    2    4    4    6        4        2     6     4    3    4    4    3    4    3     4     3    2    3      2     106     100
2. Education
Non university                  1    1     1    0    1    0    2    0    0    2     1     0    0    1    4    3        1        0     3     1    1    3    3    1    0    1     2     1    2    2      1     39      0.37    34.11        0.276
University                      5    1     4    2    2    3    1    2    3    2     2     3    2    3    0    3        3        2     3     3    2    1    1    2    4    2     2     2    0    1      1     67      0.63
Total                           6    2     5    2    3    3    3    2    3    4     3     3    2    4    4    6        4        2     6     4    3    4    4    3    4    3     4     3    2    3      2     106     100
3. Income
 MYR 10,000/month              0    0     1    0    0    0    0    1    0    0     0     0    1    1    0    0        0        0     0     0    0    0    0    0    0    0     0     0    0    0      0     4       0.04
Total                           6    2     5    2    3    3    3    2    3    4     3     3    2    4    4    6        4        2     6     4    3    4    4    3    4    3     4     3    2    3      2     106     100
4. Occupation
Company staff                   4    1     5    0    2    1    0    1    0    1     0     3    1    3    0    1        2        2     2     2    2    1    0    0    3    3     3     3    0    3      2     51      0.48    138.74       0.116
Government officer              0    0     0    0    0    0    1    0    0    0     1     0    0    0    1    0        0        0     0     1    0    0    0    1    0    0     0     0    0    0      0     5       0.047
Self-business                   0    1     0    0    0    1    0    0    0    1     0     0    1    0    0    0        0        0     1     0    0    0    0    0    0    0     0     0    0    0      0     5       0.047
Student                         2    0     0    2    1    1    2    1    3    2     2     0    0    1    3    5        2        0     3     1    1    3    3    2    1    0     0     0    2    0      0     43      0.408
Other                           0    0     0    0    0    0    0    0    0    0     0     0    0    0    0    0        0        0     0     0    0    0    1    0    0    0     1     0    0    0      0     2       0.018
Total                           6    2     5    2    3    3    3    2    3    4     3     3    2    4    4    6        4        2     6     4    3    4    4    3    4    3     4     3    2    3      2     106     100
5. Vehicle in household (car,
motorbike)
No vehicle                      2    1     1    1    1    0    1    1    2    1     2     1    0    0    2    2        3        1     4     1    3    1    3    2    1    1     2     2    2    2      1     47      0.44    25.77        0.687
Vehicles                        4    1     4    1    2    3    2    1    1    3     1     2    2    4    2    4        1        1     2     3    0    3    1    1    3    2     2     1    0    1      1     59      0.56
Total                           6    2     5    2    3    3    3    2    3    4     3     3    2    4    4    6        4        2     6     4    3    4    4    3    4    3     4     3    2    3      2     106     100
6. Trip per week
Very often (>10 trips)          4    1     1    1    0    1    1    0    2    1     1     0    0    0    0    0        1        1     5     0    0    0    1    2    0    0     1     0    0    3      1     28      0.26    135.69       0.135
Often (6-9 trips)               1    0     3    0    1    1    1    0    0    1     2     3    1    1    2    0        2        1     1     1    1    1    0    0    1    2     0     2    2    0      1     31      0.30
Moderate (4-5 trips)            0    1     0    1    2    1    1    1    1    1     0     0    0    1    1    2        1        0     0     0    1    0    2    1    3    1     2     1    0    0      0     25      0.24
Less often (2-3 trips)          1    0     0    0    0    0    0    1    0    1     0     0    0    0    0    2        0        0     0     1    0    2    0    0    0    0     0     0    0    0      0     8       0.07
Very less often (
ACCESSIBILITY AND CONNECTIVITY CHALLENGES OF Vo Van Dut
MASS RAPID TRANSIT IN KUALA LUMPUR, MALAYSIA
Additionally, the respondents were asked to indicate their place of
residence, their nearest MRT station, and the total number of members in
their household. The average distance between respondents’ residential
location/origin and their nearest MRT station was 5.9 km. Measurement of
distance from place of residence to an MRT station was classified into
three categories:
• Location type I—within one kilometer radius from the nearest
MRT station (12.3 percent),
• Location type II—between two and 9 kilometers radius from
the MRT station (71.7 percent),
• Location type III—more than 9 kilometers from the nearest
MRT station (16.0 percent).
The descriptive analysis of the users’ characteristics yielded two
conclusions. First, most respondents live far from their nearest MRT
station. This implies that to encourage MRT users, maximizing the
accessibility and connectivity at the nearest MRT stations should be
considered to encourage the respondents living around stations. Second,
there is no difference between the characteristics of respondent groups
that do not make a bias of the analysis results when studying the effect of
accessibility and connectivity on MRT user’s ride. Before understanding
how accessibility and connectivity at each MRT station affect MRT users’
ride, therefore, we examine the current state of accessibility and
connectivity at MRT stations.
Current accessibility of the SBK MRT Line
Table 3 presents the results of statistical analysis of elements of
accessibility at the 31 MRT stations in Kuala Lumpur. Elements of
accessibility are divided into three groups: facilities for pedestrian and
bicycle access, facilities for disabled users, and incentives.
With respect to facilities for pedestrian and bicycle access, the
results in Table 3 indicate that escalators, lifts, stacked platforms, public
toilets, public telephones, pray room, ticket machines, and a customer
service office are fully provided for non-disabled people at the stations.
However, although there are some small retailers in the MRT stations (23
out of 31 stations), there are no shopping centers or large stores in these
stations to encourage ridership. Furthermore, park-and-ride facilities and
bicycle parking were available only at 10 and 5 stations, respectively.
Rates for these services range from 1.10 to 16.10 MYR per day,
depending on how long vehicles or bicycles are parked and whether
drivers are MRT users or not.
The statistical results of the survey also show that the majority of
respondents (52.69 percent) use a car to reach an MRT station from their
home (Figure 3). Taken together, the results imply that given the tendency
Malaysia Sustainable Cities Program, Working Paper Series 17
© Vo Van Dut & Massachusetts Institute of Technology 2017ACCESSIBILITY AND CONNECTIVITY CHALLENGES OF Vo Van Dut
MASS RAPID TRANSIT IN KUALA LUMPUR, MALAYSIA
to use private vehicles to reach MRT stations, existing park-and-ride
facilities and bicycle parking are inadequate. The park-and-ride charge for
MRT users, moreover, is MYR 4.3—a relatively high parking fee, most
likely discouraging ridership. The statistical results in Table 3 show that all
MRT stations fully provide facilities and services for disabled users (for
example, ramp access, low lift button for wheelchair users, disabled-
friendly toilets, low counters for wheel chair users, and staff at stations for
assistance). These resources presumably encourage disabled people to
use MRT instead of private vehicles.
Another issue affecting accessibility is the lack of integration of fare
cards across various transport modes. Table 3 reveals that although the
MyRapid card is integrated with the LRT, BRT, RapidKL bus, and monorail
networks, it is not integrated with other public transport modes owned and
operated by various other companies (such as KLAI, KTM, MRT, etc.). By
contrast, the Touch’n Go card—a prepaid smartcard that uses Mifare
contactless technology—is also integrated with KTM lines, LRT lines, BRT
lines, monorails, and major bus companies, and can be used to pay tolls
on highways, and even as a debit card in some stores, shopping malls,l
and car parks—none of which are available through MyRapid. But users
can only buy Touch’n Go cards at a limited number of hubs; whereas
MyRapid cards are available at all LRT stations and bus hubs, making
them more convenient for users. These discrepancies confuse riders, and
presumably affect their MRT use.
With regard to fare discounts on MRT, the fare ranges from 1.1
MYR to a maximum fare of 6.4 MYR per ride, based on the cash fare
structure. Users can enjoy savings by using the Touch’n Go card’s
cashless-payment mode. The fare in that case ranges between 1.1 and
5.5 MYR per ride. Table 3 indicates that people with disabilities, students,
and senior citizens are offered an additional 50 percent discount from the
cash rate. Children under 7 years old travel for free.
Malaysia Sustainable Cities Program, Working Paper Series 18
© Vo Van Dut & Massachusetts Institute of Technology 2017ACCESSIBILITY AND CONNECTIVITY CHALLENGES OF Vo Van Dut
MASS RAPID TRANSIT IN KUALA LUMPUR, MALAYSIA
Elements relating to “AV” means Available at this station
accessibility MRT Station Code
BU BSC BB BD CO HO KJ KS KD KwD KwS MA ME MD MN PS PD PBD SE SR SK SB SJ SU TC TMi TMu TP TS TTDI TRX
Facilities for Escalator AV AV AV AV AV AV AV AV AV AV AV AV AV AV AV AV AV AV AV AV AV AV AV AV AV AV AV AV AV AV AV
pedestrian Lift AV AV AV AV AV AV AV AV AV AV AV AV AV AV AV AV AV AV AV AV AV AV AV AV AV AV AV AV AV AV AV
and bicycle access
Signage and information AV AV AV AV AV AV AV AV AV AV AV AV AV AV AV AV AV AV AV AV AV AV AV AV AV AV AV AV AV AV AV
Side/side stacked AV AV AV AV AV AV AV AV AV AV AV AV AV AV AV AV AV AV AV AV AV AV AV AV AV AV AV AV AV AV AV
platform
Public toilets AV AV AV AV AV AV AV AV AV AV AV AV AV AV AV AV AV AV AV AV AV AV AV AV AV AV AV AV AV AV AV
Public telephone AV AV AV AV AV AV AV AV AV AV AV AV AV AV AV AV AV AV AV AV AV AV AV AV AV AV AV AV AV AV AV
Pray room AV AV AV AV AV AV AV AV AV AV AV AV AV AV AV AV AV AV AV AV AV AV AV AV AV AV AV AV AV AV AV
Park and ride AV n/a n/a AV n/a AV AV n/a n/a n/a AV AV n/a n/a n/a n/a AV AV n/a n/a n/a AV AV n/a n/a AV n/a n/a AV n/a n/a
Bicycle parking n/a n/a n/a n/a n/a n/a n/a n/a n/a AV AV n/a n/a n/a n/a AV AV AV n/a n/a n/a AV n/a n/a n/a n/a n/a n/a n/a n/a n/a
Retail store 1 2 3 2 n/a 2 n/a 2 2 n/a 2 n/a n/a 1 1 n/a n/a 2 2 2 1 2 1 1 1 2 1 2 1 1 n/a
Ticket machine AV AV AV AV AV AV AV AV AV AV AV AV AV AV AV AV AV AV AV AV AV AV AV AV AV AV AV AV AV AV AV
Customer service office AV AV AV AV AV AV AV AV AV AV AV AV AV AV AV AV AV AV AV AV AV AV AV AV AV AV AV AV AV AV AV
Card integration Touch’n Go card (Cashless) is integrated with KTM lines, LRT lines, BRT lines, monorails, major buses company, and others more ; MyRapid card is integrated only with LRT, BRT, RapidKL bus, and monorail networks, not with KLIA, KTM, MRT, etc.
Facilities for Ramp access AV AV AV AV AV AV AV AV AV AV AV AV AV AV AV AV AV AV AV AV AV AV AV AV AV AV AV AV AV AV AV
disabled users
Tactile tiles AV AV AV AV AV AV AV AV AV AV AV AV AV AV AV AV AV AV AV AV AV AV AV AV AV AV AV AV AV AV AV
Disabled-friendly toilets AV AV AV AV AV AV AV AV AV AV AV AV AV AV AV AV AV AV AV AV AV AV AV AV AV AV AV AV AV AV AV
Low lift button for wheel AV AV AV AV AV AV AV AV AV AV AV AV AV AV AV AV AV AV AV AV AV AV AV AV AV AV AV AV AV AV AV
chair users
Braille for the lift buttons AV AV AV AV AV AV AV AV AV AV AV AV AV AV AV AV AV AV AV AV AV AV AV AV AV AV AV AV AV AV AV
Staff at station to provide AV AV AV AV AV AV AV AV AV AV AV AV AV AV AV AV AV AV AV AV AV AV AV AV AV AV AV AV AV AV AV
assistance
Low counters for wheel AV AV AV AV AV AV AV AV AV AV AV AV AV AV AV AV AV AV AV AV AV AV AV AV AV AV AV AV AV AV AV
chair users
Incentives Fare discount 50 percent discount for people with disabilities (OKU), students, and senior citizens (MyKad), children under 7 years old travel for free
Feeder bus discount 50 percent discount for people with disabilities (OKU), students, and senior citizens (MyKad), children under 7 years old travel for free
Table 3. Characteristics of current accessibility at 31 MRT stations in Kuala Lumpur
Malaysia Sustainable Cities Program, Working Paper Series 19
© Vo Van Dut & Massachusetts Institute of Technology 2017ACCESSIBILITY AND CONNECTIVITY CHALLENGES OF Vo Van Dut
MASS RAPID TRANSIT IN KUALA LUMPUR, MALAYSIA
Current connectivity of the SBK MRT Line
Table 4 displays the characteristics of connectivity at 31 MRT
stations in Kuala Lumpur. Connectivity comprises three elements:
availability of feeder buses that bring passengers to and from the station,
interchanges with other transport modes, and frequency of train
departures. The majority of stations (26 out of 31) provide feeder buses. A
total of 300 feeder buses have been deployed to cover 49 routes at 26
MRT stations. The frequency of feeder bus stops ranges from 10 to 15
minutes. A nominal fare of 1.0 MYR per trip is set for the MRT feeder bus
services, and can be paid with cash or Touch ‘n Go cards. As with the
MRT fares, senior citizens, students, and disabled people are offered a 50
percent discount, and children under 7 years old travel for free.
Others
Other rail
ways
Taxi/uber/g
rab
Feederbus/
bus
Car
Walking
0 10 20 30 40 50 60
Figure 4. Mode choice shares for travel from home to nearest MRT
station 3
The statistical analysis in Figure 4, however, shows that only 11.83
percent of respondents use feeder bus service to reach the MRT station.
This rate is relatively low, given government efforts to encourage people to
use public transport. This suggests that more feeder buses in many
different residential areas ought to be provided to accommodate more
MRT riders.
Connectivity Number of MRT
stations
Malaysia Sustainable Cities Program, Working Paper Series 20
© Vo Van Dut & Massachusetts Institute of Technology 2017ACCESSIBILITY AND CONNECTIVITY CHALLENGES OF Vo Van Dut
MASS RAPID TRANSIT IN KUALA LUMPUR, MALAYSIA
connected with
Feeder buses 27
KL Monorail Line 02
KTM Seremban Line 02
KTM Port Klang Line 02
LRT Ampang Line 02
LRT Sri Petaling Line 01
LRT Kelana Jaya Line 02
KLIA Ekspres Line 01
KLIA Transit Line 01
KL Rapid Bus 01
Table 4. Current connectivity at 31 MRT stations in Kuala Lumpur 4
Another important element of connectivity is the opportunity for
interchange at each MRT station. Table 4 shows that only 7 out of 31
stations have been connected with other public transport modes in the
city. Only one of these seven (Muzium Negara station) is connected to
most of the other rail networks in Kuala Lumpur, while two (Merdeka and
Pasar Seni stations) have two rail connections each. The other four
stations only connect with one other public transport mode. In other words,
connectivity is poor for the SBK MRT Line in Kuala Lumpur—a central
obstacle to encouraging people to use MRT.
Furthermore, as shown in Table 4, the average frequency of MRT
trains is 6.2 minutes from Monday to Thursday, 5.9 minutes on Fridays,
7.7 minutes on Saturdays, and 7.6 minutes on Sundays and public
holidays. This implies that users’ waiting time is quite short—and in fact,
survey respondents confirmed that the frequency of trains meets their
expectations. When asked “How satisfied are you with the current
frequency of MRT train?” almost 90 percent answered that they were
satisfied with the frequency of the MRT. The remaining respondents
suggested that the MRT should run twenty-four hours per day, instead of
suspending operations at midnight.
The effects of accessibility and connectivity on users’
MRT experience
As Tables 3 and 4 illustrate, the majority of facilities that affect
accessibility (such as escalator, lift, signage and information, public toilets,
public telephone, ramp access, etc.) are available at all 31 MRT stations.
Yet several elements that would further improve accessibility are still
lacking at several stations. Figure 5 summarizes the accessibility and
connectivity elements at MRT station. Accessibility features like park-and-
ride and bicycle parking are not provided at 19 and 26 MRT stations,
Malaysia Sustainable Cities Program, Working Paper Series 21
© Vo Van Dut & Massachusetts Institute of Technology 2017ACCESSIBILITY AND CONNECTIVITY Vo Van Dut
CHALLENGES OF MASS RAPID TRANSIT
IN KUALA LUMPUR, MALAYSIA
respectively. As referenced in Figure 4, more than half of users (52.69
percent) prefer to reach their local MRT stations by car, so the lack of
park-and-ride at most MRT station makes it inconvenient for users to
access MRT.
Figure 5 also reveals that although smaller retail stores are located
at 23 out of 31 MRT stations, there are no major shopping centers co-
located at MRT stations. The latter can attract greater ridership because
users can save time and money by combining their MRT ride and
shopping in the same trip. When survey respondents were asked “If one
thing could be changed, what would you suggest so that you will ride MRT
more?,” 37 percent suggested that shopping centers or retails stores
should be co-located at all MRT stations. Responses indicate that food
and beverage retailers would fill a need (“Sometimes we are very thirsty
and need to purchase a beverage, they but there are no retail stores or
shops in MRT stations”), and that riders recognize the potential time
savings of shopping by MRT stations (“We go shopping on the way back
home after working; [doing so by the MRT] saves our time”).
35 31
30 26 27
23 24
25
19
20
15 12
10 8 7
5 4
5
0
0
Park and ride Bycycle Retail store Feederbus Interchange Linking pass
parking
Accessibility Connectivity
Availability Non-Availability
Figure 5. Availability of accessibility and connectivity elements at
SBK MRT stations
Figure 5 indicates that connectivity of the SBK MRT Line in Kuala
Lumpur faces some challenges in terms of feeder bus services,
interchange options and linked fare pass. Although feeder buses are
provided at 27 out of 31 stations, 71 percent of respondents agreed that
more feeder buses should be provided in additional densely-populated
areas, should run more frequently, and should arrive/depart on schedule.
Another major challenge of connectivity at MRT stations is the option for
Malaysia Sustainable Cities Program, Working Paper Series 22
© Vo Van Dut & Massachusetts Institute of Technology 2017ACCESSIBILITY AND CONNECTIVITY Vo Van Dut
CHALLENGES OF MASS RAPID TRANSIT
IN KUALA LUMPUR, MALAYSIA
interchange with other transport lines. As only 7 MRT stations are
connected with other public transport modes, interchange at MRT stations
is poor, and likely prevents greater MRT use. This limitation should be a
significant concern for the Kuala Lumpur transportation authorities.
A third crucial element that determines the degree of MRT’s
connectivity is availability of a linked pass. Figure 5 reveals that there are
no linked passes provided at MRT stations so far. As noted above, pass
cards (such as Touch’n Go and Mypaid cards) available at MRT stations
are only integrated with services owned by the same company, which
includes LRT, feeder buses and monorail but not the not KTM train or
KLIA networks that offer service to Kuala Lumpur’s international airports.
This is a missed opportunity to provide a convenient service for travelers
and tourists. In addition, 70 percent of interviewees expressed that “MRT,
LRT and other transport modes need to be connected into one system
because we do not need more transportation and do not want to pay
more.”. This implies that public transport users’ need for a linked pass is
very high, and should be carefully considered to improve MRT connectivity
In order to understand the effects of the current accessibility and
connectivity at MRT stations on residents’ decision to use the MRT,
respondents were asked: “Given the current facilities (accessibility and
connectivity) provided at the nearest MRT station, how many times in a
typical week do you ride MRT in Kuala Lumpur?” Table 5 displays these
responses, showing that the average number of rides in a typical week
was appropriately 3 times. This seems that the average number of trips
per user at each MRT station is relative low in a typical week. But if MRT
were convenient to take to and from work, it seems likely that users would
take it 10 times per week (2 times per day X 5 days per week).
MRT stations Connectivity Accessibility Average
number
of trips
per user
per week
Feeder Interchange with Linking Park and Bicycle No. of
bus pass ride parking retail
stores
X KTM Seremban line X X X 1 6.3
KTM Port Klang line
LRT Kelana Jaya Line
KLIA Ekspres Line
KLIA Transit Line
Muzium Negara (MN) KL Monorail Line
X LRT Kelana Jaya Line X X √ X 5.2
Pasar Seni (PS) KL Rapid Bus
Semantan (SE) √ X X X X 2 4.5
Maluri (MA) √ LRT Ampang Line X √ X X 4.3
Bukit Bintang (BB) X KL Monorail Line X X X 3 4.2
Bandar Utama (BU) √ X X √ X 1 4.0
Malaysia Sustainable Cities Program, Working Paper Series 23
© Vo Van Dut & Massachusetts Institute of Technology 2017ACCESSIBILITY AND CONNECTIVITY Vo Van Dut
CHALLENGES OF MASS RAPID TRANSIT
IN KUALA LUMPUR, MALAYSIA
X LRT Ampang Line X X X X 4.0
Merdeka (ME) LRT Sri Petaling Line
Taman Pertama (TP) √ X X X X 2 3.7
Sungai Buloh (SB) √ X X √ √ 2 3.5
Taman Suntex (TS) √ X X √ X 1 3.5
Hussien Onn (HO) √ X X √ X 2 3.3
Stadium Kajang (SK) √ X X X X 1 3.3
Taman Connaught (TC) √ X X X X 1 3.3
Batu Sebelas Cheras (BSC) √ X X X X 2 3.0
Cochrane (CO) √ X X X X X 3.0
Phileo Damansara (PD) √ X X √ √ X 2.8
Taman Mutiara (TMu) √ X X X X 1 2.8
Kajang (KJ) √ KTM Seremban line X √ X X 2.7
Kwasa Sentral (KwS) √ X X √ √ 2 2.7
Surian (SU) √ X X X X 1 2.7
Taman Midah (TMi) √ X X √ X 2 2.7
Bukit Dukung (BD) √ X X √ X 2 2.5
Kwasa Damansara (KwD) √ X X √ √ X 2.5
Pusat Bandar Damansara (PBD) √ X X √ √ 2 2.5
Tun Razak Exchange (TRX) X X X X X X 2.5
Kota Damansara (KD) √ X X √ X 2 2.3
Taman Tun Dr Ismail (TTDI) √ X X X X 1 2.3
Sri Raya (SR) √ X X X X 2 1.8
Sungai Jernih (SJ) √ X X √ X 1 1.8
Mutiara Damansara (MD) √ X X X X 1 1.5
Kampung Selamat (KS) √ X X X X 2 0.5
Average number of trips per user per week at the nearest MRT station (SBK MRT Line) 3.1
Table 5. The effects of accessibility and connectivity on the
average number of trips per user per week 5
The survey also explored the effects of connectivity and
accessibility on how often each station is frequented by users. Figure 6
shows the average number of trips made by survey respondents from
each MRT station. Among 31 MRT stations, Kampung Selemat has the
lowest average rides (0.5), while the highest average number of rides is
Muzium Negara with appropriately 6.0 trips.
As seen in Figure 6, the effects of accessibility and connectivity on
users’ choice to ride the MRT can be categorized into three groups. The
first group is that the average number of trips per user ranges from 4 to
more than 6 times per week including Muzium Negara, Semantan, Bukit
Bintang, and Merdeke stations. These stations have a relatively high
average number of trips per user because they are connected with other
public transport modes, despite lacking some elements relating to
accessibility (Table 5). Although Semantan Station does not yet have
connections to any other public transport modes, the average number of
trips per user through that station is quite high because the headquarters
of MRT Corporation is located there, and MRT Corporation staff ride for
free with their staff card. Moreover, several office and residential buildings
are located very close to this station.
Malaysia Sustainable Cities Program, Working Paper Series 24
© Vo Van Dut & Massachusetts Institute of Technology 2017ACCESSIBILITY AND CONNECTIVITY Vo Van Dut
CHALLENGES OF MASS RAPID TRANSIT
IN KUALA LUMPUR, MALAYSIA
MUZIUM NEGARA 6.3
PASAR SENI 5.2
SEMANTAN 4.5
MALURI 4.3
BUKIT BINTANG 4.2
BANDAR UTAMA 4.0
MERDEKA 4.0
TAMAN PERTAMA 3.7
SUNGAI BULOH 3.5
TAMAN SUNTEX 3.5
HUSSIEN ONN 3.3
STADIUM KAJANG 3.3
TAMAN CONNAUGHT 3.3
BATU SEBELAS CHERAS 3.0
COCHRANE 3.0
PHILEO DAMANSARA 2.8
TAMAN MUTIARA 2.8
KAJANG 2.7
KWASA SENTRAL 2.7
SURIAN 2.7
TAMAN MIDAH 2.7
BUKIT DUKUNG 2.5
KWASA DAMANSARA 2.5
PUSAT BANDAR DAMANSAR 2.5
TUN RAZAK EXCHANGE 2.5
KOTA DAMANSARA 2.3
TAMAN TUN DR ISMAIL 2.3
SRI RAYA 1.8
SUNGAI JERNIH 1.8
MUTIARA DAMANSARA 1.5
KAMPUNG SELAMAT 0.5
0.0 1.0 2.0 3.0 4.0 5.0 6.0 7.0
Figure 6. Average number of MRT station uses in a typical week
The second group of stations has an average number of trips per
user from more than two to less than four times per week (Figure 6). A
possible explanation for the results of the second group is that all the
stations of the second group provide feeder buses, which encourage
users. The average number of trips per user at these stations, however,
could be higher if linked passes and facilities like retail and park-and-ride
were available.
The average number of trips per user of the third group of stations
(Sri Raya, Sungai Jernih, Mutiara Damansara, and Kampung Selamat)
varies from less than one to below two trips per week. The low average
number of trips per week can be attributed to—apart from the lack of
interchange and lack of some accessibility elements—the distance from
these MRT stations to more remote residential areas that are not served
by feeder buses.
To further explore the effects of accessibility and connectivity on
MRT use, five in-depth interviews were conducted with the representatives
Malaysia Sustainable Cities Program, Working Paper Series 25
© Vo Van Dut & Massachusetts Institute of Technology 2017You can also read