Fiscal Period Ended August 31, 2021 - Asset Management Company October 15, 2021 Securities Code 3481
←
→
Page content transcription
If your browser does not render page correctly, please read the page content below
Fiscal Period Ended August 31, 2021

Asset Management Company
                                      Securities Code:3481
October 15, 2021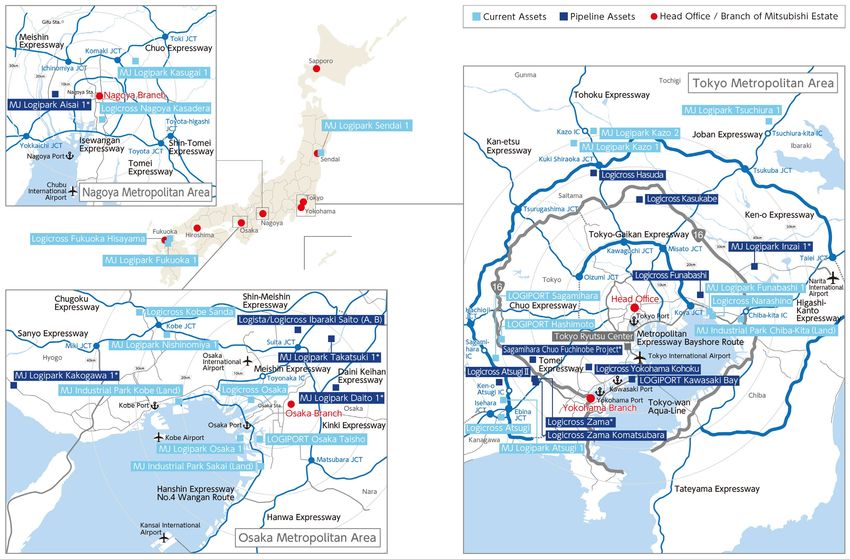
Table of Contents

        1. Financial Results and Forecasts                 4

        2. Growth Strategy                                 7

        3. ESG Initiatives                                14

        4. Mid-to Long-Term Growth Strategy               20
                  Features of Mitsubishi Estate Group’s
        5.                                                22
                  Logistic Facilities Business
        6. Logistics Market Overview                      27

        7. Appendix                                       30

Logicross Osaka
Highlights for the 10th Fiscal Period (Ended August 31, 2021)

        Hybrid External Growth
        ●Successfully completed follow-on offering for 2 consecutive periods and acquired 5 properties at the beginning of
         the period (3 sponsor-developed properties and 2 asset management company-sourced properties), and expanded
         the asset size to 170.4 bn yen with 22 properties
                                                                                                                                                          (Note 1)
        ●Record high DPU of 6,764 yen (vs 9th Fiscal Period: +145 yen, vs Forecast                                                                                   : +79 yen)

        Hybrid Internal Growth
        ●Achieved steady rent growth for 7 consecutive periods and maintained the upward trend despite COVID-19
               Average rent growth
                                                 (Note 2)
                                                              10th period            +13.9%                        11th period            +4.5%
        ●Built track record in property management consignment and accumulated knowledge through utilization of
         technology at Mitsubishi Estate Group

              Financial Strategy

        ●Achieved diversification of financing method and extension of debt duration through MEL’s first issuance of
         Green Bond

        ●Maintained stable financial operation and low level of LTV at 32.3%

                             ESG

        ●Awarded the prestigious 5 Stars for 2nd consecutive year in GRESB Real Estate Assessment in 2021
        ●Launched the discussion in preparation for supporting the recommendation by the Task Force on Climate-related
         Financial Disclosures (TCFD) and the process of setting KPIs at MJIA

Note 1: Forecast announced on Apr. 15, 2021
Note 2: Average rent growth for the leases that expired or will expire during the relevant period, and lease contracts that are not yet contracted are assumed to be unchanged for the calculation

                                                                                                                                                                                                     2
Management Policy based on “Three Pillars” (Amended in Oct. 2021)
Maximization of Unitholders’ Value in Mid-to Long-term
Alignment Discipline Hybrid
Enhance MEL’s unique strategy
Align interest with unitholders Achieve disciplined growth
Measures continued from the past and
Hybrid Model
New Launch of discussion on the Hybrid external growth
to be taken in the future
TCFD recommendations External growth utilizing LTV (Supply of properties from both
ESG and KPI setting Sponsor and MJIA)
New Hybrid internal growth
Promotion of efforts for Property acquisition with attention to
(Utilizing management capability of
ESG
Low-Carbon portfolio yield and implied cap rate
MJIA and leasing capacity of Sponsor)
Further inclusion in major indices
Flexible property acquisition strategy utilizing bridge funds
and improvement in liquidity
New
ESG Expanding pipelines through utilizing
More in-depth ESG commitment and
MJIA’s various sourcing methods,
ESG diversification of financing methods through green financing
such as CRE proposals and PDP
ESG Support from Sponsor and New Track record in PM consignment
Flexible financing carefully watching
and built-up knowledge through
continued same-boat investment the market conditions
utilization of technology at Sponsor Group
ESG Acquisition of 5 Stars rating for the second consecutive year (Oct. 2021)
executed and
Measures
ESG Introduction of cumulative investment for employees of Sponsor and MJIA (Mar. 2021)
achieved
Continued growth through execution of public offerings based on “Three Pillars” (Feb. 2021, Aug. 2020 and Sept. 2019)
Inclusion in the FTSE EPRA Nareit Global Real Estate Index Series (Jun. 2020)
ESG Introduction of the asset management fee structure fully linked to unit price performance, first among J-REITs (May 2019)
3
Financial Results and Forecasts
Financial Results for the Fiscal Period Ended Aug. 2021
Main Factors of Variance
FP Ended Aug.
9th FP Actual vs. 10th FP Actual
FP Ended Feb. FP Ended Aug. (Contribution to Net Income)
Difference 2021 Forecast
Operating Results (mn yen) 2021 Actual 2021 Actual
(B)-(A) (As of Apr. 15, 1
(9th FP)(A) (10th FP)(B) ・Increase in revenue from properties
2021)(10th FP) +725mn yen
acquired in 10th FP
Operating Revenues 4,203 4,953 1 +749 4,941
・Rent increase and others from existing
+23mn yen
Operating Rental Revenues 4,203 4,953 +749 4,941 properties
Increase in rent +8mn yen
Operating Rental Expenses
(excluding depreciation)
723 920 +196 940 Increase in utility cost +8mn yen
Increase in solar power income(seasonal variation) +7mn yen
NOI 3,479 4,032 +553 4,001
2
Depreciation 773 881 +107 880 ・Increase in expenses from
-214mn yen
properties acquired in 10th FP
Operating Income 2,204 2,555 2 +351 2,521 Increase in depreciation -103mn yen
Increase in G&A expenses -77mn yen
Ordinary Income 2,074 2,382 +308 2,336
Increase in facility management fee, etc. -33mn yen
Net Income 2,073 2,381 3 +308 2,335 ・Increase in expenses from
-184mn yen
existing properties
Distributions Per Unit (yen) Property tax for properties acquired in 9th FP -94mn yen
Increase in repair and maintenance expense ‐60mn yen
Distributions Per Unit
(including SCD)
6,619 6,764 +145 6,685 Increase in G&A expenses -16mn yen
Increase in utility cost -8mn yen
Distributions Per Unit
(excluding SCD)
5,953 6,089 +136 5,969
3
Surplus Cash Distributions (SCD)
Per Unit
666 675 +9 716 ・Increase in non-operating expenses -45mn yen
Number of investment units issued Increase in interest expenses from debt in 10th FP -30mn yen
and outstanding (units)
348,237 391,135 +42,898 391,135
Investment corporation bond issuance expenses -16mn yen
Other Statistics Logicross Narashino Logicross Osaka (Note) Logicross Nagoya
Kasadera (Note)
AFFO (mn yen) 2,733 3,098 +365 2,974
AFFO payout ratio 84.3% 85.4% +1.1% 87.9%
LTV 31.4% 32.7% +1.3% 32.7% MJ Industrial Park Kobe (Land) MJ Industrial Park Properties Acquired
Chiba-Kita(Land)
NAV per unit (yen) 323,737 343,818 +20,081 - in 10th FP
Total Acquisition
Average Occupancy 99.7% 99.8% +0.1% 99.7%
Price 28.2 bn yen
Note:40% additional co-beneficiary interest
5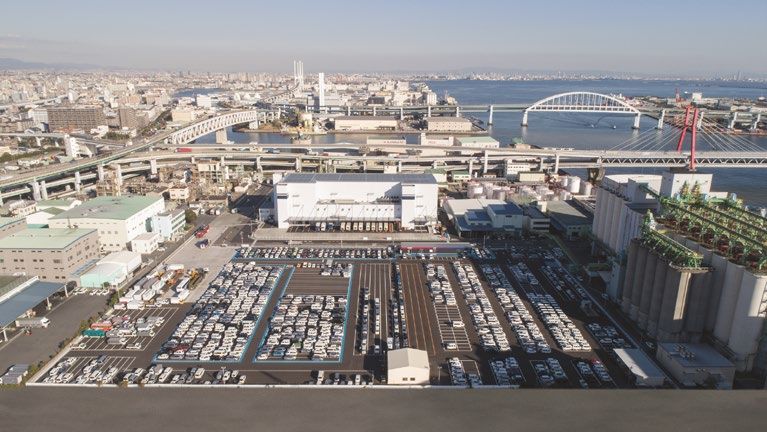
Forecasts for the Fiscal Periods Ending Feb. 2022 and Aug. 2022
                                                                                                                   Main Factors of Variance
                                      FP Ended Aug.   FP Ending Feb.
                                                                                          (Reference)         10th FP Actual vs. 11th FP Forecast
                                                                            Difference   FP Ending Aug.
Operating Results (mn yen)             2021 Actual    2022 Forecast                                       1                  (Contribution to Net Income)
                                                                           (B)-(A)       2022 Forecast
                                       (10th FP)(A)    (11th FP)(B)
                                                                                            (12th FP)     ・Full contribution from properties
                                                                                                                                                                     +38mn yen
                                                                                                           acquired in 10th FP
Operating Revenues                           4,953            5,028    1          +74           5,059
                                                                                                          ・Rent increase and others from existing
      Operating Rental Revenues              4,953            5,028               +74           5,059                                                                +36mn yen
                                                                                                           properties
       Operating Rental Expenses                                                                          2
      (excluding depreciation)
                                               920              864                ー55            964
                                                                                                          ・Decrease in expenses from
                                                                                                                                                                     +2mn yen
   NOI                                       4,032            4,163              +130           4,094      properties acquired in 10th FP
                                                                                                          ・Increase in expenses from
      Depreciation                             881              896               +15             912                                                                -4mn yen
                                                                                                           existing properties
                                                                                                              Decrease in repair and maintenance expenses, etc.        +61mn yen
Operating Income                             2,555            2,628    2          +72    1      2,551         Increase in G&A expenses                                  -50mn yen
                                                                                                              Increase in depreciation                                  -14mn yen
      Ordinary Income                        2,382            2,509              +126           2,430
Net Income                                   2,381            2,508    3         +126    2      2,429     3
                                                                                                          ・Decrease in non-operating expenses                        +54mn yen
Distributions Per Unit (yen)                                                                                   No temporary expense from offering in Feb. 2021 and
                                                                                                                                                                        +51mn yen
                                                                                                              issuance of investment corporation bonds
Distributions Per Unit
(including SCD)
                                             6,764           7,099              +335           6,910           Completion of amortization of organization expenses       +4mn yen

   Distributions Per Unit
   (excluding SCD)
                                             6,089           6,412              +323           6,210
                                                                                                                Main Factors of Variance
   Surplus Cash Distributions (SCD)
   Per Unit
                                               675             687                +12            700      11th FP Forecast vs. 12th FP Forecast
                                                                                                                           (Contribution to Net Income)
Number of investment units issued
                                          391,135         391,135                  ±0        391,135
                                                                                                          1
and outstanding (units)
                                                                                                          ・Rent increase and reduction of vacancy,
Other Statistics                                                                                                                                                     +31mn yen
                                                                                                           etc.
AFFO (mn yen)                                3,098           3,151                +52          3,137
AFFO payout ratio                           85.4%           88.1%              +2.7%           86.2%      2
LTV                                         32.7%           32.3%               -0.4%          32.4%      ・Increase in expenses such as property tax
                                                                                                                                                     -108mn yen
                                                                                                           for properties acquired in 10th FP
Average Occupancy                           99.8%           99.8%                ±0%           99.9%

                                                                                                                                                                                6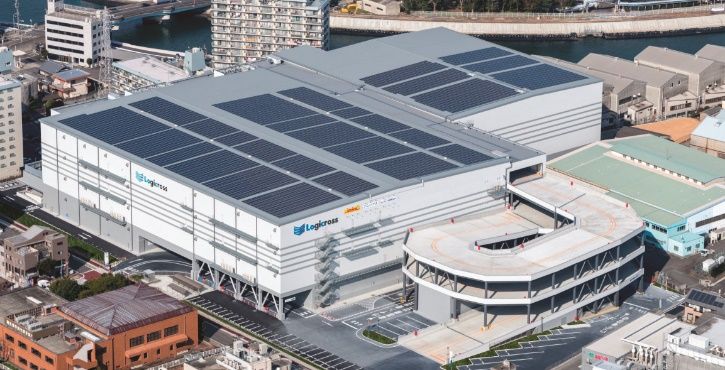
Growth Strategy
Features of Mitsubishi Estate Logistics REIT Investment Corporation

Stable Growth Strategy with Hybrid Model “Developer × Real Estate Asset Manager”

                                      Sponsor-developed
        No. of Properties /
                                      Properties / Asset
            Asset Size                  Management                        Average                Appraisal              Forecasted LTV                 Credit Rating
                                      Company-sourced                    Occupancy               NOI Yield                  (FP 2022/2)                   (JCR)
         22 properties/                   Properties
                                                                                                                           32.3%
                                            61.1%/                       99.8%                   4.9%                                                      AA-
         170.4bn yen                                                                                                                                       (Stable)
                                            38.9%
                 Sponsor                                                                                                                  Asset Management Company

                                                             Development /                        Investment /
                                                             Facilities Management                Asset Management

                  ● Dedicated to city development in the Marunouchi area (Tokyo) for                     ● Established in 2001, when          the scheme of real estate
                    over 120 years                                                                          securitization was emerging in Japan
                  ● Contributing to the society through a variety of business activities as
   Overview                                                                                   Overview   ● Track record including structuring and management of various types
                      one of the largest comprehensive real estate                                         of real estate funds, such as the largest private REIT in Japan
                      developers
                                                                                                         ● Proven track records in a variety of asset types in investment and
                  ● Promoting the logistic facility business as a growth area
                                                                                                           asset management
                  ● Constant supply of pipeline properties from Sponsor
                    through development of advanced logistics facilities Refer to P.9                    ● Flexible and diverse acquisition strategies, using a
                  ● Utilization of Sponsor’s know-how and corporate customer relations                     wide range of schemes, such as bridge funds including value-
                    in the leasing activities Refer to P.11, 24                                            up, PDP and CRE Refer to P.9, 26
    Support                                                                                   Support
                  ● Promotion of capital recycling business in domestic                                  ● Internal growth leveraging unique know-how      in addition to
                    asset business and consistent expansion of AUM and DX                                   rent revision, such     as installation of LED lighting and solar
                    promotion in non-asset business Refer to P.23, 25                                       panels Refer to P.11

 Note: As of Aug. 31, 2021

                                                                                                                                                                                8
External Growth Strategy
16 properties / Total floor area: 1,136,000m2 (preferential negotiation rights)
Sponsor-Developed Properties Asset Management Company-Sourced Properties
Capability to develop logistics facilities independently Capability to assess properties backed by experience in
based on extensive land information continuous acquisitions of properties since 2001
Capability to co-develop facilities backed by MEC’s ability Logicross MJ Logipark Flexible and diversified property acquisition strategy
and credibility for development Brand of logistics facilities Properties which MEL acquired or leveraging the capability to manage real estate funds
MEC develops throughout Japan intends to acquire from the 3rd parties
Asset Management Company-Sourced properties with
Sponsor-Developed properties with expected preferential negotiation right
expected preferential negotiation right
Occupancy Occupancy Occupancy Occupancy Occupancy PDP
100% 100% 100% 100% 100%
Occupancy
100%
Logicross Yokohama Logicross Hasuda Logista・Logicross LOGIPORT Kawasaki Bay Logicross Atsugi II MJ Logipark Takatsuki 1*
Kohoku(16,000m2) (79,000m2) Ibaraki Saito (B) (31,000m2) (296,000m2) (35,000m2) (19,000m2)
Completed in 2019 Completed in 2021 Completed in 2019 Completed in 2019 Completed in 2021
Completed in 2021
Occupancy
Pre-leased
100%
PDP PDP (Partnership Development Program)
100%
Pre-leased
Development bridge scheme in which the Asset
100% Manager takes the initiative
Asset Management Company leads the project in a
manner that compensates the needs of partner
companies such as developers, construction companies
and real estate brokers each other
Logista・Logicross Logicross Kasukabe Logicross Funabashi MJ Logipark Kakogawa 1* MEL can preferentially consider acquisition after the
Ibaraki Saito (A) (115,000m2) (39,000m2) (23,000m2) (33,000m2)
building is completed and leased up
Completed in 2021 To be completed in 2021 To be completed in 2022
Completed in 2021
New PDP PDP PDP
Occupancy Pre-leased Pre-leased
100% 100% 100%
Logicross Zama Komatsubara Logicross Zama* Sagamihara Chuo MJ Logipark Inzai 1* MJ Logipark Aisai 1* MJ Logipark Daito 1*
(44,000m2) (183,000m2) Fuchinobe Project* (22,000m2) (10,000m2) (11,000m2)
To be completed in 2022 To be completed in 2023 (173,000m2) Completed in 2021 To be completed in 2022 To be completed in 2022
To be completed in 2023
* Tentative Name
Note: As of Oct. 15, 2021
Other Projects
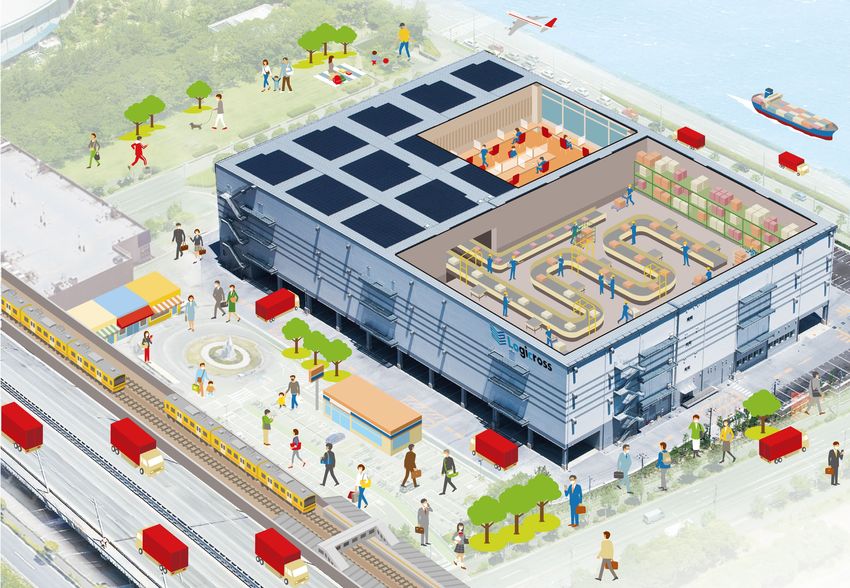
9Portfolio Map
Note 1: As of Oct. 15, 2021
10Internal Growth Strategy ①
Rent Revision
Achieved rent growth for 7 consecutive periods and upward trend is expected to continue for 11th FP
(Based on leased area of the Average Rent Growth
Upward rent revision Rent unchanged Undecided Average Rent Growth
warehouse portion) of Increased Portion
FP 2018/8
(4th FP) 57% 43% 11,000㎡ +1.8% +3.0%
FP 2019/2
(5th FP)
4% 96% 62,000㎡ +0.2% +3.4%
FP 2019/8
(6th FP)
40% 60% 40,000㎡ +3.1% +6.8%
FP 2020/2
(7th FP)
88% 12% 19,000㎡ +2.2% +2.5%
FP 2020/8
(8th FP)
93% 7% 21,000㎡ +9.5% +10.4%
FP 2021/2
(9th FP) (Note)
88% 6%6% 24,000㎡ +8.5% +9.7%
FP 2021/8
(10th FP)
95% 5% 33,000㎡ +13.9% +14.9%
FP 2022/2
(11th FP)
86% 14% 59,000㎡ +4.5% +5.4%
(Forecasted)(Note)
0㎡ 86% contracted 30,000㎡ 45,000㎡ 60,000㎡
Steady Growth Unique Initiatives by Asset Management Company
Achieved internal growth since stock listing and expect steady growth in the future. Revenue growth through installation of LED lighting
(mn yen) MJ Logipark Fukuoka 1, LOGIPORT Sagamihara, LOGIPORT Hashimoto
120 Achieved income increase by Solar Panels
MJ Logipark Fukuoka 1, MJ Logipark Atsugi 1
80 Improved tenant satisfaction and
profitability by increasing parking space MJ Logipark Fukuoka 1
40 LOGIPORT Osaka Taisho, MJ Logipark Sendai 1
0 Reduced property tax due to review in asset
2022/2 2022/8
FP2019/2
2019年2月期 2019/8 2020/2 2020/8
2020年8月期 2021/2 2021/8 2022年2月期
(11th FP) (12th FP) valuation
(5th FP) (6th FP) (7th FP) (8th FP) (9th FP) (10th FP)
(Forecasted) (Forecasted) MJ Logipark Funabashi 1、LOGIPORT Sagamihara、
Rent revision Initiatives other than Refund of property tax due MJ Logipark Kazo 1、Logicross Atsugi、LOGIPORT
rent revision to review in asset valuation Osaka Taisho MJ Logipark Atsugi 1
Note: As of Sept. 30, 2021. Lease contracts that are not yet contracted are assumed to be unchanged for the calculation
11Internal Growth Strategy ②
Tenant Data
Type of Cargo
Tenant Diversification
(Based on leased area) (Based on leased area)
Delivery Destination
(Based on leased area)
R
Cargo for EC Daily Necessities
株式会社IHIインフラシステム
IHI Infrastructure Systems 23.6%
1.1%
58.1% e
3PL
67.0%
10.9% 株式会社日本リアリスト
Nihon Realest
2.7%
5.7%
日用品
Household Goods
Food and Beverage
12.9% t
山九株式会社
Sankyu 食品・飲料 3PL
a
8.5% 3PL
4.9% BtoC 29.6% 5.0%
Pharmaceuticals and
オリックス自動車株式会社
ORIX Auto
医薬品・医療用機器
4.9%
83.5%
Medical Devices 卸売
5.6% Wholesale
il
キムラユニティー株式会社 5.5%
Kimura Unity
4.0% PC/Communications,
パソコン・通信機器
株式会社三鷹倉庫
MITAKA SOKO
Home Appliance etc 製造
3.9% Retail
53.6% 9.5%
3.7%
福岡ロジテム株式会社
Fukuoka Logistics System
サン都市建物株式会社
Sun City Building
18.5%
カジュアル衣料
Casual Clothing
原材料・部材
Raw / Component Materials
67.0%
M 小売
Manufacture
3.7%
3.5% ホンダロジコム株式会社
Honda Logicom
Cargo with
Strong Demand 5.0%
23.6% 家具・雑貨
Furniture and Home Goods a その他
Others
3.4% 株式会社 AXions
n
AXions
82.0%
Electronic devices and
3.4% 家電等
Components for Business use
その他
Others
その他
Others
Average Occupancy Rate and
Lease Agreement Expiration Schedule (Note 2)
Lease Agreements
(㎡) Lease agreements that expired
契約満了予定面積 Contracted
契約済み面積 lease Rent
賃料比 ratio (right axis) (%)
Average agreements
99.8% 150,000 20
Occupancy Rate
15
100,000
Fixed-term
100.0% 10
Lease 50,000
5
Weighted Average 0 0
7.0 years
Remaining Expiry 2022/2 2023/2 2024/2 2025/2 2026/2 2027/2 2028/2 2029/2 2030/2 2038/8 2047/8 2048/8 (FP)
2022/8 2023/8 2024/8 2025/8 2026/8 2027/8 2028/8 2029/8
Note 1: As of Aug. 31, 2021.
Note 2: As of Sept. 1, 2021.Excludes land
12Financial Strategy
Financial Highlight
Long-term Debt Ratio Average Remaining
Fixed Interest Rate Ratio Average Debt Cost
Debt Duration (all / excluding short-term)
(all / excluding short-term)
98.5% 98.5% 5.6 years /5.7 years 0.40%/0.41%
Credit Rating (JCR) Forecasted LTV Debt Capacity Debt Capacity
(FP 2022/2) (LTV up to 40%) (LTV up to 50%)
AA-( Stable ) 32.3% Approx. 23 bn yen Approx. 63 bn yen
Lenders Debt Maturity Schedule
三菱UFJ銀行
MUFG Bank, Ltd. 25.6% Long-term borrowings Short-term borrowings
(mn yen)
みずほ銀行
Mizuho Bank, Ltd. 16.6% Investment Corporation Bonds Green Finance
三井住友銀行
Sumitomo Mitsui Banking Corporation 15.6% 10,000
福岡銀行
The Bank of Fukuoka, Ltd. 7.3%
農林中央金庫
The Norinchukin Bank 7.2%
信金中央金庫
Shinkin Central BankThe 4.9% 8,000
全国信用協同組合連合会
Shinkumi Federation Bank 4.6%
Total Debt 新生銀行
Shinsei Bank, Limited 3.0%
Balance 山口銀行 6,000
The Yamaguchi Bank, Ltd. 2.5%
59,274 日本政策投資銀行
Development Bank of Japan 2.5%
mn yen 七十七銀行
The 77 Bank, Ltd. 2.4%
4,000
千葉銀行
The Chiba Bank, Ltd. 1.3%
三井住友信託銀行
Sumitomo Mitsui Trust Bank, Limited 0.8%
山梨中央銀行
The Yamanashi Chuo Bank, Ltd. 0.8% 2,000
西日本シティ銀行
The Nishi-Nippon City Bank, Ltd. 0.8%
富山銀行
The Bank of Toyama, Ltd. 0.5%
投資法人債
Investment Corporation Bonds 3.4% 0
Green Finance 2021 2022 2023 2024 2025 2026 2027 2028 2029 2030 2031 2032 2033 2034 2035 2036(year)
Note: As of Oct. 15, 2021
13ESG Initiatives
ESG Initiatives
GRESB Assessment                                               Mitsubishi Estate Group’s Initiatives for ESG
                    For 2021 GRESB Real Estate                          Mitsubishi Estate Group 2030 Goals for SDGs
                    Assessment, MEL was awarded the                              (Long-term Business Plan)
                    prestigious “5 Stars” for the second
                    consecutive year based on a                1.Environment
                    comparative assessment by overall             Sustainable urban development
                    score, and “Green Star” for third             that proactively addresses climate
                    consecutive year.                             change and environmental issues
                    In addition, in the “GRESB Public          2.Diversity & Inclusion
                    Disclosure” (5-level rating) that             Urban development that responds to
                    measures the level of ESG information         lifestyle and human resources trends and
                    disclosure, MEL’s effort to disclose ESG      facilitates active participation for all
                    information was highly evaluated and
                    awarded the highest rank “A Level” for     3.Innovation
                                                                  Innovative urban development that
                    the second consecutive year.
                                                                  continuously renews society
Signing of PRI                                                 4.Resilience
                    Asset Management Company became               Dynamic, flexible urban development that
                    a signatory of PRI, the Principles for        builds disaster-resilient communities and
                    Reasonable Investment in March 2020.          prioritizes safety and security
                    PRI encourages the incorporation of
                    Environment, Social and Governance
                    issues into investment decision-           Participate in United Nations Global Compact
                    making processes, with the aim to          (UNGC)
                    help companies enhance long-term
                    investment performance and better          UNGC is a voluntary, global initiative supporting a
                    fulfill their fiduciary duty.              global framework for sustainable growth through the
Preparing for supporting the recommendation by the             demonstration of creative, responsible leadership by
                                                               the respective corporations and organizations as
“Task Force on Climate-related Financial Disclosures           principled members of society.
(TCFD)”                                                        Mitsubishi Estate became a signatory of the UNGC
                    In order to express our support the
                                                               and Mitsubishi Estate Group was registered as
                    recommendation by the TCFD, preparing      participants in April 2018. Along with this, the Asset
                    to expand information disclosure such as   Management Company has participated in this
                    MEL's climate change policy and KPIs.      initiative as a member of Mitsubishi Estate Group.

                                                                                                                        15
ESG Initiatives (Environment)
Environment
Promotion of Green Portfolio
Ratio of Green Properties in Portfolio(Total Floor Area basis) 79.1 %
Certification System # of properties Property Name Evaluation
Logicross Fukuoka Hisayama DBJ Green Building Certification:★★★★
Building-Housing Energy-Efficiency
9
Logicross Atsugi BELS:★★★★★ / CASBEE S Rank for Real Estate
Labeling System (BELS) Logicross Kobe Sanda BELS:★★★★ / CASBEE A Rank for Real Estate
Logicross Osaka BELS:★★★★★ / CASBEE S Rank for Real Estate
Logicross Nagoya Kasadera BELS:★★★★★ / CASBEE S Rank for Real Estate
Comprehensive Assessment System for
Built Environment Efficiency (CASBEE) 9 Logicross Narashino
LOGIPORT Sagamihara
BELS:★★★★★ / CASBEE S Rank for Real Estate
BELS:★★★★ / CASBEE S Rank for Real Estate
LOGIPORT Hashimoto BELS:★★ / CASBEE S Rank for Real Estate
LOGIPORT Osaka Taisho BELS:★★★★★ / ZEB Ready / CASBEE S Rank for Real Estate
DBJ Green Building Certification 1 MJ Logipark Kasugai 1 CASBEE A Rank for New Construction Aichi
MJ Logipark Kazo1 BELS:★★★★★
Examples of Initiatives
Energy Saving
Initiatives
Insulated sandwich panels Installation of Reuse of OA floor panels of Renovation with LED installation
for exterior walls motion-detection sensors office buildings in Marunouchi based on Green Lease contract
Use of Renewable
Energy
/BCP Initiatives
Installation of solar panels Seismic isolators Installation of emergency Measures against infectious diseases
power generators (acrylic plate, hand sanitizer)
16ESG Initiatives (Social)
Social
Proactive Participation in CSR Activities Tenant Satisfaction Survey
Participation in flower bed Register for Disaster Cooperation Conducted a tenant satisfaction survey in collaboration with a third party
maintenance activities of Building (LOGIPORT Sagamihara, agency to improve facility management. The survey included hardware /
community near Logicross Atsugi LOGIPORT Hashimoto) software aspects and tenants’ opinions on the facilities.
During the 10th FP, the survey results were utilized in improvement in day-to-
day service through installation of thermos cameras and AEDs, and measures to
ease bird damages.
Logicross Nagoya Kasadera Logicross Nagoya Kasadera MJ Logipark Sendai 1
Collaboration with Local Educational Institute and
Lawn-mowing at greenery areas Designation as a Tsunami Evacuation
in MJ Logipark Atsugi 1 Building (Logicross Nagoya Kasadera) Improvement in Tenant Satisfaction
Conducted a survey to employees and reflected the result on the renovation
of the employee lounge. Also, a wall design contest involving local universities
and vocational schools was held and the design of the winner is used for the
lounge’s wall design of MJ Logipark Fukuoka 1
Before After
Securing reserves in case of Free salt candy service for tenants in Measures for Employees’ Comfort
properties as a heatstroke measure
emergency (food, beverage &
(for all properties held as of Aug. 2021)
portable toilet) Offering Comfortable Working Environment
Donation of 1,900 unused surgical masks
stored to the Chiyoda Ward Health Center Examples in the Asset Management Company
Donation of unused calendars to elementary Introduction of flexible working hour
schools in developing countries through Installation of community spaces within office area
support organizations as a substitute for Invitation of personnel from group companies and
notebooks outside professionals
Specialized training for skill improvement
Donation of disaster prevention supplies
Annual employee satisfaction survey
that are no longer needed to volunteer
firefighters and rescue teams in developing These initiatives are intended to maximize asset management performance by improving productivity,
countries through support organizations skills and motivation of employees
17ESG Initiatives (Governance)
Governance
Asset Management Fee Structure Measures to Address Conflict of Interests
Introduced an asset management fee structure reflecting the in Asset Management
performance of investment unit price for the purpose of aligning Any asset acquisition from or sale to stakeholders of MEL is determined
interest with unitholders through a transparent decision-making process at MJIA
Asset management Total assets as of the end of the previous period × 0.2% (upper
fee I (AUM-linked) limit)
Drafting by Logistics REIT Management Department
Asset management
fee Ⅱ (Real estate Adjusted NOI × 5.0% (upper limit)
profit-linked)
Adjusted net income before tax × net income before tax per
unit × 0.001% (upper limit) 1st in J-REITs
Asset management
Examination by Compliance Department
“Fee linked to Investment Unit Price”
fee Ⅲ (unitholder Performance against TSE REIT Index ((a)-(b)) × market cap
interest-linked) (for fiscal period of each term) × 0.1% (upper limit)
(a): Fluctuations in MEL’s investment unit price (incl. dividends)
(b): Fluctuations in the TSE REIT Index (incl. dividends)
Deliberation by Executive Committee
MJIA
(If voted down)
※Need to be attended by a third party appraiser
Investment unit price of MEL TSE REIT Index (incl. dividends) If MEL’s growth rate is
greater
X + DPU
Y Increase fee Deliberation by Compliance & Risk Management Committee
※Need to be attended by an external expert (legal counsel)
If MEL’s growth rate is
Y lower
X + DPU
Decrease fee
Reference date (Previous period) Reference date (Present period) Deliberation by Board of Directors if necessary
Pursuant to Company’s Regulations
Ratio of same-boat investment by
Mitsubishi Estate c. 4.1%
(as of Oct. 15, 2021)
MEL
Approval by MEL’s Board of Directors
Cumulative Investment for Employees
Note: An example of the decision-making flow in cases that fall under the category of transactions with
Introduced cumulative investment for employees of Sponsor and MJIA stakeholders, etc. requiring approval of the board of directors of the investment corporation pursuant to
Article 201-2 of the Act on Investment Trusts and Investment Corporations
with the aim of continued increase in unitholders’ value and provision
of benefits to employees
18Green Finance
Initiatives for Financing utilizing ESG Assessments evaluated by External Organizations
Green Bond
MEL issued Green Bonds on Apr. 14, 2021, with the terms described below in order to promote efforts to improve sustainability and to further strengthen our
financial base
Name
Investment Corporation 1st Series Unsecured Green Eligible Assets for Investment(Note 1)
Bonds (Green Bonds)
Total Amount
2,000 mn yen /15 years
Issued / Term
Interest Rate 0.700% per annum
Credit Rating
AA-
(JCR)
Evaluation LOGIPORT Osaka Taisho Logicross Osaka Logicross Nagoya Kasadera
“Green 1(F)” (highest for JCR Green Finance
by Third-Party BELS: ★★★★★(ZEB Ready) BELS: ★★★★★ BELS: ★★★★★
Evaluation) rating in Green Finance Framework CASBEE: S Rank for Real Estate CASBEE: S Rank for Real Estate
Entities CASBEE: S Rank for Real Estate
Upper Limit of Green Finance Other ESG Finance
Repayment /
Funds Procurement Allocation MEL received the highest rank of
Redemption
(mn yen) Date Status
Date "S" in "MUFG ESG Rating Certificate
Mar. 9, Mar. 9, for J-REIT supported by JCR" and
Green Loan 1,350 Allocated
2021 2025 borrowed "MUFG ESG Loan for J-
Sept. 14, Sept. 14, REIT" from MUFG Bank for the first
Green Loan 720 Allocated
2021 2028
case
Apr. 14, Apr. 14,
Green Bond 2,000 Allocated
2021 2036
First case in J-REIT financed by
Total Green Finance 4,070 ― ― ―
SMBC with “Funding to promote
SDG’s”
Upper Limit of Green Finance(Note 2) 38,964 ― ― ―
Note 1: The proceeds from the Green Bonds issuance have been allocated to the prepayment of a portion of the short-term loans which were borrowed for the acquisition of three properties described above
Note 2: The Upper Limit of Green Finance = Total Acquisition Price of Green Eligible Assets × Total Asset. LTV is calculated based on Aug. 31, 2021
19Mid-to Long-Term Growth Strategy
Mid-to Long-Term Growth Strategy
Asset size target and transition of key financial figures
Asset Size
Sponsor-Developed Asset Management Company-Sourced
Target
170.4 bn yen 300 bn yen
142.1 bn yen
Asset Size Aim for Further
113.7 bn yen 113.7 bn yen Growth in
83.2 bn yen 83.2 bn yen Asset Size
70.8 bn yen
2nd 3rd 4th Aim for further
1st Follow-on Follow-on Follow-on Follow-on inclusion in major
Offering Offering Offering Offering indices
Continue to carefully
32.7% Stabilized LTV monitor the market
LTV 30.0% 29.4%
31.4% 32.3% 32.4%
and acquire properties
27.0% 27.0% 40%~50%
25.0% through equity
offerings and flexible
use of LTV, which is
the lowest level among
all J-REITs
6,764 7,099 6,910
6,003 6,520 yen yen yen
5,492 5,524 5,907 yen
5,292 yen yen Aim to increase DPU
DPU yen yen yen Aim for continued
through disciplined
growth
growth
Aim to steadily grow
NAV per unit and
343,818 maximize unitholder
323,737 yen value
yen
293,133 298,032
NAV Per yen yen Aim for continued
Unit 269,217 270,016 275,236 growth
yen yen yen
FP 2018/8 FP 2019/2 FP 2019/8 FP 2020/2 FP 2020/8 FP 2021/2 FP 2021/8 FP 2022/2 FP 2022/8
(4th FP) (5th FP) (6th FP) (7th FP) (8th FP) (9th FP) (10th FP) (11th FP) (12th FP)
Note: As of Oct. 15, 2021
21Features of Mitsubishi Estate Group’s
Logistic Facilities BusinessProjects in Mitsubishi Estate Group’s Logistics Facilities Business
History of Logistics Facility Business in Mitsubishi Estate Group
MEC Group has developed safe and secure logistics facilities proactively and consistently, since the commencement of the business in 1967, and strengthened capacity with the establishment of
Logistics Facilities Development Office within Urban Project Development Department in 2012
MEC Group aims to enhance social infrastructure and quality of life through this high-growth business, leveraging expertise and relations cultivated as a comprehensive real estate developer
Invested in Tokyo Completed LOGIPORT Completed Logicross Completed LOGIPORT Completed rebuilding of Completed Logicross Completed 4 properties incl. Completed (planned) 5 properties
Ryutsu Center (TRC) Sagamihara Fukuoka Hisayama Hashimoto TRC Building B Narashino Logicross Nagoya Kasadera incl. Logicross Hasuda
Completed Tatsumi Scheduled
Logistics Center completion of
(former Nakano Made TRC a Logicross series
Shokai Tatsumi consolidated and other
Center) subsidiary properties
1967 2012 2013 2014 2015 2016 2017 2018 2019 2020 2021 2022 and
after
Outline of Tokyo Ryutsu Center (TRC) Strengthened Efforts in Logistics Facilities
Established in 1967 under the support from the government and economic Development at MEC
circles, for the purpose of streamline commercial distribution that faced Medium-term Management Plan (2017) Completed Logicross Scheduled completion
challenges due to population concentration, etc. caused by the rapid MEC announced its plan to accelerate “capital Atsugi and Logicross Completed LOGIPORT of rebuilding of TRC
economic growth, through operating a large-scale distribution center Kobe Sanda Kawasaki Bay Building A
recycling investment” to enhance the logistics facilities
Operating logistics facilities business for more than five decades at ideal business through development, ownership and
locations near central Tokyo, adjacent to Oi Container Terminal and operation and management of facilities
Haneda Airport, which are convenient for land-sea-and-air transportation
Long-Term Management Plan 2030 (2020)
Promoting new projects (PM business and use of logistics technology, etc.) MEC indicated its plan to enhance “capital recycling
in recent years to meet diversified needs by leveraging know-how of business” in the Domestic Asset Business and to
property management increase AUM and utilize new technologies in the Non-
asset Business
Characteristics of Logicross Series, Logistics Facilities Offered by Mitsubishi Estate
SAFETY AMENITY
MOVING
TOMORROW
Logistics facilities moving the future BCP Measures Large-scale
Common Manpower-
emergency generator
space saving
Logicross, the brand of logistics facilities offered by FUNCTIONALITY measures
Mitsubishi Estate, is developed under the vision of FLEXIBILITY
• Effective height under beam of 5.5m
creating the future of logistics by integrating values of or more
the new era into logistics facilities. • Pillar interval of 10m×10m or wider
• Floor weight capacity of 1.5t/㎡ or more
Our aim is to move the future, let alone things.
Mitsubishi Estate will continue efforts for non-stop
evolution in logistics facilities for a sustainable and Thinning-out Sufficient power Potential
enriched society. of pillars at capacity floor slab
Vertical conveying the top floor opening
Warehouse Truck berth
capacity
23Features of MEC Group’s Logistics Facilities Business
Strengths of MEC Group Land Acquisition Development Operation & Management
1 Obtaining of a variety of land
Diversified business portfolio information
Management of development cost
Advanced development 2 Consolidation of plots of land from 3 Coordination among stakeholders
capabilities multiple landowners and the administration
Strengths as a 4
comprehensive Corporate customer relations Collection of land information utilizing relations and land development Group-wide leasing
developer
5
Customer network Exploration of land information Exploration of tenants’ needs at
supported by branches on site various locations
Numerous joint project
Experiences of joint projects requiring coordination between stakeholders with different interests
experiences
Strengthening of value chain Reflection of tenants’ needs Understanding of tenants’ needs for Understanding of tenants’
through in-house PM in land acquisition facility specifications usage needs
Strengths of 6
the Logistics Capturing of information from tenants Utilization of relations with tenants of
Collaboration with TRC
Facilities of facilities in operation facilities in operation
Business 7
Logistics solutions utilizing Efforts to improve operational
technologies efficiency and meet tenants’ needs
1 Obtaining of a variety of land information 3 Coordination among stakeholders and 5 Customer network supported by 6 Collaboration with TRC
the administration branches
Obtaining a variety of land information through MEL’s ability to respond to complex Promotion of accumulation of know-how
Use of the regional network mainly in
group-wide information sharing schemes for ownership interest swaps through personnel exchange
the areas where MEC’s head office
were highly rated Floor area of 1,000k㎡ under PM
and branches are located to achieve
consignment
tenant-leasing activities
TRC’s Track Record in PM Consignment
Logicross Nagoya Logicross Logicross Kobe Sanda (#) (10k㎡)
Kasadera Hasuda 30 150
2 Consolidation of plots of land from multiple 4 Corporate customer relations Needs of logistics bases 20 100
landowners Kansai Branch
Efforts such as acquiring development lands through Collaborative project making full use of 10 50
land consolidation of multiple owners relation with office tenant in Otemachi, Provide BTS
Marunouchi and Provision of Logistic 0 0
Yurakucho area Information Facilities 2018/3 2019/3 2020/3 2021/3 2021/9
Logicross Kobe Sanda
LOGIPORT Area (Right Axis)
面積(右軸) No.
物件数 of
Logistics Facility Business
Kawasaki Bay properties
Logicross Kasukabe
247 Challenges for Logistics Solutions through Use of Technologies
Launch of a co-working showroom that aims to solve problems
through logistics tech (TRC) Introduction of AI robot cleaner
● The “TRC LODGE”, a permanent ● “Whiz”, an AI robot cleaner is introduced at
exhibition space where visitors can Logicross Ebina
learn the latest logistics tech to help ● Part of the janitorial services that used to be man-
solve problems of all sizes faced by power labor is covered by the robot
logistics companies is launched ● Introduction of the robot in Logicross properties to
● A “Seminar and Co-working Space” is be completed is under review, with an aim to
available for exhibiting companies to establish a new method of property management
“TRC LODGE”, a permanent exhibition space
hold seminars, etc. in the era of labor shortage and the trend of
contactless services under the COVID-19 pandemic ©SoftBank Robotics
● The “Time Share Warehouse” is an
experimental space where companies Introduction of “ELE-CINEMA”, in-elevator projection-type media
can rent the entire latest warehouse for
(TRC)
an hour or more to test and Time Share Warehouse Seminar and Co-working Space
demonstrate new products. It can be ● “ELE-CINEMA”, an in-elevator projection
used not only for the display of existing media offered by a MEC subsidiary, is
products, but also for new product introduced for the purpose of enhancing
development and demonstration convenience of facility users
● ”Machi-Pass”, a shared identification system developed by MEC, is used for ● The media publishes in-building
management of visitors. MEC Group is now expanding the scope of services to announcement and disaster prevention
which “Machi-Pass” is linked, with an aim to improve QOL of each user through a information, in addition to news and
rich and better user experience (UX) based on accumulated and optimized data of weather forecast, gourmet and other
experiences tips for daily life
Consulting Services for Tenants’ Warehouse Operation Utilizing
AI-based Analytics Development of Facility Management Service Using Drones (TRC)
● A demonstration test of consulting services for warehouse
operation has been started, in collaboration with a ● The joint development of an advanced and
provider of AI-based image analysis services efficient operation/management method
was started, utilizing TRC’s
● Analyses of traffic lines and operation within a warehouse
operational/management know-how
are summarized into a report, based on which consulting
services are offered to solve issues and improve facility ● The MEC Group promotes digital
services transformation unbound by the traditional
● High value-added services, including AI and other state- Real Estate Business, through the fusion of
of-the-art technologies, are to be offered to tenants Real Estate Assets and digital technology
25Progress in MJIA(the Asset Management Company)’s Sourcing
Bridge Scheme PDP
Partner
3rd Party Bridge Seller PDP Scheme
Based on the track record MJIA leads the project in a
and credibility of the Broker
manner that compensates the
MEL
established real estate AM
Tenant needs of partners each other
MEL can preferentially consider
Constructor acquisition after the building is
MJIA arrange whole
development project by completed and leased up
Developer
matching each partners’ need
Bridge Fund
Based on the relations MJ Logipark Takatsuki 1* MJ Logipark Kakogawa 1* MJ Logipark Inzai 1* MJ Logipark Aisai 1* MJ Logipark Daito 1*
with a number of
investors
The optimal method will be chosen in
consideration of the timing and size of
acquisition, and information sources, etc.
MEL will acquire a property when Value-up
conditions for acquisition, including the
timing and price, are set out Installation of the vertical machinery
MJ Logipark Kasugai 1 MJIA’s leasing capacity MJ Logipark Sendai 1 has improved tenants’ convenience
helped the property
and resulted in rent increase
Reduction in Book Value achieve early lease-up
Increase rate +10.7%
The occupancy rate of
Floor area covered c.5,000㎡
46% as of the acquisition
by the bridge fund Installation of toilets outside the
1,200
Book improved to 100% by the Improved building for drivers has also
Improved
value
1,000 occupancy rate time of acquisition earnings improved the convenience
Anticipated
800 acquisition
600
price Anticipated
acquisition CRE
price Anticipated
400 acquisition
price Anticipated Properties are acquired based on strategic proposals tailored to the portfolio of the seller, leveraging the credibility of MEC
acquisition
200
price
Group and network of MJIA
0 MJ Logipark Kazo 1 MJ Logipark Tsuchiura 1 MJ Industrial Park Sakai MJ Industrial Park Kobe MJ Industrial Park
Inclusion into (Land) (Land) Chiba-Kita (Land)
Term
bridge fund
Timing of acquisition is adjusted and the
acquisition price can be reduced along with the
reduction in book value at the bridge fund
* Tentative name
26Logistics Market Overview
Logistics Market Overview ①
Tokyo Metropolitan Area Osaka Metropolitan Area
New supply (left axis) Forecast new supply (left axis) New demand (left axis) New supply (left axis) Forecast new supply (left axis) New demand (left axis)
Vacancy rate (right axis) Vacancy rate of one year Vacancy rate (right axis) Vacancy rate of one year
(Thousand ㎡) after completion (right axis) (%) (Thousand ㎡) after completion (right axis) (%)
3,000 10 1,400 15
2,500 1,200
8
1,000
2,000 10
6 800
1,500
4 600
1,000 5
400
500 2
200
0 0 0 0
2009 2010 2011 2012 2013 2014 2015 2016 2017 2018 2019 2020 2021 2021 2022(year) 2009 2010 2011 2012 2013 2014 2015 2016 2017 2018 2019 2020 2021 2021 2022(year)
Q1-Q2 Q1-Q2
Forecast Forecast
Nagoya Metropolitan Area Kyushu Area
New supply (left axis) Forecast new supply (left axis) New demand (left axis)
New supply (left axis) New demand (left axis) Vacancy rate (right axis)
Vacancy rate (right axis) Vacancy rate of one year
after completion (right axis)
(Thousand ㎡) (%) (Thousand ㎡) (%)
600 50 160 16
500 140 14
40
120 12
400
30 100 10
300
80 8
200 20 60 6
100
40 4
10
0 20 2
(100) 0 0 0
2009 2010 2011 2012 2013 2014 2015 2016 2017 2018 2019 2020 2021 2021 2022(year) 2009 2010 2011 2012 2013 2014 2015 2016 2017 2018 2019 2020 2021(year)
Q1-Q2 Forecast
Q1-Q2
Source: CBRE
Note1: “Tokyo Metropolitan Area” refers to Tokyo, Chiba, Saitama, Kanagawa and Ibaraki. “Osaka Metropolitan Area” refers to Osaka, Hyogo and Kyoto. “Nagoya Metropolitan Area” refers to Aichi, Mie and Gifu. “Kyushu Area” refers to Fukuoka and Saga.
Note2: “New supply” refers to the total leasable area of newly constructed logistics facilities for lease. “New demand” refers to an increase or decrease in occupied floor space. An increase or decrease in occupied floor space is newly contracted floor
space minus vacated floor space.
Note3: The survey covers logistics facilities for lease with a total floor area of 5,000㎡ or more, which are owned by real estate investment companies and real estate development companies, etc.
The survey does not include logistics facilities for lease owned by logistics companies, etc., and does not cover all logistics facilities for lease with a total floor space of 5,000㎡ or more.
28Logistics Market Overview ②
Expansion of E-commerce Market(Goods Sales) 3PL Market Size
3PL market size
(100 bn yen) Sales of E-commerce(Goods Sales) (100 bn yen)
150 40
30
100
20
50
10
0 0
2013 2014 2015 2016 2017 2018 2019 2020 (year) 2010 2011 2012 2013 2014 2015 2016 2017 2018 2019 2020(FY)
Note: “Sales of E-commerce(Goods Sales)” in the chart above is an estimate of the value of transactions on the Internet between Note: Each fiscal year is the period beginning on April 1 and ending on March 31 of the following year. It does not coincide with the fiscal
companies and consumers (BtoC). The figures are for all goods consumed by individuals. Market estimates are calculated and totaled period of MEL
for goods sales sector Source: Data compiled by the Asset Management Company based on "Monthly Logistics Business Sep. 2021“
Source: Data compiled by the Asset Management Company based on data from "FY2020 Industrial Economic Research Commissioned Project
(E-Commerce Market Survey)" (July 2021) by the Ministry of Economy, Trade and Industry
E-commerce Penetration Rate Retail Market Size
Department store Super market
(%) Japan U.S. UK
(100 bn yen) Convenience store Drug Store
32 Online shop(Goods Sales)
180
26.7
24 150
16 120
8.5 13.5 90
8
4.4 8.1 60
2.8
0
30
2010 2011 2012 2013 2014 2015 2016 2017 2018 2019 2020 2021(year)
2010 2011 2012 2013 2014 2015 2016 2017 2018 2019 2020(year)
2Q Source: Data compiled by the Asset Management Company based on data from “Monthly Report on the Current Survey of Commerce April
Source: Data compiled by the Asset Management Company based on data from “FY2020 International Economic Research Project for 2021” (March 2021) by the Ministry of Economy, Trade and Industry and "FY2020 Industrial Economic Research Commissioned
Establishing a Domestic and Foreign Economic Growth Strategy” (July 2021) by the Ministry of Economy, Trade and Industry (Japan), Project (E-Commerce Market Survey)" (July 2021) by the Ministry of Economy, Trade and Industry
Office for National Statistics(UK) and U.S. Census Bureau (USA). Refer to press release disclosed information until 2Q 2020 for U.S.
and UK, while until 2020 for Japan
The Percentage of Households Using Online Shopping Monthly Trends in Cargo delivery (Ministry of Land, Infrastructure,
(%) 2019 2020 2021 Transport and Tourism)
(Items, mn) Cargo delivery (left axis) Growth vs same month 2019 (right axis)
(%)
60
500 50
55
50 400 40
45 300 30
40 200 20
35 100 10
30 0 0
Jan. Feb Mar. Apr. May. Jun.
Jan. Feb. Mar. Apr. May. Jun. Jul. Aug. Sep. Oct. Nov. Dec.
2021
Source: Data compiled by the Asset Management Company based on data from “Monthly Report on the Survey of Household Economy" (July Source: Data compiled by the Asset Management Company based on data from “Transportation
2021) by Statistics Bureau of Japan by truck“ (June 2021) by the Ministry of Land, Infrastructure, Transport and Tourism
29Appendix
Overview of 4th Follow-On Offering and New Acquisition
                                     Domestic Public Offering
  Offering format                                                                             No. of Properties /                                Total
                                     (with Extraordinary Report)
                                                                                             Total Acquisition Price                         Appraisal Value
  Launch date                        Feb. 18, 2021 (Thursday)
  Pricing date                       Mar. 1, 2021 (Monday)                                 5   properties/ 28.2          bn yen              30.4     bn yen

  Issue price                        403,650 yen per unit
                                     Units issued:41,000 units                                  Average Appraisal                               Average
  Total number of                    (Designated Purchaser 1,750 units)                             NOI Yield                                 Property Age
  issued units
                                     Overallotment:1,898 units
  Total amount issued 17.3 bn yen
                                                                                                       4.6       %                             2.4   years

 Logicross Narashino (Narashino, Chiba)
                                                                           Occupancy
 Acquisition Price 11,851 mn yen                                             100%

 Appraisal Value       12,400 mn yen                                                   MJ Industrial Park Kobe (Land) (Kobe, Hyogo)
                                                                                                                                                                 CRE
     Appraisal                                                                         Acquisition Price   4,970 mn yen
                       4.3%
     NOI Yield                                                                                                                                                 Occupancy
                                                                                        Appraisal Value    5,670 mn yen                                          100%
 Total Floor Area      36,437.92m2
                                                                                           Appraisal
   Main Tenant         Nihon Realest Co., Ltd.                                                             5.1%
                                                                                           NOI Yield
                                                                                        Total Floor Area   40,050.71m2
 Logicross Osaka (40% additional co-beneficiary interest) (Osaka, Osaka)
 Acquisition Price 3,868 mn yen
                                                                           Occupancy     Main Tenant       ORIX Auto Corporation
                                                                             100%

 Appraisal Value       4,000 mn yen
     Appraisal
                       4.3%
     NOI Yield
                                                                                       MJ Industrial Park Chiba-Kita (Land) (Chiba, Chiba)
 Total Floor Area 36,619.48m2                                                                                                                                    CRE
                                                                                       Acquisition Price   1,800 mn yen
   Main Tenant         e-LogiT Co., Ltd., other
                                                                                        Appraisal Value    1,950 mn yen                                        Occupancy
                                                                                                                                                                 100%
                                                                                           Appraisal
 Logicross Nagoya Kasadera (40% additional co-beneficiary interest) (Nagoya, Aichi)                        4.4%
                                                                                           NOI Yield
 Acquisition Price 5,719 mn yen
                                                                           Occupancy
                                                                             100%
                                                                                        Total Floor Area   14,986.64m2

 Appraisal Value       6,400 mn yen                                                                        Kinugawa Rubber
                                                                                         Main Tenant
                                                                                                           Industrial Co., Ltd.
     Appraisal
                       5.0%
     NOI Yield
 Total Floor Area      72,376.03m2
   Main Tenant         YAGAMI Co., Ltd., others

 Note: Data at the time of 4th follow-on offering

                                                                                                                                                                           31
Effect through 4th Follow-On Offering
Asset Size DPU (Stabilized basis)
Property tax
2,000 expensed
+28.2 bn yen 7,500
+7.3%
1,704億円
170.4 bn yen 7,000 6,910円
yen
28.4 bn yen +8.3%
+
6,500 6,438円
yen
1,500 142.1 bn yen
1,421億円
6,000 5,947円
yen
1,137億円
113.7 bn yen
5,500
1,000
5,000
4,500
0
500 0
4,000
FP 2020/8
2020年8月期(第8期) Post-3rd
第3回公募増資後 Post-4th
第4回公募増資後 Pre-3rd
第3回公募増資前 Post-3rd
第3回公募増資後 Post-4th
第4回公募増資後
(9th FP) Follow-on Offering Follow-on Offering Follow-on Offering Follow-on Offering Follow-on Offering
NAV per Unit LTV・Debt Capacity
Forecasted LTV
LTV Forecasted LTV
post-3rd
340,000 +4.1% FP 2020/8 (9th FP) follow-on offering
FP 2022/2 (11th FP)
329,777円
yen
330,000
+ 6.3% 29.4% 30.9% 32.3%
320,000 316,918円
yen
310,000
Debt capacity Debt capacity
300,000 298,032 yen (up to 40%) (up to 50%)
290,000
0
280,000
23 bn yen 63 bn yen
FP 2020/8
2020年8月期(第8期) Post-3rd
第3回公募増資後 Post-4th
第4回公募増資後
(9th FP) Follow-on Offering Follow-on Offering
Note: Data at the time of 4th follow-on offering. Forecasted LTV and debt capacity are as of Oct. 15, 2021
32Properties Acquired during the 10th Fiscal Period ①
Logicross Narashino
Sponsor-
Multi
Developed
■High-spec multi-tenant facility located in Chiba Bay area near central Tokyo
■Advantage in securing labor with 5-minute walk to the nearest station
Convenient Location
close to Shin-Narashino Station
Located proximity to
residential areas,
Residential Area which is advantageous
in securing labor force
The latest hub for the
Shin-Narashino tenant, Nihon Realest
Station Co. Ltd., a 3PL
company
Expect stable cash
flow with 4 tenants
including major
Logicross Narashino logistics company
Industrial / Logistics Area
Acquisition Price 11,851 mn yen
Property Characteristics
■4-story box-type with 2 entrances, and truck berths on both north and south sides of the 1st floor. Equipped with both luggage and
Appraisal Value 12,400 mn yen vertical conveyor (4 of each in total)
■Floor weight capacity of 1.5t/m2, effective ceiling height of 5.5m, pillar span of 10.45m x 10.4m, making it a highly versatile, easy-to-
Appraisal NOI use logistics facility
4.3%
Yield
Main Highway
Location Narashino, Chiba
■Approx. 2km from “Yatsu Funabashi IC” on Higashi-Kanto Expressway
Year Built Mar. 2018 ■Approx. 3km from “Hanawa IC” on Keiyo Expressway
■Approx. 400m from National Route 357
Total Floor Area 36,437.92m2
Location Characteristics
Land Area 19,386.40m2
■Located in Akanehama, Narashino in Chiba Bay area. Surrounding area is concentrated with factories, logistics facilities, retails and
No. of Tenants 1 universities. Also, there are many logistics facilities in the neighboring Shibazono area, and Keiyo Food Industrial Complex in Takase,
Funabashi, where food-related factories are concentrated
Main Tenant Nihon Realest Co., Ltd. ■Relatively good access to ports and airports (approx. 30km from Port of Tokyo, approx. 40km from Narita and Haneda Airport)
Note: Data at the time of 4th follow-on offering
33Properties Acquired during the 10th Fiscal Period ②
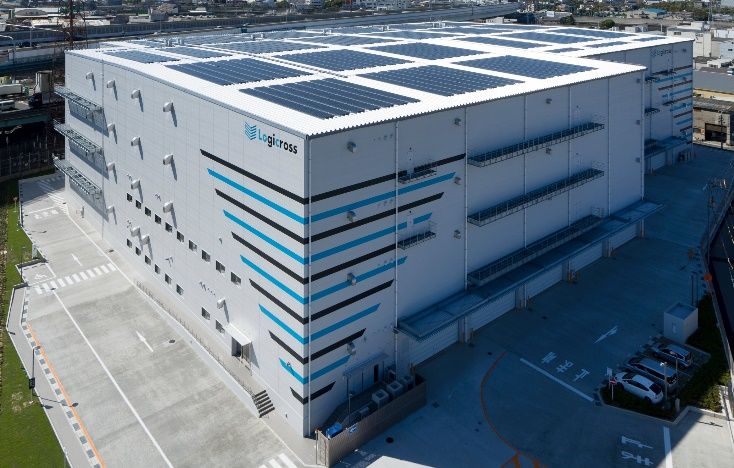
Logicross Osaka (40% additional co-beneficiary interest)
Sponsor-
Multi
Developed
■High-performance multi-tenant facility with accessible to major consumption areas (Osaka and Kobe) CASBEE BELS
■Advantage in securing labor with walking distance from two train stations
Capturing Strong E-commerce Demand
A 3PL company specialized in E-commerce
Leased to e-LogiT Co., Ltd., a company which provides comprehensive
mail-order services
e-LogiT Co., Ltd. uses the facility as the first fulfillment center in Kansai region,
and plans to expand its business in the near future
The tenant values its high potential location with good access to major
consumption areas in Osaka and Kobe
Acquisition Price
Property Characteristics
3,868 mn yen
■4 story box-type with 2 truck berths, equipped with luggage elevators and vertical conveyors (4 in each section), making it easy to
Appraisal Value 4,000 mn yen rent the facility in sections
■Each floor has an effective ceiling height of 5.5m and a floor weight capacity of 1.5t/m2, making it a highly versatile, easy-to-use
Appraisal NOI logistics facility
4.3%
Yield
Main Highway
Location Osaka, Osaka
■Approx. 1.5km from “Amagasaki Higashi IC” on Hanshin Expressway No.3 Kobe Line,
Year Built Sept. 2018 and approx. 4km from “Nakajima IC” on Hanshin Expressway No. 5 Wangan Line
■Approx. 200m from National Route 43
Total Floor Area 36,619.48m2
Location Characteristics
Land Area 18,176.07m2
■Located 7.5km from the center of Osaka (Umeda Station) and 24km from Kobe City (Sannomiya Station). Easy access to Port of
No. of Tenants 2 Hanshin (Port of Osaka and Kobe) and to a wide area via Hanshin Expressway No.3 Kobe Line and No.5 Wangan Line, and proximity
to National Route 43 leads to high potential location
Main Tenant e-LogiT Co., Ltd., other ■It is possible to operate 24 hours a day, 365 days a year
Note: Data at the time of 4th follow-on offering
34Properties Acquired during the 10th Fiscal Period ③
Logicross Nagoya Kasadera (40% additional co-beneficiary interest)
Sponsor-
Multi
Developed
■Proximity to central Nagoya and can cover a wide area in Chubu CASBEE BELS
■Advantage in securing labor with walking distance from a station serving 2 train lines
Acquired Land Information as a Comprehensive Developer
The Sponsor has collected a wide range of land information as a comprehensive
developer and developed the facility for the most effective use
Collection of a wide range of land information
Group
Hotel /
Offices Retails Residences Logistics
Airport
Consideration of Environment / Society
Reuse of Material Tsunami Evacuation Facility Designation
Reuse of OA floor panels used Facility can be used as a temporary shelter for
in Marunouchi area office space local residents in the event of major tsunami
warning. Equipped with
emergency generators
and emergency storage
for employees
Acquisition Price 5,719 mn yen
Property Characteristics
■Direct access to each floor with spiral rampway, floor weight capacity of 1.5t/m2, an effective ceiling height of at least 5.5m, a pillar
Appraisal Value 6,400 mn yen span of at least 10m and equipped with LED lighting
■Installed emergency generators and storage for employees to support tenants’ BCP
Appraisal NOI
5.0% Main Highway
Yield
Location Nagoya, Aichi ■Located approx. 1.2km from “Kasadera IC” on Nagoya Expressway No.3 Odaka Line, approx. 3.0km from “Kiba IC” on Nagoya
Expressway No.4 Tokai Line, and approx. 6km from “Tokai IC” on Isewangan Expressway
Year Built Jan. 2019 ■Located approx. 0.5km from National Route 23, approx. 1.5km from National Route 247 and approx. 0.5km from National Route 1
Total Floor Area 72,376.03m2 Location Characteristics
Land Area 33,224.00m2 ■Located near “Kasadera IC”, allows easy access to Nagoya Highway No.4 Tokai Line and Isewangan Expressway. Proximity to National
Route 23, which crosses the Nagoya Port area, and National Route 247, which crosses from Nagoya City to Tokai City, making it a
No. of Tenants 10 convenient transportation
■Easy access to Nagoya Port, Japan's largest port in terms of total cargo handled, and Chubu Centrair International Airport can be
Main Tenant YAGAMI Co., Ltd., others reached in 35 minutes, making it possible to use the major logistics infrastructure of Aichi Prefecture
Note: Data at the time of 4th follow-on offering
35Properties Acquired during the 10th Fiscal Period ④
MJ Industrial Park Kobe (Land) CRE MJ Industrial Park Chiba-Kita (Land) CRE
■CRE project in Hanshin bay area capturing Asset Management ■CRE project proximity to National Route 16 Asset Management
Company-Sourced Company-Sourced
seller’s business restructuring needs capturing tenant’s off-balance sheet needs
Property Characteristics Property Characteristics
■Newly developed base for tenant (major
car leasing company), covering the Kinki, ■Production base with headquarters functions
Chugoku and Shikoku areas of an automotive parts manufacturer
Main Highway Main Highway
■Approx. 1.4km from “Sumiyoshihama ■Approx. 2.1km from “Chiba-Kita IC” on
IC” on Hanshin Expressway No.5 Higashi-Kanto Expressway
Wangan Line ■Approx. 300m from National Route 16
■Approx. 2.4km from “Uozaki IC” on
Hanshin Expressway No.3 Kobe Line
Location Characteristics
Acquisition Price 4,970 mn yen Location Characteristics Acquisition Price 1,800 mn yen ■Easy access to “Chiba-Kita IC” and
National Route 16. Competitive business
■Proximity to IC which gives excellent
Appraisal Value 5,670 mn yen Appraisal Value 1,950 mn yen site due to advantage of securing labor as
access to central Osaka and Kobe.
surrounded by residential area
Advantage in securing labor with
Appraisal NOI walking distance from nearest train Appraisal NOI ■High potential to be a highly versatile
5.1% 4.4% location that can be converted to logistics
Yield station Yield
facility with excellent access to Higashi-
■High potential for redevelopment to
Location Kobe, Hyogo Location Chiba, Chiba Kanto Expressway, Keiyo Expressway,
logistics facilities
National Route 14, National Route 16,
■Expected further improvements in National Route 126, providing connection
Land Area 40,050.71m2 transportation convenience following the Land Area 14,986.64m2 to central Tokyo, access to Narita Airport
construction of Hanshin Expressway and Tokyo Bay area
Osaka Wangan Line (Rokko Island North Kinugawa Rubber
Main Tenant ORIX Auto Corporation Main Tenant
to Komasakae) commenced in 2016 Industrial Co., Ltd.
Ensuring long-term stable income through CRE proposal Property acquisition through CRE strategy
Capturing seller’s selling needs and securing stable income through long-term lease Acquisition that captures the seller’s demand for sale-and-leaseback
Building owner & Tenant Building owner & Tenant
Seller Construction/Ownership Ownership
Sale of land
Sale of land Land lease Building
Building Land lease
Land Land
Land owner Land owner
Note: Data at the time of 4th follow-on offering
36You can also read