Pepperdine Endowment and a Peppering of Best Ideas - Thursday, October 3rd Fairmont Hotel Vancouver
←
→
Page content transcription
If your browser does not render page correctly, please read the page content below

Pepperdine Endowment and a Peppering of Best Ideas
        How a major endowment allocates to alternatives
                plus a plethora of great ideas!

                   Thursday, October 3rd
                    Fairmont Hotel Vancouver
              900 West Georgia Street, Vancouver, BC
CAASA ANNUAL CONFERENCE

       MONDAY, NOVEMBER 4 &
     TUESDAY, NOVEMBER 5, 2019
       FAIRMONT QUEEN ELIZABETH HOTEL
          MONTRÉAL, QUÉBEC, CANADA

INVESTORS, ASSET MANAGERS & SERVICE PROVIDERS FROM ACROSS CANADA AND
                                               AROUND THE WORLD
                   SPECIAL DAY 1 SESSIONS FOR INVESTORS & SPONSORS
                           TÊTE-À-TÊTE SCHEDULED MEETINGS FOR ALL
 EXCLUSIVELY FOR CAASA MEMBERS AND REAL MONEY INVESTORS SUCH AS SFOs,
                      SWFs, PENSIONS, FOUNDATIONS, AND ENDOWMENTS
2 | PEPPERDINE AND A PEPPERING OF BESTMAXIMUM         ROOM
                                      IDEAS - VANCOUVER - OCTOBERCAPACITY:
                                                                  3, 2019  200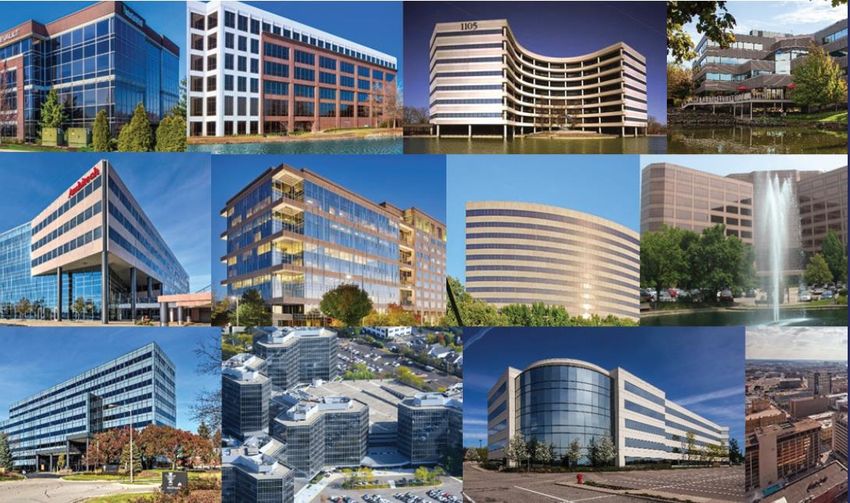
Afternoon of Alternatives
            Pepperdine and a Peppering of Best Ideas
                     Thursday, October 3rd, 1:30pm - 5:00pm
                                Hotel Vancouver
                                 Vancouver, BC

                    Keynote, Best Ideas & Table Talks
 Your opportunity to hear how a progressive endowment uses alternatives.

                         1:30pm - Registration
          2:00pm - Keynote - Using Alts in a Portfolio Setting
               2:30pm - Best Ideas (4mins + 2mins Q&A)
               3:30pm - Table talks (3x 10-minute rounds)
                          4:00pm - Reception                                                 Michael Nicks
                             5:00pm - End                                                 Director of Investments
 These short sessions are designed to give investors a briefing on each                   Pepperdine University
manager/idea in attendance. Table talks are where investors and advisors                        Endowment
  can get more information and ask in-depth questions. A background                          Keynote speaker
            information Spotlight Booklet will be produced.
                                             Participating Managers:

                    Julian Klymochko                          Kerry Stirton                         Jason Jogia
                      Founder & CEO                        Managing Partner                             CIO
                    Accelerate Financial                  Alignvest Investment                   Avenue Living Asset
                       Technologies                           Management                            Management

                      Matt Zabloski
                 Founder & Lead Portfolio                  Anthony Guarnieri                         Travis Dowle
                         Manager                               District VP                     President & Fund Manager
                 Delbrook Capital Advisors                    Group RMC                       Maxam Capital Management

                        Guy Caplan                          Fraser McEwen                             Yu-Jia Zhu
                          Founder                               Partner                         Co-Founder and CIO
                    Pilot House Capital                     Slate Securities                   White Crane Capital Corp.

                                                             Lisa Stewart
                                                        Associate Vice President,
                                                            Capital Markets
                                                        Neighbourhood Holdings

   This event is exclusive to pension plans, endowments, foundations, single family offices, investment
advisors, and CAASA members in the multi-family office, consultant, and service provider categories only
- as well as CAASA manager members who are speaking. If you have any questions, please contact the
                              CAASA office (paul@caasa.ca
                                                PEPPERDINE AND Aor 416 953-0737).
                                                                PEPPERING OF BEST IDEAS - VANCOUVER - OCTOBER 3, 2019 | 2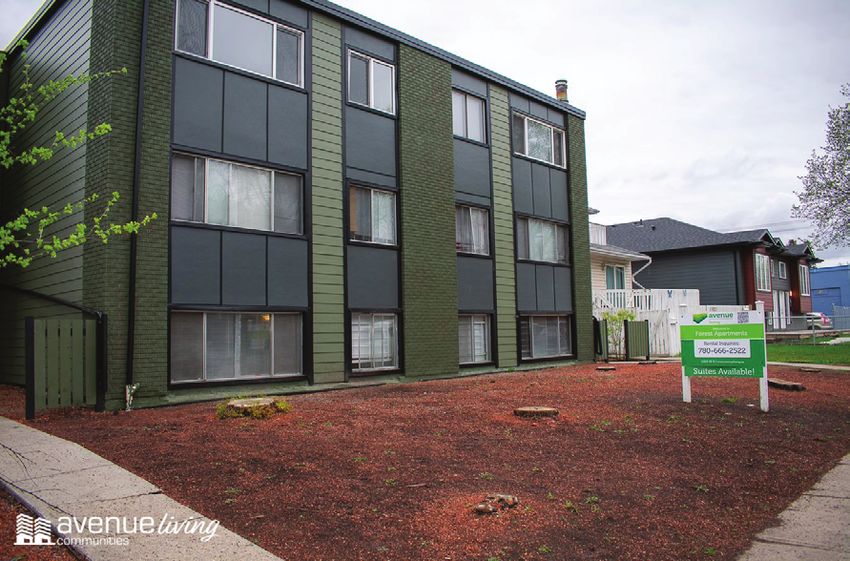
www.AccelerateShares.com

 Enhanced Benchmark                                Absolute Return             Private Equity

  Hedge Fund & Private Equity ETFs
      at a 0% management fee

3 |   PEPPERDINE AND A PEPPERING OF BEST IDEAS - VANCOUVER - OCTOBER 3, 2019
Scan here to download
                                                        free ebook

                                                           or visit
                                                   www.AccelerateShares.com

Gain valuable insights from Accelerate CEO and
manager of award-winning hedge funds,
Julian Klymochko, in his book Reminiscences of a
Hedge Fund Operator

                     PEPPERDINE AND A PEPPERING OF BEST IDEAS - VANCOUVER - OCTOBER 3, 2019 | 4
Invest
    Invest like
           like the
                the most
                    most successful
                         successful pension
                                    pension
    plans
    plans and
          and endowments
               endowments inin the
                               the world.
                                   world.
    The Alignvest Strategic Partners Fund is a globally diversified
    The Alignvest Strategic Partners Fund is a globally diversified
    portfolio actively managed by a world-class team with senior
    portfolio actively managed by a world-class team with senior
    experience at Canada Pension Plan Investment Board and
    experience at Canada Pension Plan Investment Board and
    other top global investment institutions.
    other top global investment institutions.

    Learn more at www.alignveststrategicpartnersfund.com and contact:
    Learn more at www.alignveststrategicpartnersfund.com and contact:
    Athas Kouvaras | 1-844-335-9372 | aspf@alignvest.com
    Athas Kouvaras | 1-844-335-9372 | aspf@alignvest.com
    70th Floor, First Canadian Place, 100 King Street West, Toronto, ON M5X 1C7
    70th Floor, First Canadian Place, 100 King Street West, Toronto, ON M5X 1C7

    Important information about this Fund, including its investment objectives and strategies, purchase
    Important
    options, andinformation
                   applicable about  this Fund,
                               management         including
                                               fees,         its investment
                                                     performance     fees, andobjectives
                                                                                expenses,and   strategies,
                                                                                           is contained  in purchase
                                                                                                            its offering
    options, and applicable
    memorandum.                management
                     Commissions,              fees, performance
                                     trailing commissions,           fees, andfees,
                                                               management       expenses,  is contained
                                                                                     performance          in its offering
                                                                                                   fees, other   charges and
    memorandum.      Commissions,    trailing commissions,     management      fees, performance
    expenses all may be associated with investing in this Fund. Please read the offering memorandumfees,  other   charges and
                                                                                                                     before
5
    expenses
    investing. all
    | PEPPERDINE
                   may be associated
               Investment    fundsOFare
                   AND A PEPPERING
                                        with
                                        not
                                     BEST
                                              investing
                                             guaranteed,
                                          IDEAS
                                                         in this
                                                - VANCOUVERtheir
                                                                  Fund.
                                                                  values
                                                            - OCTOBER
                                                                         Please
                                                                           change
                                                                       3, 2019
                                                                                 read the offering
                                                                                   frequently       memorandum
                                                                                               and past  performance before
                                                                                                                         may
    investing. Investment
    not be repeated.         funds  are not  guaranteed,    their  values   change frequently  and  past  performance     may
    not be repeated.
Upgrade your risk and reward profile by adding true
Upgrade your risk and reward profile by adding true
global diversification, alternative investments, and
global diversification, alternative investments, and
institutional-quality portfolio construction.
institutional-quality portfolio construction.

Why
Why shift
    shift from
          from 60/40?
               60/40?
Many leading strategists believe that a typical portfolio of 60% equity
Many leading strategists believe that a typical portfolio of 60% equity
and 40% bonds is expected to earn half the return over the next 10
and 40% bonds is expected to earn half the return over the next 10
years11 compared with the previous few decades with similar volatility.
years compared with the previous few decades with similar volatility.
All investors need real diversification, across and within asset
All investors need real diversification, across and within asset
classes, implemented by a team that understands sophisticated risk
classes, implemented by a team that understands sophisticated risk
management and alternative ways to generate returns.
management and alternative ways to generate returns.

Alternative Strategies 25%
Alternative Strategies 25%

                                                   ASPF
                                                   ASPF
Alternative Assets 20%
                                                Long-term
                                                Long-term                                 Global Equity 45%
Alternative Assets 20%
                                                 Strategic
                                                 Strategic
                                                                                          Global Equity 45%

                                                Asset
                                                Asset Mix
                                                       Mix
Global Fixed Income 10%
Global Fixed Income 10%

1
    McKinsey & Company: “Why investors may need to lower their sights”
1
    McKinsey & Company: “Why investors may need to lower
                                             PEPPERDINE   their
                                                        AND     sights”OF BEST IDEAS - VANCOUVER - OCTOBER 3, 2019
                                                            A PEPPERING                                              | 6
Avenue Living Real Estate Core Trust
                                                      Fund Summary as of August 30, 2019

            $
       Initial NAV             Current NAV                LTV               Targeted Annual Yield                Distributions          Target Net Returns
      $10.00 / Unit            $10.15 / Unit              59%                  7% ($0.70 / Unit)                Return of Capital          (Annualized)
                                                                                                                                             8% - 12%

Avenue Living Real Estate Core Trust (the “Core Trust”) is an income producing, diversified private real estate income trust,
which provides exposure to multi-residential rental properties across 15 markets in Western Canada through the Core Trust
investment in Avenue Living (2014) LP (the “Partnership”). Since its beginnings in 2006, the Partnership has rapidly grown
its portfolio to include over 7,700 multi-residential units and 48,413 sf of commercial area, totaling over $1.2 billion in AUM.

                                                                WORKFORCE HOUSING
          INVESTMENT BENEFITS                                                                                               MANAGEMENT TEAM
                                                                = ESSENTIAL WORKERS

  Diversification and reduced portfolio volatility as a   We have strategically aligned our multi-residential       Collectively, the Management team has over 100
  result of geographical and product diversification      assets to focus on Workforce Housing, not to be           years in multi-residential rental property acquisi-
  while offering a passive stable income stream           confused with affordable housing or workcamps,            tions, commercial financing, condominium con-
  Monthly return of capital distributions with the        Workforce Housing caters to a city’s “essential           versions, portfolio assembly and real estate trust
  opportunity for long-term growth through asset          workers” who are overqualified for affordable             management
  appreciation                                            housing yet may not be able to afford average             Over $240M in Founders equity in the capital
                                                          market-rate homes, whether for rent or purchase.          stack and pari passu with Core Trust investors
  Maximization of unit value through active portfolio
  management, increasing occupancy and increas-           The Canadian Workforce Housing population
  ing market rents                                        makes up almost 40% of provincial populations
                                                          on average (Source: Statistics Canada)
  Strong track record of acquiring assets below
  stabilized market value and add value through           Our 15 markets are diversified economies driven
  repositioning and improved vertically integrated        by various sectors such as healthcare, agricul-
  property management                                     ture, retail trade, and construction (limited expo-
                                                          sure to oil and gas centric markets)

               Fund Type Open-ended Mutual Fund Trust
               Fund Status Offering Memorandum
               Fund AUM ~$1.2 Billion
               Investment Minimum $5,000                                                                          FOR FURTHER INFORMATION:
               Registered Plan Status Eligible (RRSP, RRIF, LIRA, TFSA)                                    Emily Newman, VP Business Development
  TRUST        Purchases Monthly
                                                                                                                 enewman@avenueliving.ca
 DETAILS       Redemptions Monthly
               $50,000/month subject to liquidity and notice                                                     Ken Lee, VP Business Development
               MER 2018: 1.91%                                                                                        klee@avenueliving.ca
               Refer to Offering Memorandum
               Auditors Ernst & Young
               External Legal Counsel Fasken Martineau DuMoulin LLP

www.avenuelivingam.com
   7 | PEPPERDINE AND A PEPPERING OF BEST IDEAS - VANCOUVER - OCTOBER 3, 2019
NOTES

PEPPERDINE AND A PEPPERING OF BEST IDEAS - VANCOUVER - OCTOBER 3, 2019 | 8

CAASA – October 1, 2019

                                        DELBROOK CAPITAL – FIRM PROFILE

Firm Overview
                                                                       Matthew Zabloski: Founder / Portfolio Manager
Delbrook Capital Advisors Inc. is an independent
investment fund manager located in Vancouver,                                               Mr. Zabloski is the Managing
British Columbia. The Firm focuses on investment                                            Director    of    Delbrook     Capital
opportunities in the “hard asset” sectors, specifically                                     Advisors. He has over 15 years of
materials, and manages one of the few equity                                                capital markets experience, 6 years of
long/short strategies globally. The firm was founded                                        which were spent as a Portfolio
by Portfolio Manager, Matthew Zabloski in 2013.                                             Manager at Fidelity Management
Delbrook manages capital across various mandates,                                           and Research Company. At Fidelity,
including two open-end alternative funds: the                                               Mr. Zabloski managed over a billion
Delbrook Resource Opportunities Fund, a Canadian
Mutual Fund Trust & the Delbrook Resource                              dollars in sector focused capital, consistently ranking
Opportunities Master Fund LP, an offshore                              among the top performing investment managers.
partnership – both consistently ranked in the top
decile globally vs. peers.                                             In 2008, Mr. Zabloski co-founded CI Cambridge Advisors,
                                                                       a Boston based investment manager that grew from less
The Funds invest primarily in publicly listed                          than $10 million to nearly a billion dollars in assets under
companies which are focused on hard asset                              management during its first two years of business. Most
opportunities in precious, base, energy and industrial                 recently, Mr. Zabloski was named as a founding board
metals production and exploration. As a compliment                     member of the Shareholder Gold Council (SGC). Mr.
to bottoms up security selection, the team focuses                     Zabloski holds an MBA and an Honors BA from the
on opportunities which are positioned to benefit, or                   Richard Ivey School of Business at the University of
be disrupted by, changing structural and global                        Western Ontario.
trends – including the growth in electric vehicles (EV)
and the consolidation within the sector.

                    Contact Details

          Delbrook Capital Advisors Inc.
      Suite 650 - 1021 West Hastings Street
             Vancouver, BC V6E 0C3
                     Canada

              Telephone: 604.229.1450
          Email: adam@delbrookcapital.com

    9 |    PEPPERDINE AND A PEPPERING OF BEST IDEAS - VANCOUVER - OCTOBER 3, 2019
9 CAASA – October 1, 2019
PEAK PESSIMISM IN THE COPPER MARKET IS ENDING
Introduction:
The constant stream of negative trade rhetoric since mid 2018 has overshadowed the strong underlying fundamentals of
copper, resulting in an over 20% price decline in the last 18-months. High quality equities have fallen out of favor– a trend
that we believe will reverse in the near term. Our highest conviction ideas remain First Quantum Minerals (TSX:FM) and
Ivanhoe Mines (TSX: IVN). A few data points that support our constructive outlook for copper are below.
• With a beta of four, Copper is the most closely correlated metal to global trade and GDP growth.
• Historically, there is a strong inverse relationship between US dollar and copper prices. More recently, copper and US
dollar correlation has reached -0.6.
• Most importantly, we believe copper is significantly mispriced both in LME terms and contract markets, given current
demand/supply fundamentals. The market has switched from a surplus to a sizeable deficit of 420Kt for 2019, the widest
in 15 years. This deficit is expected to continue for the next 2-3 years, which will result in upward pressure on prices.
Weakness in global trade has been a key headwind A stronger USD, partly due to trade war, has hurt copper
20% 150% 0.40% -0.06%
Copper Price Change %
-0.04%
USD Value Change %
100%
Correlation: +0.7 0.20% -0.02%
10%
50% 0.00%
0% 0.00% 0.02%
0%
0.04%
-50%
-0.20% 0.06%
-10% -100% 2007 2010 2013 2015 2018
2019
2001 2007 2013 2019
World trade volume, yoy - rhs Copper price, yoy - lhs Copper Price Bloomberg Dollar Spot Index
Source: CPB / Bloomberg / Delbrook Capital
Regardless of the outcome of trade negotiations, we expect the US dollar to decline due to increasing economic
concerns and easing of monetary conditions by the Fed. Our conviction in a rising copper prices comes from our belief
that the underlying fundamentals, driven by a lack of new supply coming online and decreasing head grades, are very
constructive. We see copper significantly undervalued relative to other metals as neither LME prices nor subdued premia
are currently pricing in the strong supply fundamentals of the market. We expect a strong micro backdrop combined
with net short positions near their 2016 lows to lead to a sharp price increase once the macro picture improves.
Copper grades have significantly decreased Weakest copper supply growth in a decade (2019-2021)
1.5% Global Copper Grade of 1.6% in 1990 Forecast 6.0%
5.0% 4.8%
Paid Copper Grade (%)
1.3%
4.0% 20-year average mine
1.1% 4.0% supply growth
3.0% 3.0%
0.9% 1.8%
2.0% 1.5%
0.7% 0.5%
Global Paid Copper Chile Paid Copper
0.5% 0.0%
2000 2005 2010 2015 2020 2025 2014 2015 2016 2017 2018 2019E 2020E 2021E
PEPPERDINE AND A PEPPERING OF BEST IDEAS - VANCOUVER - OCTOBER 3, 2019 | 10
Source: Wood Mackenzie / Bloomberg / Delbrook CapitalGroup RMC Principles:
Premier Assets at an Attractive Basis
Group RMC seeks to Co-invest in institutional
quality office property with in-place cap rates
COMPANY OVERVIEW of approximately 8 - 10% and significant
discount to replacement costs of 40% - 60% to
Group RMC is a real estate Co-Investment group based in New York City that invests in, comparable office sales within the market.
sponsors, and is the General Partner in undervalued income-producing office properties in
primarily secondary and tertiary U.S. markets. Group RMC aims to provide sustainable
quarterly income distributions and capital appreciation. Group RMC and its principals have Diversified Income with Stable Returns
been actively acquiring commercial office properties in Canada and the U.S. for nearly 20 Group RMC’s strategy is to carefully screen,
years. select and acquire properties with potential
Group RMC currently oversees over 16,300,000 square feet of commercial real estate in to improve and increase value over time in
the US, principally in the Midwest, representing over $2 Billion USD in asset value. The secondary markets. Waiting sometimes
principals of Group RMC typically invest up to 5-20% of the equity in each partnership. This years for the right deal is more effective
offers limited partners the opportunity to co-invest alongside principals with significant “skin than accepting a so-so deal.
in the game”.
Strong Strategic Partnerships
Group RMC works with high-performing local
managers and leasing agents associated with
national firms such as CBRE, Colliers, and
Cushman & Wakefield, as well as regional
firms when appropriate.
Group RMC Investment Criteria:
Diversified, multi-tenant buildings with
stable long-term leases
Purchase at a 40% to 60% discount to
replacement cost
Office property previously owned,
managed, and maintained by institutions
MAP OF ASSETS IN THE U.S. Group RMC Portfolio Composition
Well-positioned, easily accessible, with
high barriers to entry for new construction
Ohio 21.4%
Kansas 18.3%
MN Group RM C Highlights:
10 Illinois 15.4%
MI
3
Indiana 12.6% +$2bn of asset value
OH
IL IN 27 Tennessee 10.4% +16.3M SF of office space
46
MO 20
KS
29 5 Oklahoma 6.3% 185+ properties across 12 States
OK TN 8
Michigan 5.1% Largest landlord in Kansas City, KS
11
AL
1 Minnesota 3.4%
Largest suburban landlord in Columbus, OH
Wisconsin 3.1%
Largest landlord in Memphis, TN
Missouri 2.4%
Kentucky 0.9% 2nd largest suburban landlord in Chicago, IL
Note: Portfolio Composition is based on SF.
Alabama 0.8% 0% Management Fee and no recurring fees
info@grouprmcusa.com
Contact Information
CONTACT US 6500 Trans-Canada, Suite 350, Pointe-Claire, QC H9R 0A5 Canada www.grouprmcusa.com
11 | PEPPERDINE AND ATrade
One World PEPPERING
Center,OF BEST
Ste IDEAS
83G, New -York,
VANCOUVER - OCTOBER
NY 10007, USA 3, 2019NOTES PEPPERDINE AND A PEPPERING OF BEST IDEAS - VANCOUVER - OCTOBER 3, 2019 | 12
Maxam Capital Management Ltd.

           Maxam Capital is an independent investment management firm based in
                                    Vancouver, Canada.

             Maxam Capital was founded with the philosophy that a value-oriented,
               opportunistic and flexible approach to investing provides the best
             opportunity for the generation of strong risk-adjusted returns through a
                                 variety of market environments.

Where the opportunities are

 13 |   PEPPERDINE AND A PEPPERING OF BEST IDEAS - VANCOUVER - OCTOBER 3, 2019
Maxam Diversified Strategies Fund
A diversified event-driven long/short fund focused on value, catalysts and special situations
• We invest in companies where we have identified both value and a catalyst
• Flexibility to take advantage of inefficiencies across the market capitalization spectrum
• Strategies employed to generate returns and manage risk: long/short, hedges, merger arbitrage
10 Years of Strong Risk-adjusted Returns
Where the opportunities are
Fund Manager: Travis Dowle, CFA
Travis is the President of Maxam Capital and lead Fund Manager for the Maxam Diversified
Strategies Fund. He began his career in 1996 with MK Wong & Associates, which was later
acquired by HSBC Asset Management. Travis left HSBC in 2007 to lead public market
investments for a private investment group before he founded Maxam in 2009.
Connect with us: 604-685-0201 | info@maxamcm.com | www.maxamcm.com
This information is intended to provide you with information about the Maxam Diversified Strategies Fund. The Maxam Diversified Strategies Fund is only available to accredited
investors and investors who meet other applicable exemptions. Performance for the Maxam Diversified Strategies Fund is Series A Units, annualized and is net of fees and
expenses; Inception date is June 30, 2009; Beta is calculated relative to the S&P/TSX Total Return Index. The Scotiabank Canadian Hedge Fund Index Equal Weighted Index is
as at July 31, 2019 which is the most recent data available at time of publication. Important information about the Fund is contained in the Offering Memorandum which should be
read carefully before investing. You can obtain an offering memorandum from Maxam Capital Management Ltd. The Offering Memorandum for the Maxam Diversified Strategies
Fund does not constitute an offer or solicitation to anyone in any jurisdiction in which such an offer or solicitation is not authorized or to any person to whom it is unlawful to make
such an offer or solicitation. An investment in one of our funds is speculative and high risk. We assume no obligation to update the information in these documents. The indicated
rates of return are the historical compounded returns for the period indicated, including changes in security value and the reinvestment of all distributions and do not take into
account income taxes payable that would have reduced returns. The fund is not guaranteed,AND
PEPPERDINE its values change frequently,
A PEPPERING OF BESTand past-performance
IDEAS VANCOUVERmay not be repeated.
- OCTOBER 3, 2019 | 14)1 ./( )/
%
/$1
Neighbourhood’s investment objective is t* +-*1$ ./
' Ѷ -
0--$)" (*)/#'4 $./-$
0/$*). /* $)1 ./*-.
.
2
'/# +- . -1
/$*) ./-
/ "4ѵ #$. *
%
/$1 $.
#$ 1
4 $)1 ./$)" $)
$1 -.$!$ +*-/!*'$* *! - .$ )/$
'
(*-/"
" .'*
/ $)0-
)
) .0
0-
)
-
.
-*..
)
ѵ
0) $"#'$"#/.
STABLE CASH FLOW GENERATION *(+'$( )/ /* */# - $)
*( $)1 ./( )/.Ѷ .0
#
. +- ! --
.#
- .
) !$3 $)
*( Ѹ$)1 ./( )/..
0-
4
)
$
)-
'
./
/
.. /.
DIVERSIFICATION -$1
/ '4 # ' $)1 ./( )/ .# '/ - !-*( +0
'$
(
-& /
!'0
/0
/$*)Ѹ$)1 ./$)"$)/#
*//*(ۡфп!*ڿ-
'
.. /1
'0
MANAGER ALIGNMENT ۡур!*ڿ0)$/.# '
4(
)
" -.
) $).$ -.
FAVOURABLE CAPITAL STRUCTURE 1 -
" $.
+ -(
) )/ +
-/ *! /#
+$/
' ./-0
/0- Ѷ
0) -+$))$)"
*(+ /$/$1 +-$
$)"!*-*0-
*--*2 -.
) ./-*)"
- /0-).!*-$)1 ./*-.
*-/"
" *-/!*'$**(+*.$/$*)
.
/ 0) тпѶспрш
AVERAGE LOAN-TO- VALUE ффѵуڿ
AVERAGE LOAN SIZE ڦсшшѶхчх
AVERAGE MONTHS TO MATURITY цѵт(*)/#.
AVERAGE DURATION ррѵт(*)/#.
AVERAGE INTEREST RATE чѵпڿ
CREDIT LOSS HISTORY )ڦ$'
*-/"
" *.$/$*) *"-
+#$
$1 -.$!$
/$*)
-& / "( )/
$-./-$*-$/4
*) -$*-$/4 .$ )/$
'(*-/"
" .
уڿ срڿ рппڿ
ттڿ
тڿ
рфڿ
шхڿ счڿ
Neighbourhood Holdings Limited Partnership
Investors@NeighbourhoodHoldings.com
15 | PEPPERDINE AND A PEPPERING OF BEST IDEAS - VANCOUVER - OCTOBER 3, 2019Fund Essentials
AUM (AS AT MARCH 31, 2019) $171.4 million
NAV/UNIT $1.00
DISTRIBUTIONS Monthly, reinvestment available
DATE OF INCEPTION November 16, 2015
LIQUIDITY 1 year commitment; 4% redemption fee for investments
redeemed prior to the 1 year anniversary. Monthly liquidity with
90 days’ notice following the 1 year anniversary.
FUNDSERV CODE NHM 101 – Neighbourhoods Holding LP Class A
NHM 103 – Neighbourhood Holdings LP Class F
Performance
(net of operating expenses and management fees)
A Class (1) I Class S5 (1) F Class (1)
A Class (3) I Class S5 (3) F Class (3)
10%
One and Three Month Returns
9%
8.69%
Annualized
8%
8.16%
7.63%
7%
6%
5%
Jun-18 Sep-18 Dec-18 Mar-19 Jun-19
CDN Universe Bond Index TR A Class I Class S5 F Class
$1,350
1,313
Growth of $1,000 Since Inception
$1,300 1,291
1,268
$1,250
$1,200
$1,150
$1,100 1,102
$1,050
$1,000
Dec-15 Jun-16 Dec-16 Jun-17 Dec-17 Jun-18 Dec-18 Jun-19
Neighbourhood Holdings Limited Partnership
Investors@NeighbourhoodHoldings.com
PEPPERDINE AND A PEPPERING OF BEST IDEAS - VANCOUVER - OCTOBER 3, 2019 | 16Fund Description
Pilot House Equity Opportunities Fund is a liquid, U.S. equity-focused alternative investment fund that employs an
active, event-driven investment approach. Pilot House’s proprietary strategy is rules-based and seeks to profit from
buying and shorting equities trading well away from the manager’s fair value model. Events such as earnings,
corporate events, legal actions, and macro events create trading opportunities. The firm's philosophy is that in the
short-run investors can be impulsive rather than rational which leads to pricing anomalies. The fund’s objective is to
earn a higher risk-adjusted return to investing in the S&P 500 with a similar to higher compounded rate of return over a
three to five year period. The Fund is offered in both USD and CAD currency classes.
Pilot House Capital Philosophy
“There is nothing new on Wall Street or in stock speculation. What has happened in the past will happen again, and
again, and again. This is because human nature does not change, and it is human emotion, solidly built into human
nature, that always gets in the way of human intelligence. Of this I am sure.” - Jesse Livermore "Reminiscence of a
Stock Operator Pulblished 1923.
Fear and greed rule most investors’ emotions. In the short run, investors tend to be impulsive rather than
rational.
Buying and selling at the wrong time is a major reason why investors underperform their benchmarks.
In the long run, all markets are driven by fundamentals but in the short run technicals are the dominant
determinant of return.
Disciplined rules based investing which takes the human emotion out of the buying and selling decision can lead to
superior long-term performance.
Fund Manager
Pilot House Capital Inc. is the investment advisor to the master fund. Guy Caplan, CFA is Pilot House’s CIO and
founder. Mr. Caplan has been an institutional investment manager for over twenty three years, specializing in equities,
credit and hybrid securities. In 2009, he co-founded Raven Rock Capital in Chapel Hill, NC, a hedge fund with peak
assets of US$500 million, specializing in U.S. high yield and convertible arbitrage. Mr. Caplan was Co-Portfolio Manager
and Chief Risk Officer for the funds. From 1999 to 2007, Mr. Caplan was Portfolio Manager and Head of Risk for Argent
Funds Group convertible strategies; under his guidance assets grew from US$200 million to a peak of US$3 billion.
Throughout his career Mr. Caplan has been a speaker at conferences worldwide, including those sponsored by
Goldman Sachs, Deutsche Bank, Absolute Return New York, GAIM USA and GAIM Dubai.
17 | PEPPERDINE AND A PEPPERING OF BEST IDEAS - VANCOUVER - OCTOBER 3, 2019
Pilot House Capital Inc. #202-2438 Marine Drive I West Vancouver, B.C. I 604-603-6059 I info@pilothousefunds.comNOTES PEPPERDINE AND A PEPPERING OF BEST IDEAS - VANCOUVER - OCTOBER 3, 2019 | 18
19 | PEPPERDINE AND A PEPPERING OF BEST IDEAS - VANCOUVER - OCTOBER 3, 2019
NOTES

PEPPERDINE AND A PEPPERING OF BEST IDEAS - VANCOUVER - OCTOBER 3, 2019 | 20
WHITE CRANE MULTI-STRATEGY FUND                                                                      Suite 550 - 1199 West Pender St
                                                                                                                                                Vancouver, BC, V6E 2R1
                                   Event Driven Multi-Strategy                                                                        investors@whitecranecapital.com

FUND PROFILE
White Crane Capital Corp. ("WCC") is the investment adviser to the White Crane Multi-Strategy Master Fund Ltd. (the "Fund"),
which adopts a multi-strategy approach to invest primarily in North American securities. Strategies include transaction driven
arbitrage, convertible arbitrage, deep value catalysts, alpha shorts, stressed credit, and distressed debt. The Fund has an event-
driven focus, which forms a quantifiable bridge between shorter term mispricings and longer term fundamental value. The Fund
invests across the capital structure in secured debt, high yield debt, convertible bonds, preferred equity and common equity,
based on the best risk/reward ratio offered by the event identified. Hedging techniques are utilized, when appropriate, to isolate
the driver of returns to the catalyst.

PRINCIPALS

John Montalbano                                                     Yu-Jia Zhu                                               Emil Khimji
• Built his career at PH&N where he was                             • Co-Founder of WCC in 2017.                             • Co-Founder of WCC in 2017.
  appointed President in 2005.                                      • Vice President at West Face Capital Inc.               • Senior Analyst, Alternative Investments
• In 2008 when RBC acquired PH&N, became CEO                          ("WFC") (2008 to 2017), & member of the                  at PH&N (2007 to 2017).
  of RBC Global Asset Management ("RBC GAM").                         WFC Investment Committee.                              • Member of three person investment
• RBC GAM today cares for $400 billion of assets                    • WFC AUM grew from $600 million to $1.5                   team for the PH&N Absolute Return
  with offices worldwide.                                             billion over tenure.                                     Fund (ARF) and PH&N High Yield Bond
• Currently serves as a director of the Canada                      • WFC is one of Canada’s largest                           Fund (HYBF).
  Pension Plan Investment Board, Aritzia, The                         independent hedge funds, specializing in               • ARF AUM grew from $150 million to $1.6
  Asia Pacific Foundation, Forum for Women                            event-driven investing.                                  billion and HYBF AUM grew from $700
  Entrepreneurs, and Chairs the Vancouver Police                    • Transaction deal sheet includes Maple                    million to $4.2 billion over tenure.
  Foundation and St. Paul’s Hospital Foundation.                      Leaf Foods (activist) and WIND Mobile                  • PH&N ARF ranked #2 on Bloomberg's
                                                                      (distressed).                                            Top Hedge Fund Rankings for 2016.

                Cumulative Return Since Inception (Jan 1, 2018)                                            Maximum Drawdown Since Inception (Jan 1, 2018)
                                                                                                      Jan-18   Apr-18     Jul-18    Oct-18     Jan-19     Apr-19     Jul-19
16%                                                                           15.2%
                                                  13.1%                                         -1%

11%                                 10.1%                                                       -3%
         7.9%                                                                                   -5%
                                                                 6.7%
6%                                                                                              -7%
                                                                                                -9%
1%                                                                                             -11%                White Crane Class F

                                                                                               -13%                S&P TSX
-4%                   -1.7%                                                                                        S&P 500
      Barclays High HFRX Global   iShares    S&P 500 Index     S&P/TSX      White Crane
                                                                                               -15%
       Yield Bond   Hedge Fund Universe Bond                   Composite   Fund (Class F)
       ETF (JNK)       Index    ETF (XBB)                        Index

 Notes: Cumulative Return and Maximum Drawdown are shown through August 31, 2019. Returns are estimated pending year-end audit. Returns for the White Crane
 Fund (Class F) are net of fees (management fee of 1.5% and 15% performance allocation) for a representative Day 1 investor. Individual investor returns may vary. Each
 investor will receive individual statements showing returns from the Fund's administrator. Returns are shown in local currency (US Dollar for the Fund). Maximum
 drawdown, used as a measure of risk management, is defined as the maximum peak to trough decline measured on a monthly return basis since January 1, 2018
 inception.

This data is provided for information purposes only and is not an offer or solicitation. The White Crane Multi-Strategy Feeder Fund Ltd. (the "Fund") is only appropriate for
investors who meet suitability and sophistication requirements. Important information about the Fund is contained in the Offering Memorandum which should be read
carefully before making any investment decision. You can obtain an Offering Memorandum from White Crane Capital Corp. Past performance is not indicative of future
results. The content of this presentation is not and should not be construed to be an offer of securities or services to residents of jurisdctions the Fund is not eligible for
   21 | PEPPERDINE AND A PEPPERING OF BEST IDEAS - VANCOUVER - OCTOBER 3, 2019
sale.
Investment Idea: TeraGo Inc. Current Share Price: $10.25
Target Price: $16.22
Market Cap:
Net Debt:
$170 mm
$20 mm
LTM Revenue:
LTM EBITDA:
$51.5 mm
$12.5 mm
As of September 18, 2019
% Upside: 58% Enterprise Value: $190 mm LTM FCF: $8.2 mm
Ticker: TSX:TGO
INVESTMENT SUMMARY
TeraGo Inc. ("TGO") provides small- and medium-sized businesses across Canada with cloud, colocation and connectivity services. The
company is facing competitive pressure, as competing cable/telcos have deployed fiber across the country and targeted its customers. TGO
currently generates a bit over $50 million a year in revenues, ~$12.5 million in EBITDA and ~$8 milllion in Free Cash Flow.
TGO delivers its connectivity services using wireless spectrum licenses acquired at open auction from the Canadian government in 1999,
which is carried as an intangible asset on its balance sheet worth $10 million. This asset has garnered our attention and forms the crux of
our investment thesis.
MMWAVE SPECTRUM IS ESSENTIAL TO NEXT-GEN 5G WIRELESS NETWORKS
TGO's spectrum licenses are in the 24 GHz and 38 GHz bands, and cover 8.5 billion MHz-POPs (one megahertz of bandwidth covering one
person) in most major cities across Canada.
In the last few years, there has been significant industry interest in "millimeter wave" spectrum (dubbed "mmWave", which includes the 24
GHz and 38 GHz bands that TGO owns licenses in). Mobile data traffic has grown exponentially (60x growth from 2013 to 2024) as
consumers have shown insatiable demand for media heavy applications on their devices. The next-gen 5G wireless standard will heavily
utilize mmWave bands in order to deliver what industry leader Qualcomm calls "fiber-like" data speeds, unlocking all sorts of new
applications (massive bandwidth for cloud computing, lag-less experiences for virtual/augmented reality, fiber equivalent broadband to the
home, etc).
RECENT TRANSACTIONS SUGGEST SIGNIFICANT VALUE IN TGO SHARES
U.S. wireless operators have already turned their focus to acquiring these valuable spectrum licenses, starting with Straight Path
Communications ("STRP"), which in early 2017, was a distressed company and a forced seller of their licenses due to regulatory issues.
Despite the negative dynamics, a bidding war ensued between AT&T and Verizon, and STRP, which previously traded for US$35 per share,
ultimately sold to Verizon for US$184 per share. Dividing the transaction Enterprise Value of STRP by its spectrum holdings gives us a
valuation of US$0.016 per MHz-POP.
Since 2017, there have been two more instances where the value of mmWave spectrum has been supported, in the form of an FCC
spectrum auction in late 2018 (Auction 101) and early 2019 (Auction 102). Auction 101 sold spectrum at 28 GHz, which cleared for
US$0.016 per MHz-POP in the top ten markets. Auction 102 sold spectrum at 24 GHz, which cleared for US$0.018 per MHz-POP in the top
ten markets. Historically, spectrum licenses in Canada have traded at a premium to U.S. valuations.
We believe TGO offers a compelling acquisition target for a Canadian incumbent wireless operator as 1) TGO is the largest current holder of
mmWave spectrum in Canada, offering 400-600 MHz of depth in most major cities; 2) a purchase of TGO would mean the buyer may not
need to purchase additional mmWave spectrum in a competitive ISED auction process; 3) certainty of spectrum holdings would allow for
efficient and expedited 5G network planning today; 4) a purchase of TGO by a Canadian incumbent would preemptively defuse the risk of a
foreign competitor or new entrant acquiring a strategic asset and potentially disrupting the current favourable wireless market dynamics; 5)
at target price of $16.22 per share, would only be a $300 million Enterprise Value transaction, a diminimus amount in the context of any
incumbent.
TeraGo Valuation Components VALUATION METHODOLOGY
Base Business: 7.5x to 8.5x Adjusted EBITDA of $13 million,
equating to a 8% FCF yield. Precedent transactions for data
centres have occured at low- to mid-teens multiples.
Spectrum Value: US$0.016 to US$0.018 per MHz-POP, based on
comparable specrum sold in FCC Auction 101 and 102.
Valuation Range: Based on above goalposts, target valuation
range of $15.18 to $17.27 per share, with a midpoint of $16.22,
representing 58% upside from current share price.
Disclosures: © White Crane Capital Corp. Sources include TGO reports and filings, analyst reports and estimates, U.S. FCC, Canada ISED, and White Crane Capital Corp.
("WCC") estimates. The information set forth in this article does NOT constitute a recommendation to buy or sell any security. The article above represents opinions of WCC,
all readers should perform their own due diligence and research. WCC makes no representation as to the accuracy or completeness of the information set forth in this article.
WCC has no duty to update the contents of this article. Funds advised and managed by WCC are long TGO. WCC may dispose of its position at any time without notice. Certain
of the statements made may contain forward-looking statements, which involve known and unknown risk, uncertainties and other factors which may cause the actual results,
PEPPERDINE
performance or achievements of the company, or industry results, to be materially AND
different A PEPPERING
from OF BEST
any future results, IDEAS - VANCOUVER
performance - OCTOBER
or achievements 3, 2019
expressed | 22by
or implied
such forward-looking statements.CAASA MEMBER COMPANIES
Investors & Allocators: Asset Managers: Asset Managers:
60 Degrees Capital (MFO) Brightspark Ventures Slate Securities
Alberta Teachers’ Retirement Fund CDAM Spartan Fund Management
Blue Bridge Wealth Management Centurion Asset Management Starlight Capital
Casselman and Company (SFO) Chapados Couture Capital Trez Capital
Cidel Claret Asset Management Two Sevens Capital
Eckler Ltd. CI Investments Unison Investment Management
Forthlane (MFO) CIBC Asset Management Waratah Capital Advisors
HarbourVest Partners CMLS Asset Management Wellington Investments
Heirloom Wealth (MFO) Colchis Capital Westbridge Capital
Lux Capital (SFO) Connor, Clark & Lunn Funds White Crane Capital
MCA Cross Border Advisors Cortland Credit Group
Mercer Crown Capital Service Providers
MSTAR Capital (SFO) Crystalline Management Inc. Apex Fund Services
Ontario Teachers’ Pension Plan Delbrook Capital Advisors AUM Law
Our Family Office ehp Funds Battea Class Action Services
Pandion Investments Limited ESO Capital BNY Mellon Wealth Management
Prime Quadrant Espresso Capital Bodhi Research Group
Provident Capital Firepower Capital Cambridge Global Payments
Raintree Wealth Management First Street Capital Castle Hall Diligence
Richardson GMP Forstrong GAM Canadian Derivatives Institute
Rohit Capital Inc. (SFO) Fort LP CIBC Mellon
Stonegate Conseil Privé La Financière Constance Claritas Communications
TIMC Fulcra Asset Management CME Group
Ullman Wealth (MFO) Franklin Templeton Coach House Partners
Group RMC Community Trust
Individuals from the following: Horizons ETFs DealMaker
BMO Nesbitt Burns Integrated Asset Management Group DV Trading
Canaccord Genuity IPM Informed Portfolio Management Fidelity Clearing
Canada Overseas (SFO) JM Fund Management Inc. Fundata
Raymond James Kilgour Williams Capital Glen Williams Consulting
Harbourfront Wealth Lawrence Park Asset Management GlobeTax
Helmsley Charitable Trust LionGuard Capital Management Inc. Goldman Communications
Horizon Capital (SFO) Lighthouse Partners Harneys
Master Plan Management (SFO) Lyxor Asset Management HedgeLegal
RBC Dominion Securities MarsRock Capital Group Instinet Canada Ltd.
Scotia Wealth Mackenzie Investments Investor Literature
Vibrato Capital Maxam Capital Management Jitneytrade
Measure 8 Venture Partners Linedata
Asset Managers: Montrusco Bolton McMillan LLP
3iQ Corp Morex Capital MLG Blockchain
AGF Investments Morgan Stanley Investment Norton Rose Fulbright
Accelerate Financial Technologies Management Oak Hill Financial
ADI Capital Neighbourhood Holdings Prometa Fund Services
AGF Fund Management Next Edge Capital RBC Investor & Treasury Services
Algonquin Capital Northstar Trading Robert Walters PLC
Alignvest Investment Management Optimum Gestion Keystone Fund Solutions
Alitis Asset Management Palm Drive Capital SGGG Fund Services
Arch Corporation PACE Capital Management Sigma Analysis & Management Inc.
Ardenton Capital Corp. PenderFund Capital Management SS&C CommonWealth Fund Services
Aspect Capital Pilot House Funds Sun Life International Investment
Avenue Living Raiven Capital Centre
Axonic Capital Robson Capital Management The AML Shop
BlackRock Inc. Russell Investments TMX Group
Bridging Capital Sagard Holdings Vidrio FinancialYou can also read