Balder Investor Seminar - 2 July 2021
←
→
Page content transcription
If your browser does not render page correctly, please read the page content below
Balder Investor Seminar
2 July 2021
ABP management team

       William W. Wittusen               Karl Otto Eidem               Erik Evjen

o Position: Co-Founder & CEO   o Position: CFO             o Position: COO
o Experience: 19 years         o Experience: 23 years      o Experience: 22 years

             Prior firms                    Prior firms                 Prior firms

2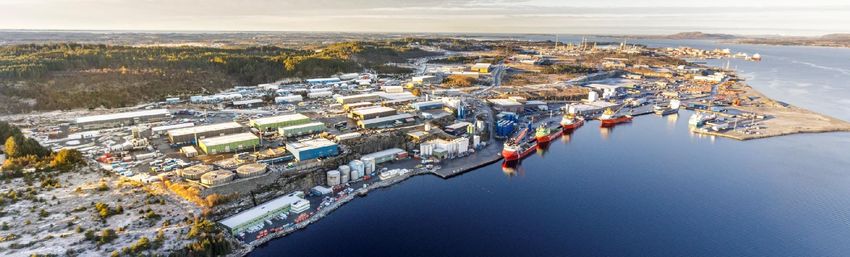
Agenda

    1. Introduction to ABP
    2. The green industrial transition
    3. Norway as a low carbon industry destination

3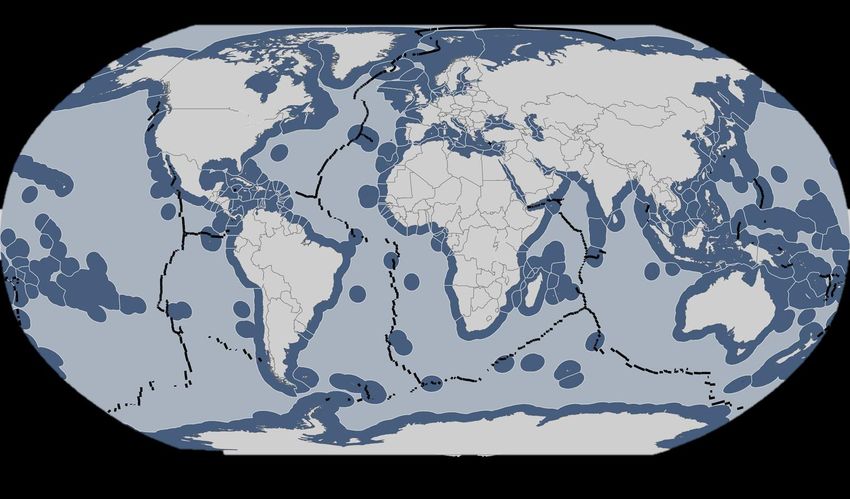
1. Introduction to ABP

4
ABP in brief

                       ABP IS A SPECIALIST REAL ESTATE AND INFRASTRUCTURE OWNER AND DEVELOPER

    • ABP focuses on mission critical real estate and
      infrastructure in leading energy and maritime clusters in
      Norway

    • The company was launched in 2016 targeting investments
      in Norwegian energy infrastructure

    • Since inception, ABP has secured a diversified portfolio of
      attractive infrastructure assets with high barriers to entry

    • ABP’s vision / mission is to be the leading investor and
      developer of energy and maritime real assets, and the
      preferred landlord in our segment

                Norway is a major energy nation in Europe

          “Unique set of natural resources:        “1% of Europe's population,
          self-sufficient on hydropower and        but 20% of hydropower-, 60%
          vast oil and gas resources”              of oil- and 40% of gas
                                                   resources, respectively”

5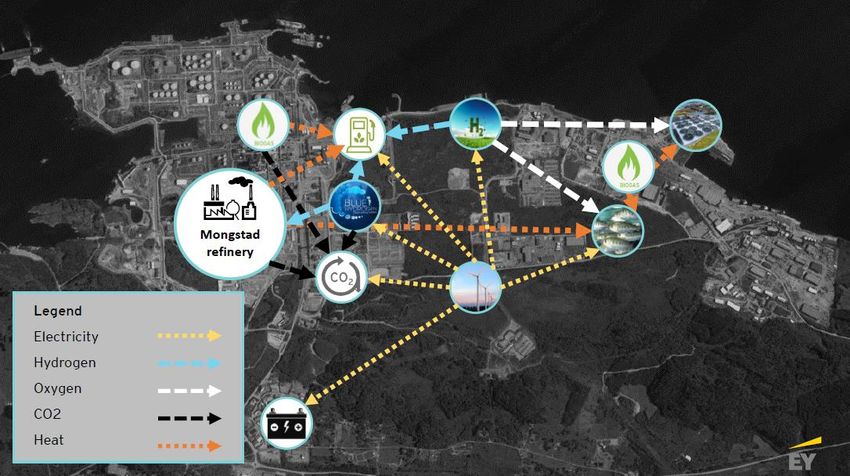
Diversified portfolio of strong counterparties and assets

           PORTFOLIO OF STRONG COUNTERPARTIES(1)                                               DIVERSIFIED PORTFOLIO OF ASSETS (1)

                                                                                                      Infrastructure
                                                                                                    (special products)
              Others                                                                                             7%                   Workshop
                            20%                                                                                                   21%
                                                          24%
                                                                                    Quays and        17%
                                                                                   general infra.
                  3%
                 3%                  GRI                                                                            106
                 4%               NOK ~600m                                                                      properties
                                                                                                                                        17%
                   4%                                                                  Outdoor      15%                                        Storage
                                                            16%
                                                                                       storage
                       5%
                             6%                                                                             8%
                                                     8%                                                                     15%
                                      8%
                                                                                                    Industrial
                                                                                                                            Office
                                                                                                      office

    9.1 years           NOK 6bn              98%                 50% of tenants     265k sqm           1.2m sqm               20%            530k sqm
      WALT              Backlog          Occupancy rate         Investment grade      GLA             Leased land        GLA / land ratio   Dev. potential

6   Note: (1) Breakdown based on run rate GRI 2021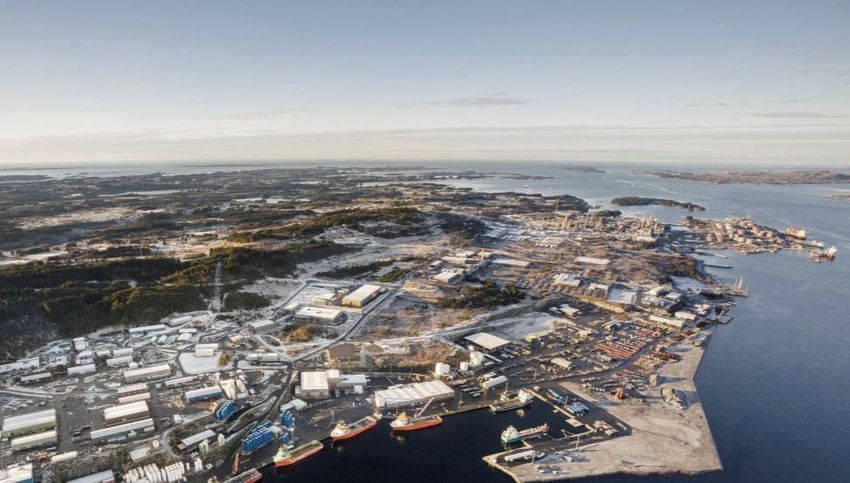
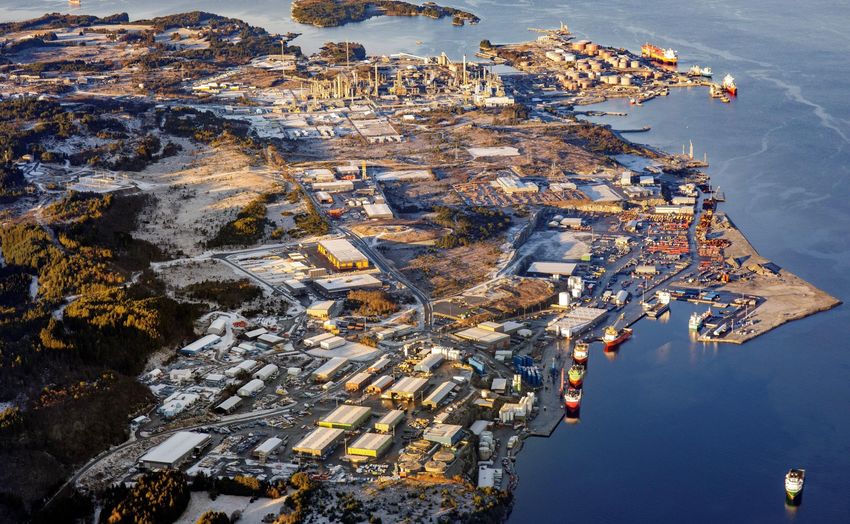
Focus on mission critical energy and maritime clusters

              CLUSTERS ARE STRATEGICALLY LOCATED                     MISSION CRITICAL INFRASTRUCTURE
Legend
                                              Illustrative
    Harbor
    Supply base

                                                             Warehouses     Workshops           Offices         Outdoor
                                                                                                                Storage

                                                                             Bunkering         Crane &
                                                               Quays                                          Power Supply
                                                                              Services         Forklifts

                                                              Clusters are ideally located to capture high onshore
                                                              offshore activity

                                                              Access to existing infrastructure is highly attractive to
                                                              multiple industries

7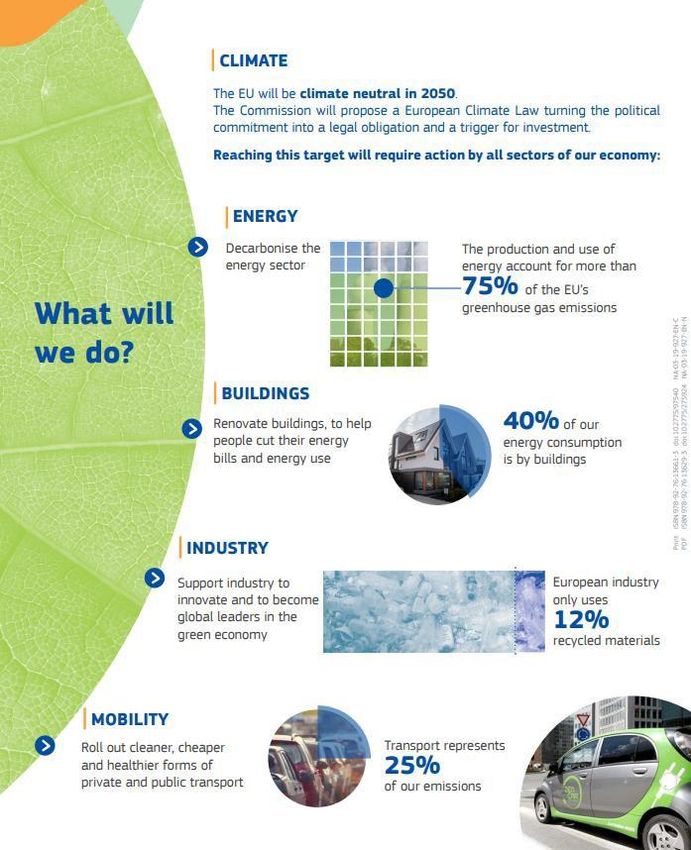
Maritime clusters have been material for value creation in Norway

    NORWAY’S OFFSHORE AREA - AN ATTRACTIVE REGION            STRATEGIC CLUSTERS WITH STRONG HERITAGE

        Offshore
          area                                                                                Conventional fishing
       2,100,000                                                Shipping
         sq. km

                                                                                                  Shipbuilding
                                                                 Energy
                             Onshore
                               area
                             324,000
                              sq. km                                                               Aquaculture
                                                              Offshore wind

                                        > 6x larger than   Clusters boast attractive locations, flexible uses, and
    Vast natural      High quality
                                       Norway’s onshore    cross-sector suitability that has supported maritime
     resources       infrastructure
                                              area                   activity for more than 100 years

8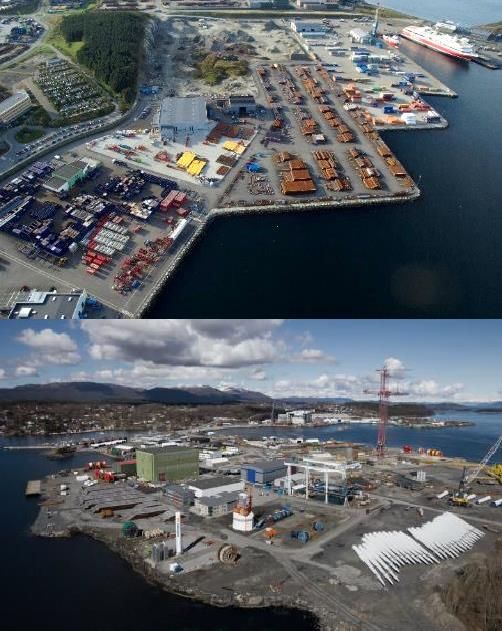
Unique and scalable platform for growth in the Nordic region

                                                                                    Sector diversification

    M&A opportunities in the Nordics
                                                                                          Existing industries
    M&A opportunities in Norway                                                           – Industrial parks
                                                                                          – Land-based aquaculture
    Organic growth within existing business                                               – Industrial sites
                                                                                          – Specialized logistics

                                                                                          Energy & maritime Industries
                                                                                          – Supply bases
                                                                          ABP             – Mission critical logistics
                                               ABP            ABP
                                                                         Longer           – Industrial facilities/warehouses
                                         Current Business   Near Term
                                                                          Term            – Ports/harbors
                                                             Growth
                                                                        Potential
                                                                                          – Regional offices

                                                                                          Enabling the green industrial
                                                                                          transition
                                                                                          – Offshore minerals
                                                                                          – Battery cell value chain
                                                                                          – Offshore wind maintenance
                                                                                          – Green fuels
                                                                                          – CCUS

9
2. The green industrial transition

10
EU Green Deal pushes towards the need for a Green industrial
transition
                                               “…Transform EU into a fair and prosperous society,
                                               with a modern, resource-efficient and competitive
                                               economy where there are no net emissions of
                                               greenhouse gases in 2050 and where economic
                                               growth is decoupled from resource use”

                                     To deliver on the EU Green Deal, the energy sector is
                                   expected to be significantly decarbonized meaning a shift
                                      from oil, gas and coal towards solar, wind and hydro

                                    Circular economy within industries is stated as one of the
                                   key measures to decouple economic growth from resource
                                                              use

11
ABP’s asset base will help facilitate the green industrial transition
ABP’s ESG strategy focus is core to the company’s operations
Facilitate green Promoting green
technology and properties and
circular solutions infrastructure
Adapting to climate
Culture and employee Local value
risk and opportunities
satisfaction creation
in low carbon future
Focus on facilitating energy transition initiatives - enabling decarbonization and realizing circular opportunities at our
premises
12The green industrial transition presents three categories of
opportunities for ABP as a landlord
Accommodating existing
customers’ green
Transformation of existing ABP customers
ambitions
1 Realizing circular
economies
2
Providing land to emerging
3 large scale industries
ABP broadening customer base
13Established energy companies are driving the energy transition
EQUINOR STEPPING UP INVESTMENTS IN RENEWABLES AND LOW CARBON SOLUTIONS TO MORE THAN 50% OF GROSS
ANNUAL INVESTMENTS BY 2030
14 Source: Equinor Capital Markets presentationGreenspot Mongstad initiative to transform Mongstad into a “green
industrial cluster”
PERFECTLY POSITIONED IDENTIFIED OPPORTUNITIES
• Established by key stakeholders at Mongstad Industrial
Park in 2018
• Several opportunities identified supporting a
sustainable industrial development Green hydrogen Blue hydrogen Land-based
prod. prod. aquaculture
• Mongstad perfectly positioned for a role in Norway’s
energy transition
GREENSPOT MONGSTAD KEY STAKEHOLDERS Offshore wind CCUS Land-based
wind generation
Alver
Municipality Sustainable Battery prod. Green fuels
aviation fuel
15New sustainable industries and projects within energy transition
Mongstad Industrial Park
Offshore
wind
Blue
Hydrogen
Green
Hydrogen
Battery
New industries Targeted
Biogas
timeline
CCUS
Onshore
Land-based aquaculture →2025
wind
Onshore wind →2025 SAF Aqua-
Green- culture
house
Green hydrogen →2025 system
Offshore wind →2025
Greenhouse system 2025-30
Offshore
Offshore minerals 2025-30 minerals
Synthetic aviation fuel (SAF) 2025-30
Battery production 2025-30
ABP OWNERSHIP
Blue hydrogen 2025-30 MONGSTAD BASE
Carbon capture / utilization 2025-30
16Mongstad Industrial Park circular economy vision 2030 17
Mongstad with significant potential to realize industrial symbioses
 ABP PLANNING TO BUILD A 2.8KM UTILITY TUNNEL ENABLING CIRCULAR ECONOMY INITIATIVES SUCH AS REUSE OF HEAT
                                        FROM THE MONGSTAD REFINERY

                       Flow chart                                                                 Hydrogen facility
 Material                   From                To

                                             Fish farm,
 Hot process water         Refinery                                                                                   Biogas facility
                                            greenhouse

                        Green hydrogen
 Nitrogen                                     Refinery
                             fac.
                                                                                                                          Land-based
 Biogas                   Biogas fac.         Refinery
                                                                                                                          aquaculture

 Oxygen                  Hydrogen fac.       Fish farm                                                                 SAF          Mongstad
                                                                                            Onshore                   facility     supply base
                                                                                             wind   CCU facility
 Bio waste             Fish farm & other    Biogas & SAF

                                             CCU, SAF,
 CO2                       Refinery                                 Power, water facility         Greenhouse system
                                            Greenhouse

 General utilities /   Power, water fac.,
                                              All users
 renewable energy        wind turbines

 Blue hydrogen             Refinery             SAF

                The tunnel has capacity for future product and energy flows without significant terrain interventions

18
Project Aqua: Production facility of world class sustainable protein with
limited environmental impact
Indicative location
Land-based aquaculture facility (full grow-out)
Preliminary sketches
3x height pools
Utility
tunnel
Refinery
48x grow-out Hatchery
fish tanks and smolt
Feed storage
Trafo
Water-pump and
technical admin
Hydrogen plant
Biogas
6x tanks
slaughtering Inflow and
waste treatment
193. Norway as a low carbon industry destination 20
NORWAY AS A LOW
CARBON INDUSTRY
    DESTINATION
     BALDER INVESTOR SEMINAR
                 JULY 2ND, 2021
       ERIK HOLM REISO, RYSTAD ENERGY
Disclaimer This report has been prepared by Rystad Energy (the “Company”). All materials, content and forms contained in this report are the intellectual property of the Company and may not be copied, reproduced, distributed or displayed without the Company’s permission to do so. The information contained in this document is based on the Company’s global energy databases and tools, public information, industry reports, and other general research and knowledge held by the Company. The Company does not warrant, either expressly or implied, the accuracy, completeness or timeliness of the information contained in this report. The document is subject to revisions. The Company disclaims any responsibility for content error. The Company is not responsible for any actions taken by the “Recipient” or any third-party based on information contained in this document. This presentation may contain “forward-looking information”, including “future oriented financial information” and “financial outlook”, under applicable securities laws (collectively referred to herein as forward-looking statements). Forward-looking statements include, but are not limited to, (i) projected financial performance of the Recipient or other organizations; (ii) the expected development of the Recipient’s or other organizations’ business, projects and joint ventures; (iii) execution of the Recipient’s or other organizations’ vision and growth strategy, including future M&A activity and global growth; (iv) sources and availability of third-party financing for the Recipient’s or other organizations’ projects; (v) completion of the Recipient’s or other organizations’ projects that are currently underway, under development or otherwise under consideration; (vi) renewal of the Recipient’s or other organizations’ current customer, supplier and other material agreements; and (vii) future liquidity, working capital, and capital requirements. Forward-looking statements are provided to allow stakeholders the opportunity to understand the Company’s beliefs and opinions in respect of the future so that they may use such beliefs and opinions as a factor in their assessment, e.g. when evaluating an investment. These statements are not guarantees of future performance and undue reliance should not be placed on them. Such forward-looking statements necessarily involve known and unknown risks and uncertainties, which may cause actual performance and financial results in future periods to differ materially from any projections of future performance or result expressed or implied by such forward-looking statements. All forward-looking statements are subject to a number of uncertainties, risks and other sources of influence, many of which are outside the control of the Company and cannot be predicted with any degree of accuracy. In light of the significant uncertainties inherent in such forward-looking statements made in this presentation, the inclusion of such statements should not be regarded as a representation by the Company or any other person that the forward-looking statements will be achieved. The Company undertakes no obligation to update forward-looking statements if circumstances change, except as required by applicable securities laws. The reader is cautioned not to place undue reliance on forward-looking statements. Under no circumstances shall the Company, or its affiliates, be liable for any indirect, incidental, consequential, special or exemplary damages arising out of or in connection with access to the information contained in this presentation, whether or not the damages were foreseeable and whether or not the Company was advised of the possibility of such damages. © Rystad Energy 2020. All Rights Reserved. 2
Agenda

  Rystad Energy in a nutshell
  Norway as a low carbon industry destination

  3
Rystad Energy

        We are a global, independent energy research and business
        intelligence company, providing data, analytics and advisory
               services to clients exposed to the energy industry.

                                     ÅLESUND
                                                 MOSCOW
                                STAVANGER OSLO
                                ABERDEEN
                                     LONDON
                                                                     BEIJING
                NEW YORK
                                                                               TOKYO
           HOUSTON
                                                 DUBAI
                                                         BANGALORE
                                                              KUALA LUMPUR
                                                                                          Erik Holm Reiso
                                                                SINGAPORE                 Senior Partner &
                                                                                          Global Head of Consulting
                                                                                          Oslo, Norway
                     RIO DE JANEIRO
                                                                      PERTH      SYDNEY

  4
Agenda Rystad Energy in a nutshell Norway as a low carbon industry destination 5
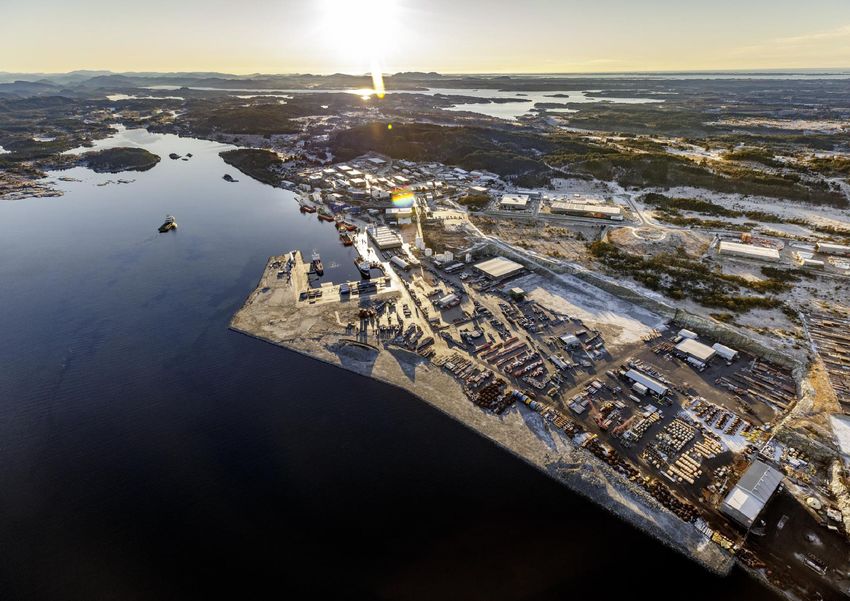
Norway’s land-meets-sea gateways are applicable to a wide set of industries besides oil and gas

                                                                                                                              Example: Aquaculture

                                                                                         •   Aquaculture production is today mainly situated at sea with fish
                                                                                             being slaughtered onshore close by.
                                                                                         •   Future aquafarms are set to be increasingly situated onshore.
                                                                                             Proximity to shore will still be essential as access to seawater
                                                                                             and export routes will be needed.
                                                                                         •   Also, aquafarming at deepsea facilities will require supply
                                                                                             activity and proximity to port infrastructure.

                                   Land
                                                                                                                       Example: Heavy process industry

                                                                                         •   Heavy process industries such as metal or hydrocarbon refining
                                                                                             depends on export routes for the massive volumes of goods
                                                                                             produced.
   ABP sites                                                                             •   Similarly, easy access to imported raw materials is a
                                                                                             competitive advantage.
                                                                                         •   Furthermore, access to cooling water, etc., drives facilities to be
                                                                                             located next to the sea
                                                  Industries
                                   ABP           relying on a   Established industries
                                properties       land-meets-
                                                                New industries
                                                 sea gateway
                                                                                                                      Example: Battery cell manufacturing

                                                                                         •   Set to become a booming industry in Norway (across all stages
                                                                                             of the value chain) given favorable manufacturing conditions
                                                                                             and strong market fundamentals
                                                                                         •   Access to raw material imports and export routes important
                                                                                             given the magnitude of volumes circulated.

                                    Sea                                                                              Example: Offshore mineral extraction

                                                                                         •   An emerging industry in Norway given the prospect of large
                                                                                             mineral deposits along the seabed.
                                                                                         •   Minerals to be transported onshore in a slurry (mix of water and
                                                                                             gravel).
                                                                                         •   Processing onshore will require receival terminals and
                                                                                             processing facilities along the coast.

   Source: Rystad Energy research and analysis

   6
The Green industrial transition gives rise to industries within energy transition and sustainability
Green industrial transition trends
affecting global and Norwegian
industry
Industrial trends related to Industrial trends related to
Energy Transition Increased Sentiment Toward Sustainability
Power generation Energy storage Low eco-footprint industries
Sources of power that do not emit CO2 are Renewable power sources are by nature Calls for a more environmentally sustainable
set to have an increasing role in the global more volatile than fossil; storage must be industry is trickling down to encompass local
power mix as governments target the Paris provided to ensure consistency when there is effects. Industrial practices leaving a smaller
Agreement goals. no wind, sun, waves, etc. environmental footprint are sought after.
Relevant industries: Relevant industries: Relevant industries:
Onshore wind Offshore wind Battery cell Green fuel Blue fuel Onshore
power power manufacturing production* production* aquaculture
Enabling materials Emissions storage
The onset of the energy transition will require Certain industries, like cement production,
emit greenhouse gases as a byproduct of the
Circular economy thinking
significant expansion into the extraction and
refinement of, among others, copper, zinc, manufacturing process, hence storage is the
cobalt and rare earth minerals. only option for achieving zero emissions. • Circular economy is a principle of economic thinking aimed at
maintaining the value of products, materials and resources for as
Relevant industries: Relevant industries:
long as possible by utilizing and reusing the resources more
efficiently.
• A simple example of a circular economy would be the production of
valuable products from what is currently considered waste or by-
Offshore minerals Material refinement & Carbon capture, utilization and products.
mining processing storage (CCUS)
*Green fuels are made with renewable power and electrolysis; blue fuels are made with fossil fuels as feedstock where the resulting emissions are subject to CCUS
Source: Rystad Energy research and analysis
7Energy transition represents large industrial potential in Norway, some segments set to emerge
at large scale than others
Energy Relevant industry for Norwegian industry
Global demand certainty Norwegian scale potential
transition role the Norwegian market maturity
Prospective
Blue fuels Incubation Prospective Export is key issue as existing natural gas pipeline
A few car manufacturers still attempting to systems are either occupied or not designed to
commercialize technology. Technology still to be handle corrosive hydrogen. Ship transport as an
proven in freight or ferry transport. As of now the alternative leads to local production and
Energy Green fuels Incubation
most viable low footprint energy storage consumption being more viable near term. Still, has
mechanism when grid battery capacity is spent. great support from important regulatory and
storage corporate stakeholders
High High
Batteries Maturing Favorable power prices for energy intensive
Medium term global supply shortage seen due to
manufacturing process. Three large scale projects
exponential EV growth.
communicated for mid-2020s startup.
High High
Material processing Mature Demand for materials used in windmills, solar
Long industrial tradition with inherent competitive
panels, batteries, etc., to be pulled by energy
advantage from cheap power.
Enabling transition.
materials High
Minerals such as copper, cobalt, zinc and rare
High
Offshore mining Incubation Norway with proven deposits on seabed and
earth minerals are critical components in batteries,
industrial know-how to extract them.
windmills and anything electric in general.
High Prospective
Onshore wind Mature Subject to political tension. Exports to compete with
Wind power, along with solar, to become defining
local power demand. Still, cost levels are on par
renewable power source.
Power with hydro (albeit without storage).
generation High Prospective
Offshore wind Incubation Technology yet to be proven in terms of cost Poor cost efficiency compared to onshore counterpart
efficiency in deep waters. Bottom-fixed more or hydropower. Still, addresses main criticisms
proven than floating. towards onshore wind as mills are “out of sight”.
High Prospective
Emissions Norway far from large emissions sources in
CCUS Incubation Numerous countries will rely on carbon capture to
storage achieve climate goals
Continental Europe and Great Britain yet might
benefit from early mover advantage.
Source: Rystad energy research and analysis
8Solid foundation for a future minerals-to-battery value chain in Norway
Energy Relevant industry for Norwagian industry
Global demand certainty Norwegian scale potential
transition role the Norwegian market maturity
The value chain for batteries
Extraction of raw minerals Chemical processing Cell production Prospective
Blue fuels Incubation Prospective Transportation is key issue as existing pipeline
Few car manufacturers still attempting to systems are either occupied or not designed to
commercialize technology. Technology still to be handle corrosive hydrogen. Ship transport as an
proven in freight or ferry transport. As of now the alternative leads to local production and
Energy Green fuels Incubation
most viable low footprint storage mechanism when consumption being more viable near term. Still, has
battery capacity is spent. great support from important regulatory and
storage corporate stakeholders
High High
Batteries Maturing Favorable power prices for energy intensive
Medium term global supply shortage seen due to
manufacturing process. Three large scale projects
exponential EV growth.
communicated for mid-2020s startup.
High High
Material processing Mature Demand for materials used in windmills, solar
Long industrial tradition with inherent competitive
panels, batteries, etc., to be pulled by energy
advantage from cheap power.
Enabling transition.
materials High
Minerals such as copper, cobalt, zinc and rare
High
Offshore mining Incubation Norway with proven deposits on seabed and
earth minerals are critical components in batteries,
industrial know-how to extract them.
windmills and anything electric in general.
High Prospective
Value chain dynamic for Subject to political tension. Exported power must
Onshore
Batteries, Material Mature
wind and Offshore Mining
Processing all have Wind
Norwegian power, along with solar, to become defining
producers: compete with local power. Still, cost levels are on
a «High» and «High» combo of global demand certainty and renewable power source.
Power par with hydro (albeit without storage)
Norwegian scalability.
generation Import
Prospective Prospective
While they all have large wind
Offshore Incubation
industrial potential independent Technology yet to be proven
Raw materials Chem. in terms of cost
processing Poor
Cell cost efficiency compared
production to onshore
Battery packing counterpart
Export
efficiency in deep waters. Bottom-fixed more or hydropower yet addresses largest criticisms
of each other, they are also part of the same value chain, proven than floating. towards onshore wind by being out of sight.
manufacturing of batteries as an end product. Domestic
supply
High Prospective
Emissions Norway far from large emissions sources in
CCUS Incubation Numerous countries rely on carbon capture to
storage achieve climate goals
BeNeLux and Great Britain yet might benefit from
early mover advantage
Source: Rystad energy research and analysis
9Global market backdrop:
The hedge – long term oil consumption decline due to exponential rise in battery demand
Vehicle manufacturers’ targets for EV sales Oil demand forecast from road transport
Million cars sold per year Million barrels per day Road transport
100
50
80 78
40
66
Other*
Long term oil demand
60
decline is driven by
55 precisely the same
30
trend as battery
46
demand increase.
40 38
20
31
24
20 18
10
14
8
3 3
1 2
1
0 0
2016 2018 2020 2022 2024 2026 2028 2030 2020 2025 2030 2035 2040
Source: Rystad Energy research and analysis
10Global market backdrop:
Battery market set for significant undersupply
Annual global demand for new batteries
TWh
Actual battery output*
4
3
Market set to be severely
undersupplied by late 2020s bar
2 new manufacturing capacity.
1
Long lead times for battery cell
production means non-
communicated capacity is not
set to appear «over night»
0
2020 ~4 years 2025 2030
Avg. lead time of new capacity looking at 10 recent development
*Due to bottlenecks in value chain, ramp-up period, announced capacity is applied at year end, and challenges with battery cell performance, actual output is typically to 60% of announced capacity
Source: Rystad Energy research and analysis
11Global market backdrop:
Metals demand to increase in general as the world aims to attain climate targets Minerals
Indicative 2020 to 2050 metals demand growth by climate change scenario*
2050 metals demand indexed to 2020 2050 metals demand** (indexed to 2020) is
displayed to the left by three commonly
communicated climate change targets. A
Incr. metals demand
2.7°, 2.0° and 1.75° average global
temperature increase by 2100 are
represented by IEA’s Reference
Technology Scenario***, 2-degree and
CAGR Beyond 2-degree scenarios.
’20-’50:
CAGR +5.4 Growth in global metals demand from 2020
‘20-’50: to 2050 range from a multiplication factor of
+4.5% 2.1 (the 2.7° scenario) to 4.2 (the 1.75°
scenario), while the annual growth rate over
the next 30 years (CAGR) vary from +3% to
+5%. As a comparison, global copper
CAGR
production increased by a factor of 2.2 from
’20-’50: 1990 to 2020, similar to the 2.7° scenario’s
+3% growth to 2050.
4.2
X 4.2 A low-carbon future will regardless of
3.8
X 3.8 realized climate change target (outlined by
the Paris Agreement) lead to an extensive
growth in metals demand as green
2.1
X 2.1 technologies are more material intensive
than fossil-fueled electricity generation. The
stricter the climate change target, the higher
the implementation of clean energy
technologies which require more metals.
2.7° scenario 2.0° scenario 1.75° scenario Sufficient minerals supply will be pivotal for
the energy transition and hence reaching
any of the outlined climate goals.
More ambitious climate scenarios
*Climate change scenarios in line with IEA Energy Technology Perspectives Scenarios.
**Metals demand based on 17 of the core clean energy technology metals and elements, plus steel. Figures from The World Bank
***Assumes all countries implement their determined contributions outlined by the Paris Agreement, resulting in an avg. global temperature increase of 2.7° by 2100.
Source: Rystad Energy research and analysis; International Energy Agency (IEA); World Bank
12Norway's largest near-term energy transition projects are battery related
Communicated* billion NOK class energy transition projects in Norway with startup by 2025
a
b **
c
d
e
f
g
****
h
i
j ***
k
Onshore Offshore Battery cell Green fuel Blue fuel Material CCUS l
wind power wind power manufacturi production production refinement &
ng processing
m
*Projects have not necessarily had investment sanctioned. **Assumes same investment as Freyr Battery; ***Assumes 10 windmills to be built at 350 MNOK each. ****Pilot project startup
Source: Rystad Energy research and analysis
13Minerals-to-battery: A set of competitive advantages indicates why Norway is chosen as
destination
Clear signs of natural resource available
both offshore and onshore at Helleland in
Rogaland
Oil and gas cost cuts yield “in the money” Power intensive process, clear cost Power intensive process, clear cost Competitive advantage due to state-of-the-
extraction of marine minerals. No need for advantage observed through low priced advantage observed through low priced art automated packing systems.
subsidies renewable energy to remain in place renewable energy to remain in place
Oil and gas knowledge gives clear advantage Other industry knowledge is viewed as Lack of specific competence on cell Knowledge about the maritime industry has
when extracting minerals offshore as similar applicable. Access to «blue collar» workforce production, however Panasonic led to advantage when compiling battery
competence and technology is used is present, specific knowledge is needed considering entering the Norwegian market packs for the shipping industry
Significant advantage due to renewable Significant advantage due to renewable Significant advantage due to renewable Advantage represented through
energy, HSE requirements for offshore energy, workforce HSE requirements, stable energy, workforce HSE requirements, stable governmental support, workforce HSE
projects, stable economic conditions economic conditions economic conditions requirements, stable economic conditions
Source: Rystad Energy research and analysis
14Chemical processing and cell production value chain elements are power intensive
Cost Break Down Battery Value Chain – Global 2020 Average
Extraction of raw Chemical processing Cell Battery pack
minerals production manufacturing
Total cost
$/kWh $/kWh $/kWh $/kWh 145 $/kWh
Other
(maintenance,
SG&A)
Non-active
materials
(casing, wiring,
electronics)
Labor
Energy cost
Plant/machinery
investments
US wholesale electricity prices assumed
Source: Rystad Energy research and analysis
15Power prices expected to increase towards 2050 – Norway to retain competitive advantage
Power price forecasts for selected geographies, full year averages*
EUR/MWh
45
43
41 40
39
38 Germany
37
36
34 34
33
31 31 Southern Sweden
29
28
27
Southern Norway
Northern Norway
2020* 2030 2040 2050
*Details of Norwegian supply/demand balance outlooks given in Appendix
Source: Rystad Energy research and analysis; Statnett
16Norway with high share of economic rights to spreading ridges where massive sulfides reside
Global active spreading ridge formations
Spreading ridge International waters Exclusive Economic Zones (EEZs)
Sulfides emerge among the earths
spreading ridges, in the border
between tectonic plates.
Norway The map to the left indicates global
active spreading ridges by national
and international ownership, while the
Portugal
lower bar displays ownership of the
ridges in exclusive economic zones
for top countries.
Norway holds as much as 5.5% of the
world’s active spreading ridges, with
Fiji
only Fiji having resource rights to
more (8%). In addition, Norway holds
the largest area when considering
only countries with a well-established
oil and gas industry.
Global spreading ridge in EEZs by 2020 national ownership
% Northern Mariana
Norway Islands Ecuador
8% 5.5% 5.4% 5.1% 5% 4.6%4.4% 62%
Fiji Portugal British Indian Mexico Other Exclusive Economic Zones
Ocean Territory
Source: Rystad Energy research and analysis
17NCS mineral exploration reveals copper, cobalt, zinc, manganese and REE deposits
Seabed minerals on Norwegian
ridges contains elements that
will be essential in energy
transition and digitalization
Significant resources on Norwegian Ridges
Sulphides primarily contain lead, zinc, copper, gold
and silver, and are linked to hot springs in volcanic
spreading ridges beneath the oceans where black
smokers form. These vents continue to spew out hot
material for several thousand years before dying out
and leaving behind sulphide mounds which contain
the bulk of the sulphide ore resources
Resource report 2020, Exploration
Manganese crusts also consist largely of manganese
and iron, plus small quantities of titanium, cobalt,
“The Norwegian Petroleum nickel, cerium, zirconium and REEs. They grow as
Directorate showed even more laminated deposits on bare bedrock exposed at the
promising results from their field trip seabed, typically in water depths of 800-2500 metres.
than we had expected.”
CEO,
Loke Marine Minerals
RRE = Rare Earth Elements
Source: Rystad Energy research and analysis; Norwegian Petroleum Directorate (NPD)
18Norwegian Government plans first round of licensing for marine minerals mining in 2023
The history and potential future of Norwegian marine mineral production
Awaiting the results of the ongoing impact study of marine mineral production on the NCS, private companies and partner organizations are
preparing for what could be the next Norwegian offshore adventure. The timeline below depicts what such a potential industry development could
look like.
Due to the accumulated offshore expertise from the oil and gas sector, Norway is well positioned for a rapid deployment of seismic and geological
exploration on the NCS. Additionally, Norwegian competence within the offshore service industry could become critical in developing a
professional and efficient industry to address the growing mineral demand driven by the energy transition and digitalization processes unfolding
across the globe.
Key historical events Potential future development
2005 2018-20 2020 2023 ~2030-35
First hydrothermal sulfide NPD discovers massive NPD concludes on First round of licensing. First project in
finding on the southern sulfides using AUVs and promising rock samples. (Announced by commercial production
part of the Mohns Ridge ROVs Initiated further studies Norwegian Ministry of
Petroleum and
Energy)
2010 2019 2021 2025 ~2050
UiB and NPD commence a Seabed Minerals Act The Government has Commercial exploration An estimated 10 projects
multiyear exploration established in Norway decided to initiate an triggering development in production
campaign, also discovering building on oil and gas opening process of
crusts legislation minerals activities on
the NCS in
accordance with the
Seabed Minerals Act
Source: Rystad Energy research and analysis; Norwegian Petroleum Directorate (NPD)
19Marine minerals will not require subsidies as cost levels are significantly below price already
Current cost versus price for offshore wind and mineral mining alternatives
The current stand-alone profitability of offshore industry alternatives to oil and gas still depicts substantial costs for offshore wind power, especially for floating
facilities. Hence, the offshore wind industry will require substantial subsidies going forward until costs gradually come down as the technology and industry
matures. At the far right below, the case for current marine mineral estimates is quite different. Supported by the mature competence and technology from
the oil and gas industry, marine minerals could become a significant income source for Norway with under the current production concept.
Offshore wind* – bottom fixed1) Offshore wind* – floating2) Marine minerals**
USD/MWh USD/MWh USD/kg CuEq
160 160 10
9
140 140
8
120 120
7
100 100 6
80 80 5
4
60 60
3
40 40 Incl.
2 processing
20 20 onshore
1
- - -
Cost 2030 cost Price Cost 2030 cost Price Cost Price
estimate estimate
Line depicting base case scenario
* Price calculated as average of selected largest European markets in 2019 including upside range to capture variations. 1) Cost calculated as average of multiple projects in 2019. 2) Aker Offshore
Wind rough estimates 2020.;** Represents full cycle unit cost including processing marine minerals. Source: Rystad Energy research and analysis; Aker Offshore Wind
20Properties currently serving as supply bases ideal reception terminals for marine minerals
Minerals
Important features of a marine minerals reception terminal
Infrastructure features ABP presence at supply base or port
«Overall, quality infrastructure has to Port / harbor
be in place to receive marine minerals.
Barents sea
There are a few of features which are Unique supply Supply base
especially attractive: base capability?
«...A well functioning port»
«...Waste management
capabilities»
«...Abundant green energy»
«...Abundant available space»
CEO,
Loke Marine Minerals
Norwegian sea
Distance
Trondheim
«Distance is in not
a dealbreaker in
terms of choosing
receiving terminal, Doubling the distance means doubling
although longer the number of tankers shuttling to and Bergen Oslo
from extraction site to maintain same
distance will result refining rate onshore
in higher capex due
to need for more
tankers» North
CEO,
2x tankers sea
Loke Marine Minerals needed
*MM = Marine Minerals
Source: Rystad Energy research and analysis
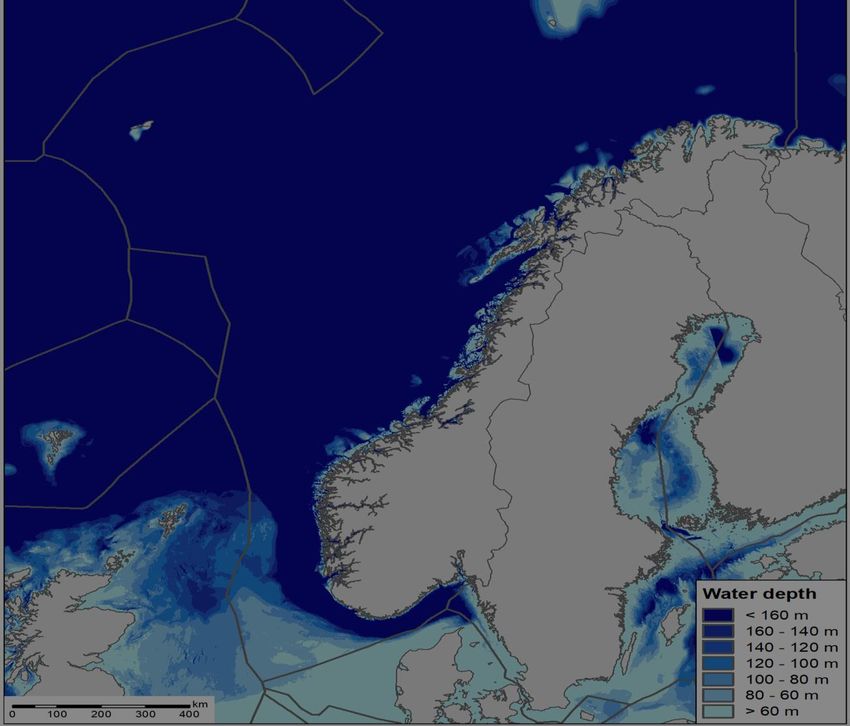
21Deep Norwegian waters makes development of low-cost floating windmills crucial for large
scale deployment Offshore wind
power
NCS water depth map
Geographical location of areas recommended for offshore wind activity
Water depth
0m
Bottom-fixed only
Bottom fixed
Bottom-fixed and floating
60m
Floating only
Sandskallen – Sørøya nord Floating
Deemed viable for
concession rounds in terms Vannøya nordøst • Today, bottom-fixed offshore wind cannot
of technical and social be installed at depths greater than ~60 m.
Auvær • Sea depth and complicated seabed
feasibility
conditions make the cost of building
bottom-fixed offshore wind in Norway
greater than the average cost in Europe
today. Depth contributes the most to the
increased cost.
Trænafjorden - Selvær
Træna vest • NVE, The Norwegian Water Resources and Energy Directorate, is a
Norwegian government agency responsible for the country's water resources
Nordøyan – Ytre Vikna and energy supply.
Frøyabanken
• In 2013, NVE identified five areas being technically and economically
suitable for offshore wind with relatively few conflicts of interest. The areas
Stadthavet could also be easily connected to power networks without major challenges
by 2025.
Olderveggen
Frøyagrunnene • The remaining areas have challenges related to either technical aspects
and/or area interests. However, the challenges may be solved by future
technology development and/or mitigating measures.
Utsira nord 2018: NVE recommends to open Utsira nord and
Sørlige Nordsjø I or II for renewable energy
Sørlige Nordsjø I production at sea.
2020: The government opens Utsira nord and
Sørlige Nordsjø II for offshore wind production.
Sørlige Nordsjø II 2021: From 1 January 2021 companies can apply
to obtain a license for development and
construction of offshore wind power projects at
Utsira Nord and Sørlige Nordsjø II.
Source: Rystad Energy research and analysis; NVE (Norwegian power generation regulator)
22Hydrogen with strong support from key regulatory and corporate stakeholders
Green/Blue fuel
production
Regulatory stakeholders Corporate stakeholders
Corporate stakeholders
• The Green Transition Package presented by the government in June 2020 held Large Norwegian companies like Equinor and Yara have outspoken strategies
NOK 3.6 billion in grants with hydrogen being one of the largest benefactors. revolving around hydrogen being a key contributior to sustainable development of
• The government has an outspoken strategy for the usage of hydrogen in energy.
industry and parts of the transportation sector, especially maritime and heavy
road freight.
• Equinor participates in several significant hydrogen projects in Europe. Equinor
• From 2024, the government has mandated hydrogen in operation on all ferries in aims to show how hydrogen can provide scalable and profitable growth
Vestfjorden, Norway's longest ferry connection. opportunities in the future.
• In Norway, Equinor has joined forces with BKK and Air Liquide on the world's
“Hydrogen offers exciting opportunities for Norway, both as an energy nation and first liquid hydrogen plant for maritime use in the Mongstad Area
a technology nation.”
Prime minister Erna Solberg
• Yara is ready to enable the hydrogen economy with an historic full-scale green
ammonia project. Yara will produce green hydrogen to replace natural gas in
Norwegian
ammonia production.
government
“I would say this project is important both for Yara and for Norway, when
it comes to taking a leading role in hydrogen.”
Yara CEO Svein Tore
Holsether
Top 5 Norwegian companies by revenue
EU Billion NOK
566
150
114 114 107
• Dec 2020, the European Commission presented the European Green Deal
outlining the main policy initiatives for reaching net-zero global warming emissions
by 2050.
• Hydrogen will be a key instrument for meeting the Green Deal objectives and is
identified as one of four key technologies.
Equinor Norsk Hydro Yara Telenor KLP
Source: Rystad Energy research and analysis
23Early mover advantage and future pipeline development may make Norway a preferred
large scale carbon storage destination Carbon capture, utilization and
storage (CCUS)
Known full scale CCS projects Transportation cost of captured carbon by pipeline
Cost per unit of CO2 at different distances of total transportation
Snøhvit CO2
Developed (no 3rd parties)
Under development
Planning process
Northern Lights
Acorn Sleipner CO2
Net Zero Teesside
Greensand
HyNet NorthWest
Zero Carbon Humber
Athos
Kinsale Porthos
Ravenna Low volumes
Medium volumes
High volumes
Distance
Norway is an early mover, being the first European country expected to launch a full-
scale CCS project receiving CO2 from third parties.
The chart shows how transportation costs for a unit of CO2 by pipeline are highly
Northern Lights is the only offshore storage project where FID is already taken – this dependent on both distance and quantum transported.
could provide Norway with a lasting early mover benefit e.g. due to economies of Northern Lights is engaging in active market development, aiming to secure large
scale. quantities of CO2 for future development projects in order to pull down unit cost,
making Norway more competitive.
The Northern Lights team has ambitious growth plans, picturing Northern Lights as a
European CCS hub. Several potential clients have already signed MoUs.
Source: Rystad Energy research and analysis; Paper: “Ship transport – A low cost and low risk CO2 transport option in the Nordic countries”
24Agenda Rystad Energy in a nutshell Norway as a low carbon industry destination Appendix 25
Rystad Energy consulting clients and topics

                                                                                                                                    Governments/
                         E&P                   Energy Service            Energy transition                  Investors
                                                                                                                                     Associations

               • Majors                   • Large international     • Renewable energy /         •   Investment funds         • Governments
               • NOCs                       service companies         energy storage             •   Private Equity           • International
               • Integrated and           • Rig and vessel owners                                •
CLIENTS

                                                                      operators and suppliers        Venture                    associations and
                 Independents             • Oil service companies   • Value chain companies      •   Investment banks           institutions
               • Smaller E&Ps             • Equipment providers     • Energy intensive           •   Financial institutions   • Industry associations
               • Energy companies /       • Niche tech companies      industry
                 Utilities

               • Global oil and gas       • Global E&P spending     • Energy transition          • Oil and gas advisory       • Petroleum province
                 macro                      and driver analysis       advisory                   • E&P and oil service          assessment and
               • Corporate strategy and   • Company strategy and    • Energy mix                   deal screening               benchmarking
TOPICS

                 benchmarking               market assessment       • New/alternative energy     • Commercial DD              • E&P and oil service
               • Value creation in E&P    • Competitor analysis       development / volumes        support, buy/sell side       player analysis
               • Exploration strategy     • Products and services     and cost (offshore wind,   • VDD reports                • Tax regime and
               • E&P                        strategy                  solar, batteries,          • Post-investment and          regulations
                 valuation/transaction    • Oil service DD/           hydrogen, etc.)Global        Exit support               • Cost level analysis
                 support                    transaction support       crude oil and products                                  • Future production
               • GHG emissions                                        flow                                                      forecasts

          26
You can also read


