Gate 3 Constraint Report for Area X - Levels of Curtailment and Transmission Constraint for Generation in Area X 2011 2022 - CRU Ireland
←
→
Page content transcription
If your browser does not render page correctly, please read the page content below
Gate 3 Constraint Report for Area X

Levels of Curtailment and Transmission Constraint
             for Generation in Area X
                   2011 - 2022

Baseline Version Draft 0.9   Published March 2010
Baseline version draft 0.9             Gate 3 Constraint Report                                   Area X

DISCLAIMER
EirGrid plc, the Transmission System Operator (TSO) for Ireland, has prepared this report in
furtherance of its commitment to provide estimates of the likely level of constraints that will occur on
the transmission system as it is required to do pursuant to Commission for Energy Regulation
Direction CER/08/260 “Criteria for Gate 3 Renewable Generator Offers & Related Matters”. The
purpose of this report is to provide information as to the underlying methods and tools used, and to
provide information to recipients about the process and the estimated levels of constraint. Whilst
every effort is made to provide information that is useful, and care is taken in the preparation of the
information, EirGrid plc gives no warranties or representations, express or implied, of any kind with
respect of this document, including, without limitation, its quality, accuracy and completeness. EirGrid
plc hereby excludes, to the fullest extent permitted by law, all and any liability for any loss or damage
arising from the use of this document or any reliance on the information it contains. Use of this
document and the information it contains is at the user’s sole risk.

COPYRIGHT NOTICE
All rights reserved. This entire publication is subject to the laws of copyright. This publication may not
be reproduced or transmitted in any form or by any means, electronic or manual, including
photocopying without the prior written permission of EirGrid.

© EirGrid Plc 2010

EirGrid                                          Page 2 of 53                                                18/03/2010

Baseline version draft 0.9       Gate 3 Constraint Report   Area X

                             [Intentionally Left Blank]

EirGrid                                   Page 3 of 53               18/03/2010
Baseline version draft 0.9                             Gate 3 Constraint Report                                                          Area X

                                                   Table of Contents
1  INTRODUCTION ..............................................................................................................................5
 1.1    Overview of Area X ................................................................................................................. 5
 1.2    Curtailment and Constraint ..................................................................................................... 6
 1.3    ‘Physical’ Modelling versus Market Modelling ........................................................................ 7
 1.4    Scenarios ................................................................................................................................ 7
 1.5    Key Risks affecting the Results .............................................................................................. 9
 1.6    Structure of the Report ......................................................................................................... 10
2 RESULTS ...................................................................................................................................... 11
 2.1    Node XXXX Results .............................................................................................................. 12
 2.2    Node YYYY Results .............................................................................................................. 16
APPENDIX A: MODELLING METHODOLOGY ............................................................................... 20
 A.1    Introduction ........................................................................................................................... 20
 A.2    Production Cost Modelling .................................................................................................... 20
 A.3    PROMOD IV ......................................................................................................................... 21
 A.4    All-Island Model .................................................................................................................... 21
 A.5    Dispatch Assumptions .......................................................................................................... 22
 A.6    Determination of Curtailment and Constraint ....................................................................... 22
   A.6.1 Allocation of Curtailment ................................................................................................... 23
   A.6.2 Allocation of Constraint ..................................................................................................... 24
 A.7    Range of Scenarios Assessed ............................................................................................. 24
APPENDIX B: INPUT ASSUMPTIONS ............................................................................................ 25
 B.1    Introduction ........................................................................................................................... 25
 B.2    Wind Modelling ..................................................................................................................... 25
   B.2.1 Wind Forecasting .............................................................................................................. 28
   B.2.2 Northern Ireland Wind Modelling ...................................................................................... 28
 B.3    Demand Assumptions........................................................................................................... 29
   B.3.1 Peak Demand and Energy Forecast ................................................................................ 29
   B.3.2 Demand Profile ................................................................................................................. 30
   B.3.3 Load Distribution ............................................................................................................... 30
 B.4    Generation Portfolio .............................................................................................................. 30
   B.4.1 Conventional Generator Characteristics ........................................................................... 30
   B.4.2 RoI Conventional Generator Retirements ........................................................................ 31
   B.4.3 NI Conventional Generation ............................................................................................. 31
   B.4.4 Pumped Storage Modelling .............................................................................................. 31
   B.4.5 Non-Wind Small-Scale Generation and Non-GPA Generation ........................................ 32
 B.5    Shallow Connections ............................................................................................................ 33
 B.6    Fuel and Carbon Prices ........................................................................................................ 35
 B.7    Operational Rules ................................................................................................................. 36
 B.8    Interconnection ..................................................................................................................... 38
   B.8.1 Overview ........................................................................................................................... 38
   B.8.2 North-South Interconnection Assumptions ....................................................................... 38
   B.8.3 Great Britain Interconnection Assumptions ...................................................................... 38
 B.9    Transmission Network .......................................................................................................... 39
APPENDIX C: TRANSMISSION REINFORCEMENTS ................................................................... 40
APPENDIX D: SHALLOW CONNECTION DATES .......................................................................... 45

EirGrid                                                              Page 4 of 53                                                                      18/03/2010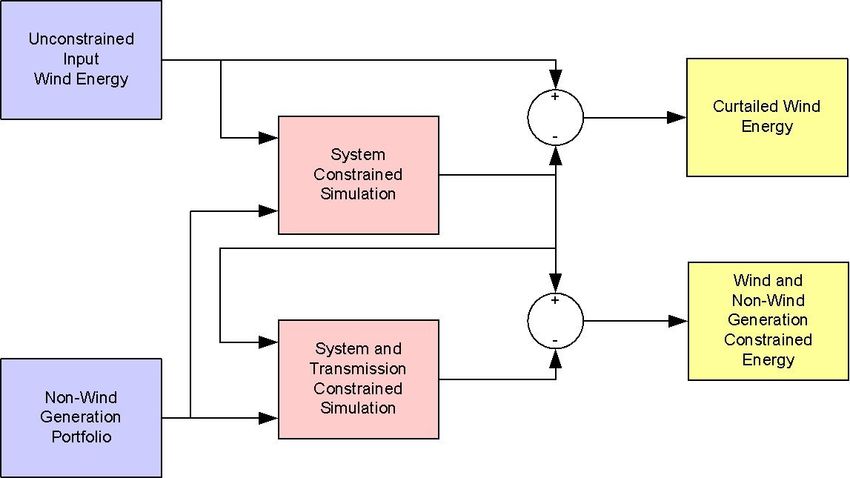
Baseline version draft 0.9            Gate 3 Constraint Report                                  Area X

1 INTRODUCTION
This report presents the results of studies, conducted as part of the Gate 3 connection
process, to assess the levels of curtailment and transmission constraint that Gate 3
customers in Area X might expect to experience in the period from 2011 through 2022. As
there are always uncertainties in future forecasts, and to provide more information to
connection applicants, a range of scenarios have been studied and the results of these
studies are presented in this report for Area X.

This report delivers on Commission for Energy Regulation Direction CER/08/260 ‘Criteria for
Gate 3 Renewable Generator Offers & Related Matters’ section 5.25:

   “Similar to previous Gates, in addition to the connection offers issued, the TSO will issue
   estimates, generally with the offers, of the likely incidence of constraining off of the recipient’s
   generation output from the date of commissioning of the generator until all necessary
   transmission reinforcement works are expected to be completed.”

1.1 Overview of Area X
To facilitate power system planning studies and the issuing of connection offers, the
transmission nodes to which Gate 3 generators were assigned were grouped into Gate 3
Areas based on their location. Area X, which is the focus of this report, comprises
transmission nodes in the vicinity of County XXXXX in the south of the country. A map
showing the location of Area X as well as other nearby Gate 3 Areas is shown in Figure 1.1.

                                       Map of Area X here

Figure 1.1: Map of the southern part of the Republic of Ireland showing the location of Area
X and other nearby Gate 3 Areas.

All of the Gate 3 generators assigned to nodes in Area X are wind generators. Table 1.1
details the Gate 3 wind generators, XXXX in total, assigned to nodes in Area X as well as
the first study year for which they were included in the constraints model. There are also

EirGrid                                         Page 5 of 53                                              18/03/2010
Baseline version draft 0.9          Gate 3 Constraint Report                              Area X

XXXX other pre-Gate 3 wind generators which have either already connected in Area X or
have accepted connection offers to do so. These are also detailed in Table 1.1. No
conventional generators are currently connected or have accepted connection offers to
connect in Area X. In this report, curtailment and constraint levels are presented for all of the
wind generators detailed in Table 1.1, not just the Gate 3 generators.

                             Maximum                                                  Year
                              Export                           Transmission        included in
   Wind Generator                                Gate
                             Capacity                              Node            Constraints
                               (MW)                                                   Model

              Table 1.1: Gate 3, Gate 2 and pre-Gate 2 wind generation in Area X.

1.2 Curtailment and Constraint
The terms ‘curtailment’ and ‘constraint’ are sometimes used interchangeably to refer to
changes in the output of generators in order to maintain the operation of a safe, secure and
reliable power system. However, for the purposes of this report, these terms are used to
refer to changes in generator output under different specific circumstances.

EirGrid must dispatch generators in such as way as to provide a range of system services in
order to operate a safe and secure electricity system. The types of system services required
include the following:

          •     Frequency control,
          •     Provision of reserve,
          •     Voltage control,
          •     Load following,
          •     Ability to withstand disturbances,
          •     Inertia.

This means that EirGrid must deviate from the most economic dispatch and change the
output of generators in order to ensure that sufficient quantities of the system services
outlined above are made available at all times. Most of these system services, such as
frequency control and reserve, can be located anywhere on the transmission system.
However, voltage control, in particular, is location specific. For the purposes of this report,
we classify these changes in generator output, which are required by EirGrid for system
reasons, as ‘curtailment’. This can arise at times when wind generation levels are a high
percentage of system demand as it may be necessary to reduce output from wind powered
generators in order to retain the necessary amount of conventional generation online to
provide all the system services required.

The output of generators may also need to be changed due to transmission network
limitations, specifically the overloading of transmission lines, cables and transformers.
Changes in generator output for this reason are referred to in this report as ‘constraint’. The
constraining of generation is location-specific and can be significantly reduced by
transmission network reinforcements. Some transmission constraints might only exist
temporarily due to transmission lines being taken out of service for maintenance or up-rating.

EirGrid                                      Page 6 of 53                                           18/03/2010
Baseline version draft 0.9 Gate 3 Constraint Report Area X Transmission constraints require that generation be re-dispatched to remove the possibility of transmission plant overloads (power flows beyond equipment ratings). A ‘transmission- constrained’ dispatch is therefore utilised to solve transmission constraints. Changing the ‘merit-order’ dispatch to a ‘transmission-constrained’ dispatch increases the cost of producing electricity as ‘out-of-merit’ generators are required to run. This extra production cost is referred to as transmission constraint costs. If such transmission constraint costs are forecast to be significant and persistent, then the capacity of the transmission system should be improved by suitable reinforcement to remove the constraint. As the construction of such reinforcements are subject to both environmental and planning restrictions as well as being costly, there is an appropriate balance to be struck between the cost of removing the problem, through increasing the capacity of the transmission system, and the costs incurred by transmission-constraining the dispatch. In conclusion, it is very unlikely that a transmission system that exhibits no constraints is the least cost overall solution. 1.3 ‘Physical’ Modelling versus Market Modelling In order for EirGrid to ensure the operation of a safe, secure and reliable power system, transmission network limitations as well as operational rules governing (1) the provision of operating reserve requirements, (2) the requirement for a minimum number of conventional generators to be synchronised and (3) North-South Interconnection power flows are employed by National Control Centre (NCC) engineers when determining the optimum generator commitment and dispatch. As a result, the actual ‘physical’ dispatch usually differs from the ‘merit-order’ dispatch determined by the market schedule engine. Depending on market rules, generators which have their output reduced may be compensated for differences between their market scheduled quantities and their actual ‘physical’ dispatched quantities for each trading period. This report assesses the ‘physical’ levels of curtailment and transmission constraint that generators in Area X might expect to experience in the period from 2011 through 2022. Whether a generator is compensated for the curtailment/constraint and the amount of any such compensation is not examined in this report. 1.4 Scenarios Several scenarios were examined for each study year for the period 2011 through 2022. The selection of scenarios was based on feedback received from industry representatives following an extensive consultation process. An overview of the scenarios is provided in Table 1.2. EirGrid Page 7 of 53 18/03/2010
Baseline version draft 0.9         Gate 3 Constraint Report                            Area X

                                                                             Additional
                                                      Fuel Price
                               Gate 3 Wind                                  ‘High Wind’
     Scenario                                        (Base Case,
                             (33%,66%,100%)                                   Reserve
                                                     Alternative)
                                                                           Requirement

                  1-A             100%                Base Case      2.5% of Wind > 1000MW
Scenario 1
                  1-B             100%                Base Case      7.5% of Wind > 1000MW

                  2-A             66%                 Base Case      2.5% of Wind > 1000MW
Scenario 2
                  2-B             66%                 Base Case      7.5% of Wind > 1000MW

                  3-A             33%                 Base Case      2.5% of Wind > 1000MW
Scenario 3
                  3-B             33%                 Base Case      7.5% of Wind > 1000MW

                  4-A             100%                Alternative    2.5% of Wind > 1000MW
Scenario 4
                  4-B             100%                Alternative    7.5% of Wind > 1000MW

          Table 1.2: Scenarios studied in the Gate 3 constraints modelling analysis.

Scenarios 1 through 3 were designed to examine the impact that different Gate 3 wind
connection levels would have on curtailment and constraint levels with Scenarios 1, 2 and 3
assuming Gate 3 connection levels of 100%, 66% and 33% respectively. For Scenarios 2
and 3, the Maximum Export Capacity (MEC) of each Gate 3 wind generator is simply scaled
by 66% and 33% respectively. Pre-Gate 3 wind generators were not included in this scaling
process. This was considered a more appropriate methodology than simply choosing 66% or
33% of the Gate 3 wind generators for inclusion in each scenario. It enables customers to
see the impact that different Gate 3 wind connection levels would have on curtailment and
transmission constraint levels at their particular node.

Like Scenario 1, Scenario 4 assumes that 100% of the Gate 3 wind generators connect. The
only difference between Scenarios 1 and 4 is in the fuel prices employed. Fuel prices are
critical to the decision as to which generators are committed and dispatched, with a resulting
impact on both curtailment and transmission constraint levels experienced by generators.
Detailed information on the two fuel price scenarios can be found in Section B.6.

Figure 1.2 shows the Republic of Ireland installed wind generation capacity by year for
Scenarios 1 through 4 assuming that all wind generators connect according to their
estimated shallow connection dates. As can be seen, all wind generation is assumed to be
connected by 2016 and there is a significant difference in the installed wind generation
capacities between the scenarios.

EirGrid                                     Page 8 of 53                                         18/03/2010
Baseline version draft 0.9 Gate 3 Constraint Report Area X
ROI Installed Wind Capacity (MW)
7,000
6,000
5,000
4,000
MW
3,000
2,000
1,000
0
2011 2012 2013 2014 2015 2016 2017 2018 2019 2020 2021 2022
ROI SN1/SN4 ROI SN2 ROI SN3
Figure 1.2: Republic of Ireland installed wind generation capacity by year for Scenarios 1
through 4 assuming all wind generators connect according to their estimated shallow
connection dates.
In advance of the results from the detailed dynamic studies being performed as part of
EirGrid’s Facilitation of Renewables workstream becoming available, a number of
reasonable assumptions were made on the operational requirements to ensure system
security. In particular, in order to cater for unexpected rapid reductions in wind generation,
an additional operating reserve requirement for high wind situations was assumed in the
studies. To determine the impact that different degrees of additional reserve requirement
would have on curtailment and constraint levels, each modelling scenario was examined
twice, once assuming an additional reserve requirement equal to 2.5% of the total wind
generation in excess of 1000MW and again assuming a more stringent additional reserve
requirement equal to 7.5% of the total wind generation in excess of 1000MW. The results for
both sets of operational rules are presented for all of the scenarios examined. For each of
the four scenarios, the post-scripts ‘–A’ and ‘–B’ are added to the scenario number to
discriminate between an additional ‘high wind’ reserve requirement of 2.5% or 7.5%,
respectively. A full list of the operational rules employed in the Gate 3 constraints modelling
is included in Section B.7.
1.5 Key Risks affecting the Results
The actual levels of curtailment and constraint may vary from those forecast in this report as
the analysis is based on a set of input assumptions such as the level of uptake of Gate 3,
fuel prices, demand growth, roll-out of transmission reinforcements, treatment of
interconnection with Great Britain, treatment of Northern Ireland generation and transmission
etc. Also, assumptions are made with regard to the operating reserve requirements and
minimum conventional generation requirements necessary to operate the power system with
a large penetration of non-dispatchable intermittent generation. The operational rules
employed in the analysis may differ from those actually employed in the future with a
resulting impact on curtailment and constraint levels.
EirGrid Page 9 of 53 18/03/2010Baseline version draft 0.9 Gate 3 Constraint Report Area X EirGrid has used an industry-class modelling tool called PROMOD IV, which is supplied and supported by Ventyx. However, no tools are perfect in modelling any real power system. While EirGrid has striven to ensure that the data in the model reflect the power system attributes and performance characteristics, there may be some modelling inaccuracies (see Section A.5). In addition to these variations, a significant risk factor relates to the shallow connection methodology assumed. The analysis has been carried out on the basis of various specific assumptions around generator shallow connection methods and timelines. Any change, temporary or permanent, to the connection point of the generators or any deviation from the assumed connection timelines is likely to have a potential impact on the level of transmission constraints stated in this report. For example, if generators which are assumed to be connected at 220kV are connected at 110kV, even on a temporary basis, it is likely to have an adverse impact on the overall level of transmission constraints. Finally, a key risk factor relates to the dispatch rules employed in the analysis. The Regulatory Authorities are currently consulting on the ‘Principles of Dispatch and the Design of the Market Schedule in the Trading and Settlement Code’ (SEM-09-073, published on July 8th 2009) with the decision paper expected to be published shortly. In advance of the decision paper publication and to enable the Gate 3 constraints modelling workstream to proceed, the CER provided EirGrid with a draft set of dispatch principles (see Section A.5 for a detailed description of the dispatch principles employed). If the final dispatch principles vary from those employed in the Gate 3 analysis, it is likely to have a significant impact on the overall level of constraints. This is a critical issue for the customer to consider in addition to possible forecast errors in the input assumptions. 1.6 Structure of the Report The report is structured as follows. Section 2 presents the results of the modelling analysis. The levels of curtailment and transmission constraint that generators at each node in Area X might expect to experience in the period from 2011 through 2022 are detailed. This is followed by several appendices which provide further detail on the data, assumptions and methodology used in the study. In particular, Appendix A provides an overview of the modelling methodology employed in the study. Details of the input assumptions employed in the development of the models for each study year are provided in Appendix B. Appendix C details the transmission reinforcements assumed in the study while the generator shallow connection dates assumed in the study are detailed in Appendix D. EirGrid Page 10 of 53 18/03/2010
Baseline version draft 0.9         Gate 3 Constraint Report                            Area X

2 RESULTS
This section presents the results of the modelling analysis for the nodes in Area X. The
levels of curtailment and transmission constraint that generators in Area X might expect to
experience in the period from 2011 through 2022 are reported on a nodal basis for several
scenarios.

The impact that different Gate 3 wind connection levels would have on curtailment and
transmission constraint levels in Area X is examined by Scenarios 1, 2 and 3 which assume
Gate 3 connection levels of 100%, 66% and 33% respectively. These three scenarios
assume 100% uptake of both Gate 2 and Pre-Gate 2 wind generators so any difference
between the curtailment and constraint results for the different scenarios should solely be
down to the different country-wide, pro-rata uptake rates of Gate 3 wind only.

Fuel prices are critical to the decision as to which generators are committed and dispatched.
The impact of fuel prices on curtailment and constraint levels is examined by Scenarios 1
and 4 which employ the ‘Base Case’ fuel prices and the ‘Alternative’ fuel prices respectively.

In order to cater for unexpected rapid reductions in wind generation, an additional operating
reserve requirement for high wind situations was assumed in the studies. To determine the
impact that different degrees of additional reserve requirement would have on curtailment
and constraint levels, all modelling scenarios were examined twice, once assuming an
additional reserve requirement equal to 2.5% of the total wind generation in excess of
1000MW and again assuming a more stringent additional reserve requirement equal to 7.5%
of the total wind generation in excess of 1000MW. The results for both sets of operational
rules are presented for all of the scenarios examined.

EirGrid                                     Page 11 of 53                                        18/03/2010
Baseline version draft 0.9               Gate 3 Constraint Report                                      Area X

2.1 Node XXXX Results

                                  Node XXXX Results: Scenarios 1-A, 1-B, 2-A and 2-B
                                           Scenario 1-A: 100% Gate 3 Wind, 2.5% Wind Reserve
  Year                                   2011   2012     2013   2014     2015    2016    2017   2018     2019    2020   2021   2022
  Installed Wind Capacity (MW)
  Gate 3 Wind (MW)
  Gate 2 Wind (MW)
  Pre-Gate 2 Wind (MW)
  Total Wind (MW)
  Results
  Available Energy (GWh)
  Curtailed Energy (GWh)
  Constrained Energy (GWh)
  Curtailed + Constrained Energy (GWh)
  Curtailment (%)
  Constraint (%)
  Curtailment + Constraint (%)
                                           Scenario 1-B: 100% Gate 3 Wind, 7.5% Wind Reserve
  Year                                   2011   2012     2013   2014     2015    2016    2017   2018     2019    2020   2021   2022
  Installed Wind Capacity (MW)
  Gate 3 Wind (MW)
  Gate 2 Wind (MW)
  Pre-Gate 2 Wind (MW)
  Total Wind (MW)
  Results
  Available Energy (GWh)
  Curtailed Energy (GWh)
  Constrained Energy (GWh)
  Curtailed + Constrained Energy (GWh)
  Curtailment (%)
  Constraint (%)
  Curtailment + Constraint (%)
                                            Scenario 2-A: 66% Gate 3 Wind, 2.5% Wind Reserve
  Year                                   2011   2012      2013   2014    2015    2016    2017   2018     2019    2020   2021   2022
  Installed Wind Capacity (MW)
  Gate 3 Wind (MW)
  Gate 2 Wind (MW)
  Pre-Gate 2 Wind (MW)
  Total Wind (MW)
  Results
  Available Energy (GWh)
  Curtailed Energy (GWh)
  Constrained Energy (GWh)
  Curtailed + Constrained Energy (GWh)
  Curtailment (%)
  Constraint (%)
  Curtailment + Constraint (%)
                                            Scenario 2-B: 66% Gate 3 Wind, 7.5% Wind Reserve
  Year                                   2011   2012      2013   2014    2015    2016    2017   2018     2019    2020   2021   2022
  Installed Wind Capacity (MW)
  Gate 3 Wind (MW)
  Gate 2 Wind (MW)
  Pre-Gate 2 Wind (MW)
  Total Wind (MW)
  Results
  Available Energy (GWh)
  Curtailed Energy (GWh)
  Constrained Energy (GWh)
  Curtailed + Constrained Energy (GWh)
  Curtailment (%)
  Constraint (%)
  Curtailment + Constraint (%)

                Table 2.1: Node XXXX - Results for Scenarios 1-A, 1-B, 2-A and 2-B for all study years

EirGrid                                            Page 12 of 53                                                18/03/2010
Baseline version draft 0.9 Gate 3 Constraint Report Area X
Node XXXX Results: Scenarios 3-A, 3-B, 4-A and 4-B
Scenario 3-A: 33% Gate 3 Wind, 2.5% Wind Reserve
Year 2011 2012 2013 2014 2015 2016 2017 2018 2019 2020 2021 2022
Installed Wind Capacity (MW)
Gate 3 Wind (MW)
Gate 2 Wind (MW)
Pre-Gate 2 Wind (MW)
Total Wind (MW)
Results
Available Energy (GWh)
Curtailed Energy (GWh)
Constrained Energy (GWh)
Curtailed + Constrained Energy (GWh)
Curtailment (%)
Constraint (%)
Curtailment + Constraint (%)
Scenario 3-B: 33% Gate 3 Wind, 7.5% Wind Reserve
Year 2011 2012 2013 2014 2015 2016 2017 2018 2019 2020 2021 2022
Installed Wind Capacity (MW)
Gate 3 Wind (MW)
Gate 2 Wind (MW)
Pre-Gate 2 Wind (MW)
Total Wind (MW)
Results
Available Energy (GWh)
Curtailed Energy (GWh)
Constrained Energy (GWh)
Curtailed + Constrained Energy (GWh)
Curtailment (%)
Constraint (%)
Curtailment + Constraint (%)
Scenario 4-A: 100% Gate 3 Wind, 2.5% Wind Reserve, Alternative Fuel Prices
Year 2011 2012 2013 2014 2015 2016 2017 2018 2019 2020 2021 2022
Installed Wind Capacity (MW)
Gate 3 Wind (MW)
Gate 2 Wind (MW)
Pre-Gate 2 Wind (MW)
Total Wind (MW)
Results
Available Energy (GWh)
Curtailed Energy (GWh)
Constrained Energy (GWh)
Curtailed + Constrained Energy (GWh)
Curtailment (%)
Constraint (%)
Curtailment + Constraint (%)
Scenario 4-B: 100% Gate 3 Wind, 7.5% Wind Reserve, Alternative Fuel Prices
Year 2011 2012 2013 2014 2015 2016 2017 2018 2019 2020 2021 2022
Installed Wind Capacity (MW)
Gate 3 Wind (MW)
Gate 2 Wind (MW)
Pre-Gate 2 Wind (MW)
Total Wind (MW)
Results
Available Energy (GWh)
Curtailed Energy (GWh)
Constrained Energy (GWh)
Curtailed + Constrained Energy (GWh)
Curtailment (%)
Constraint (%)
Curtailment + Constraint (%)
Table 2.2: Node XXXX - Results for Scenarios 3-A, 3-B, 4-A and 4-B for all study years
EirGrid Page 13 of 53 18/03/2010Baseline version draft 0.9 Gate 3 Constraint Report Area X
Graph here
Figure 2.1: Node XXXX Curtailment levels for Scenarios 1-A, 2-A, 3-A and 4-A
Graph here
Figure 2.2: Node XXXX Constraint levels for Scenarios 1-A, 2-A, 3-A and 4-A
Graph here
Figure 2.3: Node XXXX Curtailment and Constraint levels for Scenarios 1-A, 2-A, 3-A and 4-A
EirGrid Page 14 of 53 18/03/2010Baseline version draft 0.9 Gate 3 Constraint Report Area X
Graph here
Figure 2.4: Node XXXX Curtailment levels for Scenarios 1-B, 2-B, 3-B and 4-B
Graph here
Figure 2.5: Node XXXX Constraint levels for Scenarios 1-B, 2-B, 3-B and 4-B
Graph here
Figure 2.6: Node XXXX Curtailment and Constraint levels for Scenarios 1-B, 2-B, 3-B and 4-B
EirGrid Page 15 of 53 18/03/2010Baseline version draft 0.9 Gate 3 Constraint Report Area X
2.2 Node YYYY Results
Node YYYY Results: Scenarios 1-A, 1-B, 2-A and 2-B
Scenario 1-A: 100% Gate 3 Wind, 2.5% Wind Reserve
Year 2011 2012 2013 2014 2015 2016 2017 2018 2019 2020 2021 2022
Installed Wind Capacity (MW)
Gate 3 Wind (MW)
Gate 2 Wind (MW)
Pre-Gate 2 Wind (MW)
Total Wind (MW)
Results
Available Energy (GWh)
Curtailed Energy (GWh)
Constrained Energy (GWh)
Curtailed + Constrained Energy
(GWh)
Curtailment (%)
Constraint (%)
Curtailment + Constraint (%)
Scenario 1-B: 100% Gate 3 Wind, 7.5% Wind Reserve
Year 2011 2012 2013 2014 2015 2016 2017 2018 2019 2020 2021 2022
Installed Wind Capacity (MW)
Gate 3 Wind (MW)
Gate 2 Wind (MW)
Pre-Gate 2 Wind (MW)
Total Wind (MW)
Results
Available Energy (GWh)
Curtailed Energy (GWh)
Constrained Energy (GWh)
Curtailed + Constrained Energy
(GWh)
Curtailment (%)
Constraint (%)
Curtailment + Constraint (%)
Scenario 2-A: 66% Gate 3 Wind, 2.5% Wind Reserve
Year 2011 2012 2013 2014 2015 2016 2017 2018 2019 2020 2021 2022
Installed Wind Capacity (MW)
Gate 3 Wind (MW)
Gate 2 Wind (MW)
Pre-Gate 2 Wind (MW)
Total Wind (MW)
Results
Available Energy (GWh)
Curtailed Energy (GWh)
Constrained Energy (GWh)
Curtailed + Constrained Energy
(GWh)
Curtailment (%)
Constraint (%)
Curtailment + Constraint (%)
Scenario 2-B: 66% Gate 3 Wind, 7.5% Wind Reserve
Year 2011 2012 2013 2014 2015 2016 2017 2018 2019 2020 2021 2022
Installed Wind Capacity (MW)
Gate 3 Wind (MW)
Gate 2 Wind (MW)
Pre-Gate 2 Wind (MW)
Total Wind (MW)
Results
Available Energy (GWh)
Curtailed Energy (GWh)
Constrained Energy (GWh)
Curtailed + Constrained Energy
(GWh)
Curtailment (%)
Constraint (%)
Curtailment + Constraint (%)
Table 2.3: Node YYYY - Results for Scenarios 1-A, 1-B, 2-A and 2-B for all study years
EirGrid Page 16 of 53 18/03/2010Baseline version draft 0.9 Gate 3 Constraint Report Area X
Node YYYY Results: Scenarios 3-A, 3-B, 4-A and 4-B
Scenario 3-A: 33% Gate 3 Wind, 2.5% Wind Reserve
Year 2011 2012 2013 2014 2015 2016 2017 2018 2019 2020 2021 2022
Installed Wind Capacity (MW)
Gate 3 Wind (MW)
Gate 2 Wind (MW)
Pre-Gate 2 Wind (MW)
Total Wind (MW)
Results
Available Energy (GWh)
Curtailed Energy (GWh)
Constrained Energy (GWh)
Curtailed + Constrained Energy
(GWh)
Curtailment (%)
Constraint (%)
Curtailment + Constraint (%)
Scenario 3-B: 33% Gate 3 Wind, 7.5% Wind Reserve
Year 2011 2012 2013 2014 2015 2016 2017 2018 2019 2020 2021 2022
Installed Wind Capacity (MW)
Gate 3 Wind (MW)
Gate 2 Wind (MW)
Pre-Gate 2 Wind (MW)
Total Wind (MW)
Results
Available Energy (GWh)
Curtailed Energy (GWh)
Constrained Energy (GWh)
Curtailed + Constrained Energy
(GWh)
Curtailment (%)
Constraint (%)
Curtailment + Constraint (%)
Scenario 4-A: 100% Gate 3 Wind, 2.5% Wind Reserve, Alternative Fuel Prices
Year 2011 2012 2013 2014 2015 2016 2017 2018 2019 2020 2021 2022
Installed Wind Capacity (MW)
Gate 3 Wind (MW)
Gate 2 Wind (MW)
Pre-Gate 2 Wind (MW)
Total Wind (MW)
Results
Available Energy (GWh)
Curtailed Energy (GWh)
Constrained Energy (GWh)
Curtailed + Constrained Energy
(GWh)
Curtailment (%)
Constraint (%)
Curtailment + Constraint (%)
Scenario 4-B: 100% Gate 3 Wind, 7.5% Wind Reserve, Alternative Fuel Prices
Year 2011 2012 2013 2014 2015 2016 2017 2018 2019 2020 2021 2022
Installed Wind Capacity (MW)
Gate 3 Wind (MW)
Gate 2 Wind (MW)
Pre-Gate 2 Wind (MW)
Total Wind (MW)
Results
Available Energy (GWh)
Curtailed Energy (GWh)
Constrained Energy (GWh)
Curtailed + Constrained Energy
(GWh)
Curtailment (%)
Constraint (%)
Curtailment + Constraint (%)
Table 2.4: Node YYYY - Results for Scenarios 3-A, 3-B, 4-A and 4-B for all study years
EirGrid Page 17 of 53 18/03/2010Baseline version draft 0.9 Gate 3 Constraint Report Area X
Graph here
Figure 2.7: Node YYYY Curtailment levels for Scenarios 1-A, 2-A, 3-A and 4-A
Graph here
Figure 2.8: Node YYYY Constraint levels for Scenarios 1-A, 2-A, 3-A and 4-A
Graph here
Figure 2.9: Node YYYY Curtailment and Constraint levels for Scenarios 1-A, 2-A, 3-A and 4-A
EirGrid Page 18 of 53 18/03/2010Baseline version draft 0.9 Gate 3 Constraint Report Area X
Graph here
Figure 2.10: Node YYYY Curtailment levels for Scenarios 1-B, 2-B, 3-B and 4-B
Graph here
Figure 2.11: Node YYYY Constraint levels for Scenarios 1-B, 2-B, 3-B and 4-B
Graph here
Figure 2.12: Node YYYY Curtailment and Constraint levels for Scenarios 1-B, 2-B, 3-B and 4-B
EirGrid Page 19 of 53 18/03/2010Baseline version draft 0.9 Gate 3 Constraint Report Area X
APPENDIX A: MODELLING METHODOLOGY
A.1 Introduction
This section provides an overview of the modelling methodology employed to determine the
likely curtailment and constraint levels for generators in Area X.
The methodology of production cost modelling was utilised to conduct the studies for this
report. A detailed description of production cost modelling is presented and an overview of
PROMOD IV, the modelling tool employed, is also provided.
The Republic of Ireland and Northern Ireland systems were modelled at individual generator
level in these studies. A set of high level dispatch principles was provided by the CER to
govern the generator dispatch decision process. The dispatch assumptions employed in the
modelling are presented.
Several simulations are required to determine the curtailment and constraint levels. A high-
level overview of the methodology employed in their determination is provided.
Finally, an overview of the range of scenarios examined in this report is presented.
A.2 Production Cost Modelling
In general terms, production cost models utilise optimisation algorithms with the objective of
minimising the cost of generating power to meet demand in a region while satisfying
operational, security and environmental constraints. A production cost model minimises the
combined fuel and CO2 cost (variable operation and maintenance costs can also be taken
into account but are not considered in this study). Wind powered generation has essentially
zero cost but is not dispatchable. Hydro generation also has zero cost but is energy limited.
Chronological production cost models optimise generator commitment and dispatch
scheduling for every hour of a study period (typically one year duration). Production cost
models require:
o Specification of individual generator capabilities including capacity, start-up energy,
annual forced outage rate, annual scheduled outage duration, reserve provision
capabilities, emission rates and heat rates (fuel input requirement per unit output
generation).
o Specification of the hourly demand profile for the region.
o Specification of the fuel price for each type of fuel.
o Specification of the transmission network (required for studies where transmission
constraint information is a desired output).
o Specification of the constraints:
· System security constraints such as the requirement for reserve.
· Generator operational constraints such as maximum and minimum
operational levels, ramp rates, minimum runtimes and downtimes etc.
· Environmental considerations such as the cost of CO2.
The production cost modelling tool employed in this study was PROMOD IV. PROMOD IV’s
features are described in Section A.3.
EirGrid Page 20 of 53 18/03/2010Baseline version draft 0.9 Gate 3 Constraint Report Area X A.3 PROMOD IV PROMOD IV is a detailed generation and transmission analysis program widely used in the electricity industry for over 25 years. EirGrid has extensive experience of using this simulation tool to model the Irish power system since 1994. PROMOD IV is supplied and supported by Ventyx and is continually being upgraded and improved. EirGrid has used the latest stable release for the Gate 3 modelling. It is an hourly Monte Carlo generation production cost modelling simulation program, used to determine power system performance and cost. It is a complex and very powerful tool for power system analysis, with separate commitment and dispatch algorithms. The commitment process refers to the selection of a number of generators, from the total portfolio, which are to be used to meet customer demand. The decision as to when these generators should come on or off line is also part of the commitment process. So, for example, additional generation is committed on Monday mornings in order to meet higher weekday (than weekend) demand. The dispatch process refers to the decisions taken on the loading of individual generation units. Thus the contribution from each on-line, or committed, unit towards meeting customer demand is determined by the dispatch decision. The Monte Carlo element of the program relates to the treatment of the forced outages of generation units and to the duration of their outages. These outages occur randomly during the year, yet they conform to the specified forced outage probability values on a whole over a given year. The duration of each outage varies randomly about a mean outage time, which is specified in advance. This probabilistic element of the program adds greatly to the realism of the simulation. Full technical performance characteristics and operational cost details of each generation unit on the system must be specified. An hourly system demand profile is also required. The transmission and distribution systems can also be modelled in detail if desired. The program output provides complete details of the operation of each generation unit. These are aggregated into system totals. Flows on transmission lines can be monitored and potential constraints on the system can be identified. A wide range of output reports is available, from system summaries to hour by hour information on individual generators. A.4 All-Island Model For this study, the Republic of Ireland and Northern Ireland systems were modelled at generator level i.e. every single conventional generator is modelled in detail. Characteristics such as heat rates, ramp rates, minimum runtime and downtime, start-up energy, reserve provision capabilities, annual forced outage rate, annual scheduled outage duration and emission rates of each individual generator had to be specified. Wind powered generators were modelled using hourly power series (more detail on the modelling of wind powered generation is provided in Section B.2). In this study, Ireland and Northern Ireland were treated as a single system in the production cost model for the purposes of producing an optimal minimum cost commitment and dispatch. The Uplift and Capacity Payment mechanisms present in the Single Electricity Market (SEM) were not modelled. Instead, generators were dispatched based on their short run marginal costs (which include the costs of fuel and CO2 emissions) and in accordance with the dispatch assumptions outlined in Section A.5. EirGrid Page 21 of 53 18/03/2010
Baseline version draft 0.9             Gate 3 Constraint Report                              Area X

A.5 Dispatch Assumptions
The Regulatory Authorities are currently consulting on the ‘Principles of Dispatch and the
Design of the Market Schedule in the Trading and Settlement Code’ (SEM-09-073, published
on July 8th 2009) with the decision paper expected to be published shortly. However, in
advance of the decision paper publication and to enable the Gate 3 constraints modelling
workstream to proceed, the CER provided EirGrid with a draft set of dispatch principles.

The draft, high level dispatch principles provided by the CER were as follows:

          (1) dispatch is based on a least cost basis based on offer prices for non priority
              dispatch generation;
          (2) a zero offer price should be used to model priority dispatch plant;
          (3) no account of ‘firm access’ is to be taken in the dispatch process as per current
              dispatch practices;
          (4) where redispatch of priority dispatch plant is required, the following order is to be
              employed (in order of what plant is turned down first):
              o peat;
              o hydro;
              o wind, and within wind generators
                     § Variable Price Takers (pro rata) ;
                     § Autonomous.

There were some small subtle differences in the unit commitment and dispatch algorithms
employed relative to the principles provided by the CER. The differences can be
summarised as follows:

    ·     No differentiation between Autonomous and Variable Price Taker wind generators
          was made as it was not possible to know in advance of the start of the studies which
          wind generators would be in each category.

    ·     The peat plant were modelled as ‘must-run’ generators with non-zero pricing. If
          redispatch of priority plant was required to alleviate a constraint, the peat plant were
          turned down before wind generators to their minimum stable capacity. However, the
          peat plant were not shut down to alleviate a constraint.

    ·     It was not possible to explicitly turn down hydro generation before wind generation.
          The hydro plant were modelled using monthly energy allocations and were scheduled
          to run based on load.

However, these differences would not be expected to have a material impact on the level of
curtailment/constraint observed.

A.6 Determination of Curtailment and Constraint
The flow diagram shown in Figure A.1 provides a simple high-level overview of the
methodology employed to determine curtailment and constraint levels. While the actual
process is considerably more complex than that detailed in Figure A.1, two main simulations
are effectively required to be performed, as described below:

    ·     System Constrained simulation: Generators are committed and dispatched in the
          most economical manner while satisfying operational and security constraints such
          as operating reserve requirements and the requirement for a minimum number of

EirGrid                                         Page 22 of 53                                         18/03/2010
Baseline version draft 0.9 Gate 3 Constraint Report Area X
conventional generators to be synchronised. Transmission network limitations are not
considered in this simulation i.e. a ‘perfect’ transmission network is assumed.
· System and Transmission Constrained simulation: Generators are committed and
dispatched in the most economical manner while satisfying all of the operational and
security constraints as above but also including the limitations of the transmission
network. This simulation is an N-1 study with all transmission lines and transformers
included in the contingency analysis, apart from radial feeders.
For each hour, the curtailed wind energy is calculated by comparing the wind energy output
from the System Constrained simulation with the theoretical unconstrained input wind energy
available. The overall annual system curtailment level is then calculated by summing the
hourly energy curtailment levels.
The transmission constraint information for each generator is calculated by comparing the
energy output for each generator from the System Constrained simulation with the energy
output for each generator from the System and Transmission Constrained simulation. Any
reduction or increase in generator output between the two simulations presumably arises
solely due to transmission network limitations.
Figure A.1: Simple high-level overview of the methodology employed to determine
curtailment and constraint levels.
The separate calculation of curtailment and constraint results in a slightly sub-optimal result.
This methodology was employed to fulfil requests to separately identify curtailment and
constraint. It is likely that a combined optimisation of curtailment and constraint would result
in overall lower reduction levels for wind generators in particular. However, it is not clear that
such a level of optimisation is achievable in practice. Also, it can be difficult to clearly
compare the results from both methodologies due to complex interactions in the power
system.
A.6.1 Allocation of Curtailment
For this report, it is assumed that all wind generators are controllable and can therefore be
instructed to reduce their output if required. At hours when it is necessary to curtail wind
EirGrid Page 23 of 53 18/03/2010Baseline version draft 0.9 Gate 3 Constraint Report Area X
generation output, a decision has to be made as to which wind generators should have their
output reduced. It is assumed in this study that all wind generators share the reduction in
output energy arising from curtailment in proportion to their available energy in that hour i.e.
on a pro-rata basis.
A.6.2 Allocation of Constraint
When a transmission constraint occurs, PROMOD IV will attempt to alleviate the constraint
in the most cost-effective manner. If a transmission constraint causes wind generation to be
constrained down, PROMOD IV’s internal dispatch logic may choose one wind generator to
constrain down out of several that have the same flow impact on the constraint (due to the
fact that, in the Gate 3 constraints model, all wind generators are modelled with the same
cost of production). However, in this situation, all wind generators that have similar impact on
the constraint should share proportionally in the effect of the constraint.
The Locational Marginal Price (LMP) at a node is the hypothetical incremental cost to the
electricity system of redispatching the available generators to serve a hypothetical additional
MWh of demand at that node. The congestion cost component of a particular generator’s
LMP is directly based on the generator’s DC powerflow shift factor on the constraint. This
shift factor represents the additional contribution to flow on the constrained transmission
element due to an incremental increase in the generator’s output. The congestion cost
component of the LMP at a node i attributable to a specific constraint j is mathematically
defined simply by the product of the shift factor of node i on constraint j, times the shadow
price of the constraint j. If CCij is defined as the congestion cost component for node i due to
constraint j then, for any two closely connected nodes which are equally affected by the
constraints in an hour, all of their CCij values will be identical.
In order to allocate constrained generation over all wind generators which have the same
impact on a constraint, post-processing of the results in the manner detailed below was
required:
(1) After the dispatch is completed for an hour, identify each wind generator i for
which the final dispatched energy is less than the original assumed schedule.
(2) Identify all other generators that have exactly the same CCij congestion cost
components. This will identify the similarly constrained units.
(3) Sum the final generation (after constraining down) over this set of generators.
(4) Allocate this total constrained energy for this congestion pocket to these
generators in proportion to their original scheduled energy as follows:
æ GTotal
Dispatched
ö
G i
Final
=G i
Scheduled
´ çç Scheduled ÷÷
è GTotal ø
This process ensures that all wind generators which have the same impact on a
transmission constraint are equally affected by it.
A.7 Range of Scenarios Assessed
As there are always uncertainties in future forecasts, and to provide more information to
connection applicants, it is prudent to examine the possible curtailment and constraint levels
for Area X for many different scenarios. The selection of scenarios was based on feedback
received from industry representatives following an extensive consultation process. Detailed
discussion of the scenarios was previously presented in Section 1.4.
EirGrid Page 24 of 53 18/03/2010Baseline version draft 0.9 Gate 3 Constraint Report Area X APPENDIX B: INPUT ASSUMPTIONS B.1 Introduction This section provides an overview of the assumptions employed in the development of the models for each study year. The methodology employed for modelling wind powered generation in the studies is presented and assumptions on the regional capacity factors and wind profiles employed are detailed. The all-island system was modelled at generator level and therefore the exact generation portfolio to be employed for each study year had to be specified explicitly. The assumptions on conventional generator characteristics, pumped storage plant operation as well as non- wind small-scale generation and non-Group Processing Approach (non-GPA) generation modelling are presented. In addition, all generators included in the Gate 3 constraints analysis were added to the model based on their estimated shallow connection dates. Hence, the methodology and assumptions used to estimate the shallow connection dates are described. The fuel and carbon prices employed in the modelling are critical to the decision as to which generators are committed and dispatched, with a resulting impact on both curtailment levels and transmission constraint levels experienced by generators. Therefore, the assumptions on the fuel and carbon prices employed are presented. Operational rules governing operating reserve requirements, the requirement for a minimum number of conventional generators to be synchronised as well as North-South Interconnection power flows are employed to ensure that the necessary system services are in place to enable the operation of a safe, secure and reliable power system. The operational rules assumed in this study are presented. A forecast of future electricity demand is an important input to the studies. The types and sources of demand input data, along with the actual demand forecast utilised in this report, are presented. The assumptions on the amount of interconnection between the Republic of Ireland and Northern Ireland and between the island of Ireland and Great Britain as well as the treatment of interconnection in the studies are described. Finally, reinforcement of the transmission network either by uprating existing lines or the construction of new lines is critical in the relief of transmission constraints. The assumptions on transmission reinforcements used in the studies are presented. B.2 Wind Modelling The PROMOD IV software tool models wind powered generation using hourly wind power series. EirGrid maintains a database which contains the metered output at 15 minute intervals for every wind powered generator in the Republic of Ireland. By amalgamating the output of all wind generators in a region which have been in commission for a full calendar year it is possible to build up annual regional wind profiles with hourly values for the Gate 3 group processing areas. The historical base wind regional profiles can then be used to produce future year wind regional profiles by scaling to the appropriate installed wind EirGrid Page 25 of 53 18/03/2010
Baseline version draft 0.9          Gate 3 Constraint Report                              Area X

capacity levels. By using regional wind power profiles in the studies, it is possible to account
for the geographical variation of wind power across the country.

For the Gate 3 constraints modelling, 2008 was chosen as the base wind profile year. Taking
the period since the beginning of 2004 to the end of 2008 (i.e. a five year period), the overall
annual capacity factor for the Republic of Ireland averaged 31.6%. The 2008 capacity factor
for the Republic of Ireland was 31.7%. In the future, it is possible that improvements in wind
generation technology will enable more power to be captured from the same wind
conditions. On the other hand, it is possible that the best sites from a wind regime have been
developed already with future developments experiencing less favourable wind regimes. In
any case, given that the 2008 capacity factor is very close to (and marginally higher than)
the five year average, EirGrid believe that it is a suitable ‘wind year’ to reflect what has been
historically observed.

Wind generation was modelled in the Gate 3 constraints analysis using an hourly wind
power series at every node where wind generation is connected. For a given study year, at
each node, the capacity of individual wind generators was totalled and this total nodal
capacity figure was used in conjunction with the historical regional wind power series to
produce the appropriate future hourly wind profile for each node. Hence, every node in a
Gate 3 Area has an identical hourly wind series profile but scaled by the MW value of wind
generation connected at each node in that study year. While many of the Gate 3 Areas were
assigned a unique regional wind profile, in some instances a single regional wind profile was
used for multiple Gate 3 Areas e.g. nodal wind profiles in areas E, F and I were developed
using the same regional wind profile. Figure B.1 shows a high-level map of the Gate 3 Areas
with the different regional wind profile areas colour-coded for distinction. The map in Figure
B.1 is indicative only - the area in which each node was assumed to be located for wind
profile development is detailed in Appendix D.

EirGrid                                      Page 26 of 53                                          18/03/2010
Baseline version draft 0.9 Gate 3 Constraint Report Area X
Enclosures: Distinct Wind Profiles Gate 3 Wind regions
Profile 1: Area A Profile 2: Area B
Profile 3: Areas C & H1 Profile 4: Area D S O RNE
H ILL
T R ILLICK
Profile 5: Areas E, F & I Profile 6: Areas G& J BU NBEG
Profile 7: Areas K & H2 Profile 8: N. Ireland
K ILTOY
Profile 9: Atlantic Profile 10: Irish Sea L ETTERKENNY
M EENTYCAT
TO STRABANE
D RUMKEEN
T IEVEBRACK
LEGEND C RONCARKFREE
400 kV Lines Transmission Connected
220 kV Lines Generation BINBANE
NORTHERN
Hydro Generation G OLAGH
110 kV Lines IRELAND
400 kV Cables Thermal Generation
220 kV Cables Pumped Storage Generation M U LREAVY
110 kV Cables Wind Generation CA THALEEN'S
CL IFF
F ALL
400 kV Stations
A
TO TURLEENAN
220 kV Stations New 220 kV Stations
110 kV Stations New 110 kV Stations
TO ENNISKILLEN L ISDRUM
SL IGO
TA WNAGHMORE TO TANDRAGEE
C O RDERRY
S R ANANAGH
B ELLACORICK CO RRACLASSY 275kV
CU NGHILL G ARVAGH
MO Y G O RTAWEE
G L ENREE AR IGNA
DU NDALK
S H ANKILL
CAR RICK
- O N- RA TRUSSAN L OUTH M U LLAGHARLIN
S H ANNON
ME A TH
T O NROE H ILL
CA STLEBAR F L AGFORD G ILRA ARV A M O YHILL
C ARROWBEG
B
DALTON
SL IABH B AWN
RICHMOND G N AVAN
G O RMAN
DR YBRIDGE
P L ATIN
Irish
L ANESBORO
K NOCKUMBER
S TEVENSTOWN
B ALTRASNA O RIEL
S C R EEB
C L OON
A THLONE
C MU LLINGAR
K INNEGAD
W OODLAND
C O R DU F F H U N T S T O W N
G L A S M O RE
B A L G RIF F IN
G R ANGE
F I N G L AS N O R T H W AL L
RB
R I N AW ADE
MACETOWN
C O LLE GE
U GOOL DU NFIRTH P A RK P O O L BE G
DERRYIRON GH R IN GSEN D
S H E L L YBAN K S
D ER RYCARNEY CU SHALING BL AKE
M A Y NO O TH I N C H ICO RE I R I S HTO WN
S EECON CA SHLA TH ORNSBERRY F IN NS TO WN
J
COOKSTOWN B L A C K RO CK
S H ANNONBRIDGE
S A LTHILL C H E R RYW O O D
G A LWAY M O UNT LUCAS
Atlantic
S O MERSET M O NREAD K I L T EEL C A R R ICK M IN E S
N E WBRIDGE F ASSAROE
BA RODA
K E ELDERRY
T Y NAGH K ILLINAPARSON DU NSTOWN
Offshore
O L DSTREET DA LLOW P O LLAPHUCA
T U RLOUGH
DE R RYBRIEN H ILL
PO RTLAOISE
B ALLYBEG
Sea
A G ANNYGAL ATHY S TR ATFORD
D
L A OIS
IK ERRIN
EN NIS C ARLOW K ILBRIDE ARKLOW
BO OLTIAGH N E NAGH BALLYRAGGET K ELLIS
D RUMLINE L ISHEEN
T U LLABRACK BALLYMURTAGH AR DNACRUSHA C U REENY
H1
PROSPECT T H URLES B ALLYCADDEN
M O NEYPOINT MUNGRET S IN GLAND BANOGE
S EALROCK M O NETEEN A H ANE
K ILLONAN CASTLEDOCKRILL
TA RBERT CA STLEFARM BA LLYCUMMIN K ILKENNY L O DGEWOOD
R ALAPPANE AU GHINISH L IMERICK C AUTEEN
ASKEATON K ILL HILL
H2
K ILPADDOGE CR ANE BA LLYWATER
RA THKEALE
CA HERNAGH
T IPPERARY
ATHEA DR OMADA
E
T R IEN
K NOCKANURE D O ON
K NOCKNAGASHEL B ALLYDINE W E XFORD
CA HIR AN NER
Offshore
CL AHANE CH ARLEVILLE G REAT ISLAND
REAMORE G L ENTANE
TR ALEE W A TERFORD
K NOCKACUMMER
CU LLENAGH
G L ENLARA K ILLOTERAN
CO RDAL BU TL ERSTOWN
O UGHTRAGH K ISKEAM M ALLOW
D U NGARVAN
K
K NOCKEARAGH
B ARRYMORE
W OODHOUSE
G ARROW BA LLYVOUSKIL
BO GGERAGH
C L ONKEEN
CL ASHAVOON K NOCKRAHA
I
COOMAGEARLAHY K ILBARRY
IN NISCARRA MA RINA
G L ANLEE M ACROOM C O OLROE M IDLETON
K ILGARVAN T R A BEG
C ARRIGADROHID AG HADA
H ARTNETTS CROSS RAFFEEN
G L ANAGOW
B ARNADIVANE BR INNY
BANDON
BA LLYLICKEY
DU NMANWAY
F
Figure B.1: High-level map showing the Gate 3 Areas with the distinct regional wind profile
areas clearly colour-coded.
As already stated, the overall 2008 wind generation capacity factor for the Republic of
Ireland was 31.7%. On a regional level, the 2008 wind generation capacity factors varied
reflecting the performance of the existing wind generators in those regions. Table B.1 details
the capacity factors of the historical 2008 regional wind profiles used to produce the future
year Gate 3 Area wind profiles employed in the constraints modelling.
EirGrid Page 27 of 53 18/03/2010You can also read