Te Aponga Uira Final Renewable Energy Economic Viability Study
←
→
Page content transcription
If your browser does not render page correctly, please read the page content below

Prepared for

Te Aponga Uira Final
Renewable Energy Economic
Viability Study

                 Prepared by:

                 KEMA Australia Pty Ltd
                 Level 9, 189 Kent Street
                 Sydney NSW 2000
                 T: +61 2 8243 7700
                  F: +61 2 9241 3998

                 Submitted to:

                 Te Aponga Uira
                 Cook Islands

                 KEMA Australia Pty Ltd

                 www.dnvkema.com

                                            Experience you can trust.
Table of Contents
1.   Executive Summary ................................................................................................................ 1
2.   Introduction ........................................................................................................................... 2
     2.1 Overview of the Existing Situation .................................................................................. 2
     2.2     The TAU Network ........................................................................................................ 2
     2.3     Conventional Units ........................................................................................................ 2
     2.4     The Government’s Renewable Energy Plan ...................................................................... 4
     2.5     Renewable Energy Development Up-to-Date and Outlook ................................................. 4
     2.6 Load Characteristics ...................................................................................................... 5
3.   Benefit Cost Model ............................................................................................................... 10
     3.1   Model Overview ......................................................................................................... 10
     3.2   Overview of the Calculations in the Benefit Cost Model .................................................. 11
     3.3   Costs of Technologies, Assumptions and Treatment of Benefits ........................................ 12
           3.3.1 Renewable Costs ............................................................................................. 12
           3.3.2 Storage Costs .................................................................................................. 13
           3.3.3 Costs for Automation and Control...................................................................... 14
           3.3.4 Energy Efficiency Costs and Benefits ................................................................. 15
           3.3.5 Renewable Benefits ......................................................................................... 16
           3.3.6 General Assumptions ....................................................................................... 16
4.   Scenarios ............................................................................................................................. 18
     4.1 Overview ................................................................................................................... 18
     4.2 Recommended Scenario ............................................................................................... 19
     4.3 Other Scenarios ........................................................................................................... 23
           4.3.1 50 % By 2020 ................................................................................................. 24
           4.3.2 100 % Renewable by 2020 with Batteries for Load shifting .................................. 24
           4.3.3 100 % by 2020; Biodiesel Scenario .................................................................... 25
           4.3.4 50 % 2015; 100 % by 2020 – Renewables and Storage Mix with Biodiesel ............. 26
           4.3.5 50 % 2015; 100 % e by 2020 – Renewables and Storage Mix without Biodiesel ...... 27
     4.4 Comparing Scenario Results ......................................................................................... 28
5.   Key Findings ....................................................................................................................... 33
     5.1 Resource Mix Findings ................................................................................................ 33
     5.2 Cost Effectiveness ....................................................................................................... 33
     5.3 Risks ......................................................................................................................... 34
     5.4 Role of Storage ........................................................................................................... 34
6.   Action Plan Economic Viability Study Action Plan .................................................................. 36
Appendix A findings from KEMA’s interviews ............................................................................ 38
Appendix B Stakeholder interviewed/consulted January – May 2012 ........................................ 42
Appendix C – Additional Data from Benefit / Cost Model- ......................................................... 43
   Costs of Renewable Technologies – Recommended Case ................................................ 44
Appendix D- Ranking of Scenarios............................................................................................ 62
TAU                                                                                                                       Proprietary
Economic Viability Report                                                                                         19 September 2012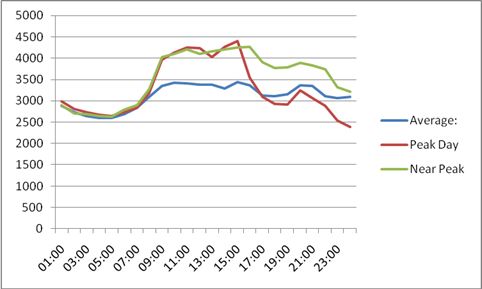
Appendix – E – Emerging Technologies ................................................................................... 63

List of Figures
Figure 2-1: Load Forecast ....................................................................................................................... 5
Figure 2-2: Visitors per Month ............................................................................................................... 6
Figure 2-3: Load Shapes by Day Type for Rarotonga ............................................................................ 7
Figure 2-4: January 2012 Peak and Average Load Shapes ..................................................................... 8
Figure 2-5: Sunshine Hours for Cook Islands Locations ........................................................................ 9
Figure 3-1: Schematic Representation of the Model............................................................................. 11
Figure 3-2: Annual Energy Savings Assumed in kWh ......................................................................... 16
Figure 4-1: Fuel Mix of Recommended Scenario ................................................................................. 20
Figure 4-2: Energy Mix of Recommended Case.................................................................................. 21
Figure 4-3: Annual Expenditure by Type – Recommended Case......................................................... 22
Figure 4-4: Cumulative Expenditures of the Recommended Case ....................................................... 22
Figure 4-5: Benefit Cost Results by Scenario ....................................................................................... 29
Figure 4-6: Nominal Results of Presented Scenarios............................................................................ 30
Figure 4-7: Average Yearly Prices for Selected Scenarios ................................................................... 31
Figure 4-8: Annual Expenditures on Storage by Scenario .................................................................... 32

List of Tables
Table 2-1: Current TAU Generation ....................................................................................................... 3
Table 3-1: Cost Parameters Renewables ............................................................................................... 13
Table 3-2: Cost Parameters Storage ...................................................................................................... 14
Table 3-3: Automation Costs ................................................................................................................ 15
Table 3-4: Main Assumptions for all Scenarios.................................................................................... 17
Table 4-1: Summary of Scenarios......................................................................................................... 19
Table 4-2: Summary of Renewable Resources used in the Recommended Scenario ........................... 20
Table 4-3: Summary of the Recommended Scenario ........................................................................... 21
Table 4-4: Presents a Summary of Key Parameters of the Recommended Case: ................................. 23
Table 4-5: Summary table for the 50% renewable scenario ................................................................. 24
Table 4-6: Summary Table for the Load Shifting Scenario .................................................................. 25
Table 4-7: Summary Table for the Bio Diesel Scenario ....................................................................... 26
Table 4-8: Summary Table for the Mix of Renewables and Scenario .................................................. 27
Table 4-9: Summary Table for Renewable and Storage Mix without Biodiesel .................................. 28

TAU                                                                                                                               Proprietary
Economic Viability Report                                                                                                 19 September 2012
1.           Executive Summary
This report provides an economic viability study of possible renewable energy options for the Island
of Rarotonga. The economic viability study was based on a comprehensive benefit cost analysis of
future renewable energy future for six scenarios. In July 2011, the Prime Minister, Hon. Henry Puna
announced the Cook Islands Government’s ambitious renewable energy targets: to achieve 50%
electricity supply by renewable energy by 2015 and 100% by 2020. We developed scenarios that met
both of the 2015 and 2020 goals; scenarios that just met the 2020 goal and a scenario that only
reached 50 % renewable energy by 2020. A critical need to meet the Prime Minister’s goal is to be
able to have renewable energy or stored renewable energy to cover the night time load of the island.

There are three scenarios that reach both the 2015 and 2020 goals that are very cost effective – those
are the:

        Recommended Scenario – where the primary renewable resource is wind, followed by solar;

        Renewable and Storage Mix – where there is both significant solar and wind resources;

        Renewable and Storage Mix – where there is significant solar, wind and biodiesel;

The Recommended Scenario is the most cost effective and the least costly of the scenarios that reach
the Prime Minister’s goals. It will require significant investment in 2012-2020 time period. The
nominal cost of this scenario is $ NZ 149 M. The benefit to cost ratio is 2.11 indicating the benefits
are more than 2 times the cost of this scenario.

All scenarios require significant storage for grid stability. Storage is used in some scenarios to store
renewable energy to use during the night time hours.

All scenarios require significant investment in solar and wind.

All scenarios include a Waste to Energy Plant. All include significant solar and wind.

All of the 3 scenarios above illustrate that Rarotonga can reach 100 percent renewable energy by 2020
in a cost effective manner.

Te Aponga Uira                                       1                                          Proprietary
Economic Viability Report                                                               19 September 2012
2. Introduction This report was developed by DNV KEMA for Te Aponga Uira (TAU) to assess the economics of renewable energy scenarios for Rarotonga. The Prime Minister’s Renewable Plan does have the objective of the island becoming one hundred percent renewable by 2020. This analysis in this report is based on a benefit cost model. DNV KEMA used four scenarios to assess the overall costs and benefits of increasing the amount and type of renewable energy on the island of Rarotonga. This report does not address or analyze the adequacy of any future renewable energy projects. Moreover, this report is based upon certain assumptions and sample cases, and it is therefore intended to be advisory but not all-inclusive as to events and scenarios which could arise in reality. In no event should this report be relied upon as a guarantee of any performance results of any scenarios used here. 2.1 Overview of the Existing Situation 2.2 The TAU Network Rarotonga, the capital and the main island of Cook Islands, has the area of 67km2. The population of Rarotonga is 13, 097 according to the 2011 Census. Tourism is the dominant industry and visitor arrivals have been increasing steadily in the past years and were 112,461 in 20111. Rarotonga is fully electrified and Te Aponga Uira (TAU), the Government Business Enterprise (GBE), owns the power generation and distribution network serving 4,037 residential and 1,032 commercial customers2. The power generation is heavily dependent on imported diesel. The generation capacity of TAU is about 9.5 MW out of the nine gen-sets. The firm capacity has been reduced from 12MW due to de-rating of six gen-sets. The distribution network comprises 80km of 11kV underground cables and 200km of 415V low voltage distribution lines. TAU operates with IEC standards and the power supply quality has been benchmarked as the “best class” for similar island networks3. 2.3 Conventional Units The power station is located in the Avatiu Valley. There are nine generating units all burning diesel # 2 as the fuel. The gen-sets are of various ages and conditions of which two generating units (No.4 and No.5) are considered having reached the end of their lifetime. Power station control is done manually in the power station control room. The power station has 3 bulk fuel tanks of 54,000 liter each and 2 day tanks (13,500 and 13,900 liters). 1 http://www.stats.gov.ck/ 2 TAU Facts 3 Quantification of the Power System Energy Losses in South Pacific Utilities, 2011 Te Aponga Uira 2 Proprietary Economic Viability Report 19 September 2012
Most of the installed generators’ capacity has been de-rated due to various engine problems. The total
generation capacity is 12,300kW and the de-rated total capacity 9,500kW. As the result the firm
capacity is 6,000kW under the n-2 policy. TAU has a spinning reserve policy that provides
uninterrupted power supply in case the largest generator trips. Currently the system peak demand is
4,830kW (2011) and is expected to be further reduced due to recent PV installations and the on-going
energy efficiency program. With the total available capacity TAU can keep up with the n-2 criterion.
However, there are issues to be addressed to ensure long-term power supply quality.

The gen-set ratings are listed in the table below.

                                      Table 2-1: Current TAU Generation

         No.             Make                                     Rating               *Actual Rating
         Gen. 1          Duvant Crepelle / 12V26N                 rated 2000 kW        de-rated 1500 kW
         Gen. 2          Duvant Crepelle / 12V26N                 rated 2000 kW        de-rated 1500 kW
         Gen. 3           Mirrlees Blackstone / MB                rated 1600 kW        de-rated 1200 kW
                         275-8
         Gen. 4          Lister Blackstone / ETSL                 rated 600 kW         de-rated 400 kW
         Gen. 5          Lister Blackstone / ETSL                 rated 600 kW         de-rated 400 kW
         Gen. 6           Mirrlees Blackstone / ESL               rated 1200 kW        Out of Service
                         16
         Gen. 7          MAN B&W / L9-27/38                       rated 2700 kW        2700 kW
         Gen. 8          Cummins / KTA50-G3                       rated 800 kW         800 kW
         Gen. 9          Cummins / KTA50-G3                       rated 800 kW         800 kW
         Total                                                    12,300 kW            9,300 kW
* Apart from No. 6 which has been taken out of service the other engines are temporarily de-rated. Each one is able to be run
to full load but not continuously

In late 2007, TAU commissioned Hydro Tasmania Consulting (HTC) to conduct a power system
review and upgrade option study. The focus of the study was the security of electricity supply and the
HTC report identified a number of risks associated with the power system operation and evaluated
upgrading options.

Key recommendations include:
    • retain the existing power station;

     •    add a new power house to the existing power station;

     •    implement automation to improve asset protection and control;

     •    replace old inefficient medium speed generator sets with high speed generating sets;

     •    investigate the feasibility of progressively installing wind turbines; and

     •    implement a number of minor projects to improve system security.

Te Aponga Uira                                                3                                                Proprietary
Economic Viability Report                                                                              19 September 2012
Following the HTC 2008 report, TAU has developed the power house upgrade plan. Currently the
upgrade is now incorporating the Cook Island Government’s Renewable Energy Plan.
2.4 The Government’s Renewable Energy Plan
The Cook Islands enjoyed a high level of electrification. However, the energy supply has been heavily
dependent on imported fossil fuels, exposing the Cook Islands to the risks of energy security and
international oil price volatility.
In July 2011, the Prime Minister, Hon. Henry Puna announced the Cook Islands Government’s
ambitious renewable energy targets: to achieve 50% electricity supply by renewable energy by 2015
and 100% by 2020.
The Cook Islands Government has established a Renewable Energy Development Division (REDD)
with the Office of the Prime Minister as an indicator of leadership. The Government has also openly
voiced to the International Community, the Region and the Country of its commitment to achieving,
by Renewable Energy means, the electricity demand of the country by 2020.
REDD has recently developed the Cook Islands Renewable Energy Chart Implementation Plan. The
Implementation Plan is focused mainly on the outer islands. According to the Implementation Plan,
the cost for achieving 100% renewable energy supplied electricity for Rarotonga is NZ $208m. It is
expected that the future electricity supply for Rarotonga will be a mix of mature renewable energy
technologies including Solar (PV), wind, waste to energy and other emerging renewable energy
technologies with energy storage and backed-up by diesel generators4.
2.5 Renewable Energy Development Up-to-Date and Outlook
To encourage renewable energy development from the commercial and residential customers, TAU
introduced a Net-Metering Policy in November 2009. The Net-Metering policy provided economic
incentives to customers interested in grid-tied renewable energy installations under 10kW capacity,
allowing for credits to accumulate over a period of 12 months from the excess energy fed back into
the grid.
The Net-Metering policy has been a great success. The response to the Net-Metering policy from the
public has been overwhelming. By the end of January 2012, 59 projects were installed with the total
capacity of 288kW. The projection of the installed renewable energy capacity will exceed 800 kW by
2012. Noticeably, most installations are PV projects.
Due to network safety and power quality concerns, TAU issued an amended Net-Metering policy on
1st October 2011 to limit the individual installed capacity under 2kW. A process of assessment and
approval by TAU is mandatory before any grid-tie project can proceed.
4
REDD: Cook Islands Renewable Energy Chart Implementation Plan, March 2012
Te Aponga Uira 4 Proprietary
Economic Viability Report 19 September 2012The new Net-Metering policy has restricted net-metered PV installations greater than 2kW. However,
the high cost of electricity is driving the high demand of PV installations, particularly for businesses
where energy costs are significant. Even without “Net-Metering” benefits, many projects, providing it
is grid-tied, are still considered viable. For example, CITC has installed a number of grid-tied projects
and the biggest project has the capacity of 85kW. These new installations will have reverse power
relay installed preventing power export to the grid. Some of these projects have some level of battery
storage as “counter-cloud measure”, i.e., to draw power from batteries for up to 30 minutes to local
loads in the case of cloud caused power down instead of drawing power from the grid.
Under current electricity tariff the simple payback of net-metered PV projects is under 6 years. With
the cost-down trend of PV systems, the viability of net-metered PV installations will further improve
over the years. Therefore it is expected the organic growth of PV installations will continue for the
foreseeable future. The growth rate is expected in the range of ~500kW per year.
2.6 Load Characteristics
We forecast a modest growth in sales and peak load growth for this analysis. We projected that sales
would increase at 1.75 percent per year and demand at 1.61 percent per year until 2020, for this
analysis.
These projections are presented below:
Figure 2-1: Load Forecast
35,000,000 5,600
34,000,000
kWh energy
5,400
kWh energy after savings
kW demand
33,000,000
5,200
32,000,000
kWh
kW
31,000,000 5,000
30,000,000
4,800
29,000,000
4,600
28,000,000
27,000,000 4,400
2012 2013 2014 2015 2016 2017 2018 2019 2020
Te Aponga Uira 5 Proprietary
Economic Viability Report 19 September 2012Economic Drivers
Tourism is the main industry in the Cook Islands. Approximately 100,000 people visit the Cook
Islands each year, spending their time mostly on Rarotonga and Aitutaki. This increased the
population by around 3,000 each day on average and 4,000 per day during the peak tourist period
5
which is usually between July and September.
Figure 2-2: Visitors per Month
Visitors per Month
16,000
14,000
12,000
10,000
8,000
6,000 2009
4,000
2,000 2010
- 2011
Overall GDP is approximately $250M per year. Real gross domestic product (GDP) per capita is now
around NZ$15,000 (US$12,000). Electricity and water supply account for 2% of GDP, with the
dominant components of GDP being; Wholesale and Retail Trade 20%, Restaurants and
Accommodation 16%, Transport and Communication 18%, and Finance and Business Services 13%.
Public Administration is 9% of GDP.6
The key drivers of growth are expanding tourism and rising household spending, these are
contributing factors to unemployment being at low levels on Rarotonga. Rising numbers of foreign
workers are required to meet the needs of the island’s expanding private sector. Tourism will likely
remain as the driver of economic growth, but will remain concentrated in Rarotonga and Aitutaki. 7
5
The Cook Islands Renewable Electricity Implementation Plan (Draft) ; Renewable Energy Development Division; Office
of the Prime Minister; Government of the Cook Islands
6
The Cook Islands Renewable Electricity Implementation Plan (Draft) ; Renewable Energy Development Division; Office
of the Prime Minister; Government of the Cook Islands
7
The Cook Islands Renewable Electricity Implementation Plan (Draft) ; Renewable Energy Development Division; Office
of the Prime Minister; Government of the Cook Islands
Te Aponga Uira 6 Proprietary
Economic Viability Report 19 September 2012Load Shape
The load shape for Rarotonga for different day types is shown below:
Figure 2-3: Load Shapes by Day Type for Rarotonga
The load shape is relatively flat; The load shape has a typically AC peak driven by commercial and
residential loads and then a second peak around 8 pm driven by residential AC and other nighttime
loads. The nighttime loads show that 2.5-3 MW are needed throughout the night.8
The figure presented below is from January of this year is based on the output of the generations and
shows a similar pattern:
8
Source: HTC 2008, Te Aponga Uira Cook Islands Power System Review and Expansion Options. Hydro Tasmania
Consulting, January 2008
Te Aponga Uira 7 Proprietary
Economic Viability Report 19 September 2012Figure 2-4: January 2012 Peak and Average Load Shapes
Observations from most recent data:
1. The blue line is the average over all days by hour- its low is about 2.6 MW and the peak on
average is about 3.5 MW.
2. The red line is the actual January peak day where it appears there was a storm late in the day.
3. The green line is the second highest day where clearly there was no weather relief- the load
stays higher longer- that load shape is probably a better more realistic peak load shape as
there is no sudden reduction of load.
The solar hours for some of the islands are shown below for the twelve months.
Te Aponga Uira 8 Proprietary
Economic Viability Report 19 September 2012Figure 2-5: Sunshine Hours for Cook Islands Locations
Sunshine Hours
Courtesy Cook Islands Telecom January 2012
9.00
Penrhyn
8.00
7.00 Rakahanga
6.00 Manihiki
5.00 Pukapuka
4.00 Nassau
3.00 Suwarrow
2.00
Palmerston
1.00
Aitutaki
-
Jan Feb Mar Apr May Jun Jul Aug Sep Oct Nov Dec Mauke
There is strong coincidence between the sunlight hours and the load between 7am and 6 pm.
Generally the secondary peak is not during sunlight hours. The above data suggest that a key
challenge for having a very high percentage energy from renewable generation will be the night time
hours. This will require renewable production that occurs during all hours or a very large amount of
storage for load shifting.
Te Aponga Uira 9 Proprietary
Economic Viability Report 19 September 20123. Benefit Cost Model
3.1 Model Overview
The presented Benefit Cost Model is specifically built for the purpose of assessing the transition of
Rarotonga to renewable energy sources. The model is built as flexible as possible and allows for
accurate scenario building. Scenarios can be built by adding different sources of renewable capacity in
kW annually, for the period up to and including 2020. Subsequently the amount of storage needed for
grid stability purposes and (if applicable) load shifting is calculated. As part of the optimizing
progress, storage capacity in kW can be added to the scenario on a year by year basis up to 2020. The
model also allows for adding kW’s of biodiesel to the scenario.
Optimisation of the scenario is done manually, by observing some important model indicators like
total expenditures, benefit/cost (B/C) ratio and net present value (NPV).
Figure 3-1 shows a schematic of the model divided into three main parts; model input, model
calculations, and model output. The main model input categories are:
• General Parameters
• Financial Parameters
• Scenario Information for 2012-2020
The latter category is adjusted or optimised by using some of the model calculations. The main
categories in the model calculations part are:
• Calculation Line Parameters; these parameters are, or may be, variable over time (e.g. the
demand forecast and annual growth parameters) and are included directly into the time series
calculation sheet of the model.
• Line Items Used to Optimise Inputs; these model time series are fed back into the input part
of the model to serve as indictors for optimisation purposes.
• Other Line Items; miscellaneous items that are essential for generating the desirable output of
the model.
Finally the model automatically generates output that can be used in reports, and is essential for
evaluating the variation between the different scenarios that are under investigation. The model
generates three types of output; main indicators, charts, and tables. A selection of the output of the
model will be discussed in Section 4 where the scenarios and results are described.
Te Aponga Uira 10 Proprietary
Economic Viability Report 19 September 2012Figure 3-1: Schematic Representation of the Model 3.2 Overview of the Calculations in the Benefit Cost Model Ultimately benefits and costs are calculated in the model and are used to perform the societal test. Costs are generally expenditures, as they represent outgoing cash flows rather than accounting allocated costs. Expenditures are in turn split into two different types, operational expenditures (OpEx, also known as maintenance and operation costs) and capital expenditures (CapEx, also known as investment costs). CapEx is used in the model to represent the actual capital expenditures in renewables or storage; it is displayed in a cost per kW. OpEx is used as two distinctive types, variable and fixed. Fixed OpEx in $ per kW per annum ($/kW/a), and variable OpEx in $ per MWh generated electricity. In the current model variable OpEx is used for the renewable generation assets. In this model a load factor is used to calculate the amount of kWh per kW of renewable can be generated yearly with the applicable renewable. Fixed OpEx is used for storage, because generally the energy output of storage is too low to provide a sensible OpEx number. This is presented in $ per KW per annum. Te Aponga Uira 11 Proprietary Economic Viability Report 19 September 2012
There are two types of benefits handled in the model. The first benefit is the avoided fuel cost (diesel
generation), and the second is the energy efficiency benefit. The avoided diesel generation is
calculated in kWh by summarising the total generated kWh by the installed renewable capacity, the
energy efficiency is calculated in kWh by taking a percentage of the total energy demand in kWh at a
certain point in time. To calculate the benefits, both kWh numbers are multiplied by the applicable
average cost per kWh.

The output of the model includes several indicators. Some of the most important are the benefit/cost
(B/C) ratio, the average cost per kWh, and the net value (result). The formulas for these indicators are
shown in the equations below:

    (1) The benefit/cost ratio: [(cumulative energy efficiency benefits) + (cumulative generation
        benefits)] / [(cumulative CapEx and OpEx)]

    (2) The average cost per kWh: [(cumulative OpEx and CapEx) + (cumulative kWh generated by
        diesel*cost of generation) - (cumulative generation benefits)] / [(cumulative kWh generated)]

    (3) The net value: [(cumulative energy efficiency benefits) + (cumulative generation benefits)] –
        [(cumulative CapEx and OpEx)]

    (4) The net present value: [(benefits ;year 1-expenditures;year 1) / (1+interest rate)^1]+
        [(benefits;y2-expenditures;y2) / (1+interest rate)^2]+........................+[(benefits;y15-
        expenditures;y15) / (1+interest rate)^15]

Equation 4 shows the calculation of the net present value (NPV). The net values, or net cash flows
(cumulative benefits – cumulative expenditures) for every year are calculated to the present values by
using the applicable interest rate. The collection of the present or cash values of each project year
together is called the net present value (NPV).

3.3          Costs of Technologies, Assumptions and Treatment of
             Benefits

3.3.1        Renewable Costs

Table 3-1 displays the cost parameters for renewable resources used in the benefit cost model. The
CapEx cost parameters for solar are based on interviews with solar suppliers active on the Cook
Islands. The other CapEx and all the variable OpEx cost parameters are averages based on a number
of sources available to DNV KEMA9. All the numbers are rounded, compensated for exchange rate
differences, and price indexed.

9
 CEC Renewable Energy Cost of Generation Update, 2009, (KEMA 2009),
CEC Renewable Energy Cost of Generation Update, 2009, (IEPR 2007),
CEC Renewable Energy Cost of Generation Update, 2009, (RETI 1A),
CEC Renewable Energy Cost of Generation Update, 2009, (CPUC E3 2008),
European Commission, DG Energy, Financing Renewable Energy in the European Energy Market, 2011,

Te Aponga Uira                                          12                                           Proprietary
Economic Viability Report                                                                    19 September 2012
Table 3-1: Cost Parameters Renewables
Type of Cost/ Renewable CapEx OpEx Variable
$/kW $/MWh
Solar Behind the Meter 5,000 66.00
Net Metered Solar 5,000 66.00
Utility Solar 5,000 35.00
Wave 8,400 70.00
Off-Shore Wind 5,900 72.00
On-Shore Wind 2,700 37.00
Small Scale Wind 5,000 57.00
Small Scale Hydro 5,500 36.00
Waste to Energy/ Biomass 16,000, 39.00
3.3.2 Storage Costs
The cost parameters that are used for storage are split up in two categories. There is one category for
grid stability (GS) and one for load shifting (LS). Storage for grid stability is based on batteries only.
Batteries installed until 2015 are still assumed to be under development, and therefore costly.
However, in the next three years it is assumed that the development of different typed of batteries will
continue and lead to the availabilities of more competitively priced batteries by 2015. In the model the
price of the installed batteries for the purpose of grid stability will therefore drop significantly by
2015. The CapEx cost parameter for batteries installed up to 2015 are based on a quoted from two
tbattery manufacturers The remaining CapEx and fixed OpEx cost parameters are an average based on
information from the DNV KEMA storage cost database.
Storage for the purpose of load shifting is not added before 2015, for several reasons. First of all it is
not necessary as long as there is still a limited amount of renewables installed. Secondly, the costs for
storage are too high before 2015, and finally the total amount (LS and GS) of kW’s storage to be
installed in the first few years would be unrealistically high.
Since batteries for load shifting purposes are much more frequently charged and discharged, the
average life of these batteries is much shorter, and therefore set at three years. The model incorporates
several replacements of the installed batteries for load shifting purposes. The CapEx and OpEx cost
parameters are also based on information from the DNV KEMA storage cost database. Additionally
cost parameters for reverse thermal cold storage are added to the model. This storage technology is a
long life low-cost alternative for batteries, and employable for the purpose of load shifting. However,
IEA, NEA and Organisation for Economic Co-Operation and development, Projected Costs Of Generating Electricity, 2010
Edition.
Te Aponga Uira 13 Proprietary
Economic Viability Report 19 September 2012this type of storage is only available for a limited amount of kW since it is typically used in
commercial office buildings for cooling and in processing of frozen foods. Table below summarises
all the cost parameters for storage GS as well as LS.
Table 3-2: Cost Parameters Storage
Type of Cost/ Renewable CapEx $/kW OpEx Fixed $/kW/a
Storage GS* ≤2014 (Batteries) 7,500 27.00
Storage GS* >2014 (Batteries) 2,750 27.00
Storage LS** (Pumped hydro) 5,200 47.00
Storage LS** (Batteries, 3 year life time) 2,750 27.00
Storage LS** (Reverse Thermal Cold) 2,400 12.00
*GS = Grid Stability **LS= Load Shifting
3.3.3 Costs for Automation and Control
It is recommended to upgrade the power system with some automation and control measures. This
upgrade will include the following components:
• A programmable logic controller (PLC) system
• An overall control system; “small SCADA” system without power analysis
• A simple engineering data repository system (OSI Pi), including software based
maintenance system.
• Communication infrastructure between remote sites and control centres.
• A unitised control system for each power station (for Automatic Voltage Regulation).
• Condition monitoring of the conventional diesel power stations.
The mentioned components are based on the report of Tasmania Hydro and will form a basic
automation and control system for the energy distribution on Rarotonga. The capital expenditures for
each component are displayed in the table below. The numbers are based on controlling and
monitoring six separate power stations.
Te Aponga Uira 14 Proprietary
Economic Viability Report 19 September 2012Table 3-3: Automation Costs
Component CapEx
PLC system $ 300,000
SCADA system $ 350,000
OSI Pi $ 450,000
Communication infrastructure $ 150,000
Unitised control systems $ 150,000
Condition Monitoring $ 120,000
Total CapEx $1,520,000
Annual OpEx +/- 30% of CapEx annually $ 500,000
Total capital expenditures are a little over $1.5 million, and annual operational expenditures will be
around half a million yearly. The automation and control systems should be operational by the end of
2016, which means 10 years of operational expenditures, a total $5 million, and $1.5 million capital
expenditures. Therefore, the total costs for automation and control is estimated to equal $6.5 million.
In addition, a capital expenditure of $250,000 has also been added to the model. These expenditures
correspond to the necessary costs for an upgrade of 5 diesel generators to allow for the use of
biodiesel.
3.3.4 Energy Efficiency Costs and Benefits
Energy efficiency measures are also incorporated in the model and all the proposed scenarios. The
energy efficiency measures are projected as a linear decrease of 10% of demand as of 2020. The
saved energy in kWh is shown in Figure 3-2. The energy efficiency benefit is calculated as a societal
benefit by multiplying the kWh’s of saved energy by the current price of electricity in cents per kWh.
There are also some costs related to the energy efficiency measures, these costs are projected as 3
cents per kWh saved electricity and are deducted from the benefits annually, leaving a final benefit of
76 cents for every save kWh of electricity.
Te Aponga Uira 15 Proprietary
Economic Viability Report 19 September 2012Figure 3-2: Annual Energy Savings Assumed in kWh
Annual Energy Savings in kWh
4,000,000
3,500,000
3,000,000
2,500,000
2,000,000
1,500,000
1,000,000
500,000
0
2012 2013 2014 2015 2016 2017 2018 2019 2020
3.3.5 Renewable Benefits
All kWh generated by renewable energy sources are considered an equivalent saving in the cost for
generating electricity by using diesel generators. The corresponding societal benefit is the cost of the
avoided electricity.
3.3.6 General Assumptions
Table 3-4 below displays the main general assumptions used in the model. The model uses a real
interest rate or weighted average cost of capital (WACC) of 12.50%, corresponding to a cost of
capital mixture of commercial and local governmental funding. We do not use a nominal interest rate,
as we only inflate prices that increase above or decrease below a standard average long term inflation
rate (i.e. applicable Consumer Price Index, CPI).
The chosen life of the benefit cost analysis is 15 years. Additionally we used an electricity price of 79
cents per kWh for the calculation of the benefits as described in section 3.3.4, which has not been
adjusted over time in the model. This means that benefits might be underestimated if the electricity
price was to increase above the average applicable CPI in the future. Furthermore, all other cost
parameters are also not increasing or decreasing over time. It could be argued that the costs for
technologies will drop significantly in the future. However, it is assumed that these technologies will
be substituted for improved technologies at the same price level, increasing only the efficiency. In
turn this efficiency improvement will compensate for some of the deficiencies encountered at the
beginning of the project. The model is user friendly and theses assumptions can be easily changed.
Te Aponga Uira 16 Proprietary
Economic Viability Report 19 September 2012Table 3-4: Main Assumptions for all Scenarios
Main Assumptions All Scenarios
Real Interest Rate (WACC) 12.50%
Life of B/C analysis 15 Year
Price of Electricity 0.79 $/kWh
Price Biodiesel: Diesel 1:1
Lastly, in some of the scenarios biodiesel is used as a renewable alternative for diesel. In all scenarios
the price for 1 litre of biodiesel is assumed to be of equal rate as 1 litre of normal diesel. Therefore,
the inclusion of biodiesel in a scenario will not lead to any direct benefits, but will only provide for
avoided expenditures. Biodiesel helps decreasing the amount of storage needed for grid stability, and
will defer investment in storage for load shifting indefinitely, or to the point it is significantly more
affordable.
Te Aponga Uira 17 Proprietary
Economic Viability Report 19 September 20124. Scenarios
4.1 Overview
As part of this analysis we developed six scenarios to represent possible energy futures for Rarotonga.
At present there are no larger scale renewable projects under development for Rarotonga. There is a
limited amount of small wind; most of the existing renewable energy is net metered solar and behind
the meter solar.
The first parameter we looked at for scenarios was the Prime Minister’s goals – namely 50 percent
renewable energy by 2015 and 100 % renewable energy by 2020. We developed scenarios that did
not meet those goals; scenarios that met the 2020 goal but not 2015; and scenarios that met both goals.
The 50 percent by 2015 requires that a significant amount of renewable energy be built in the next 3
years. To meet the 100 percent goal by 2020 requires a significant amount both utility scale and
customer side renewables.
The fuel mix of the scenarios is the next parameter. The scenarios include different mixes of customer
side and utility scale renewables as well as a mix of:
• Behind the meter solar
• Net Metered solar
• Utility scale solar ( above 500 kW)
• Community or small scale wind
• Utility scale wind on shore (above 500 kW)
• Utility scale wind offshore
• Small hydro
• Wave
• Waste to energy/ biomass, and
• Biodiesel
We recognize that these and other technologies will change overtime. We present some newer not yet
commercial technologies in Appendix E.
Role of storage technologies was another parameter of the scenarios. All scenarios include mix of
storage for grid support. The amount of storage for grid support or grid stability is related to the mix
of renewables. Storage is also used in some scenarios to shift load to produce energy from storage
when energy from renewables is not available. There is a trade-off between using storage for load
shifting and using biodiesel. The load shifting storage options we considered were: batteries, storage
cooling; and small pumped hydro.
Te Aponga Uira 18 Proprietary
Economic Viability Report 19 September 2012The last parameter we considered was cost effectiveness. We developed scenarios that were cost
effective and optimised the benefit cost ratio for each scenario. Using storage for load shifting is very
expensive and hence the scenarios with that as a major component were less cost effective.
After running a number of scenarios we developed what we call the Recommended Scenario. The
table below summarizes the scenarios at a high level.
Table 4-1: Summary of Scenarios
% renewable % renewable %
Scenario Benefit/ Cost avg Price in 2015 in 2020 % solar %wind %storage biodiesel total costs
50 % by 2020 2.65 0.66 17.00% 50.00% 23.90% 17.60% 9.00% 0.00% $62.3 M
100 % in 2020 with biodiesel 1.51 0.59 26.80% 100.00% 47.90% 17.80% 0.02% 22.00% $161M
100% in 2020 with battery
load shifting 1.02 0.84 26.60% 100.00% 48.20% 17.30% 22.50% 0.00% $294M
50 % by 2015, 100% by 2020; Renewable,
Biodiesel and Storage mix 1.67 0.58 51.60% 100.00% 49.60% 17.30% 7.66% 11.40% $171M
50 % by 2015, 100 % by 2020, Renewable
storage mix 1.69 0.61 51.60% 100.00% 41.70% 28.00% 14.65% 0.00% $186 M
50 % by 2015 ; 100 % by 2020
High Wind - Recommended 2.11 0.54 50.20% 100.00% 27.70% 53.30% 10.55% 0.00% $149 M
We ranked the scenarios on:
• How feasible they were
• Technology Risk
• Cost Effectiveness
• Ease of Implementation, and
• Whether they met the Prime Minister’s goals.
The rankings and an associated weighting scheme are presented in Appendix D. As shown in the table
above the benefit cost ratios ranged from 1.02 ( for the load shifting case) to the 50 percent renewable
by 2020 which is the most cost effective at 2.65 clearly as less investment is made in renewables and
storage. Of the three scenarios that meet both the 2015 and 2020 goals, the recommended scenario is
the least costly and most cost effective. This scenario ranked the highest using the parameters we
considered. This scenario is described in more detail in the next section.
4.2 Recommended Scenario
This scenario includes significant wind and solar. It has the most wind of all of the scenarios we
developed. This is a primary reason it is more cost effective. It includes utility scale onshore wind;
community wind and utility scale offshore wind. A summary of the renewable resources used in kW
this scenario are show below in Table 4-2:
Te Aponga Uira 19 Proprietary
Economic Viability Report 19 September 2012Table 4-2: Summary of Renewable Resources used in the Recommended Scenario
Recommended Scenario
Added Renewable Capacity in kW 2012 2013 2014 2015 2016 2017 2018 2019 2020
Solar behind the meter 275 200 200 200 200 200 0 0 0
Net metered solar 200 500 550 550 400 400 300 300 200
Utility Scale Solar 0 0 0 0 0 0 0 500 0
Off-shore wind 0 0 0 0 0 0 0 2,500 0
Small Scale/ Community Wind 0 0 300 300 0 0 0 100 0
Utility (Onshore) Wind 0 0 0 3,000 0 0 0 0 0
Wave 0 0 0 0 0 0 0 0 50
Waste-to-Energy/ Biomass 0 420 0 0 0 0 0 0 0
Small Hydro 0 0 0 0 0 0 0 0 0
Bio Diesel Gen. 0 0 0 0 0 0 0 0 0
Total all renewables 475 1,120 1,050 4,050 600 600 300 3,400 250
This is also shown graphically in Figure 4-1:
Figure 4-1: Fuel Mix of Recommended Scenario
Recommended Scenario cumulative 'fuel' mix (renewables and storage)
20,000
18,000
16,000
Energy Efficiency
14,000 Small Hydro
Small Scale/ Community Wind
Waste-to-Energy/ Biomass
12,000
Wave
Biodiesel
kW
10,000
Off-shore wind
Utility Scale Solar
8,000 Utility (Onshore) Wind
Net metered solar
6,000 Storage GS
Storage LS
Solar behind the meter
4,000
2,000
-
2012 2013 2014 2015 2016 2017 2018 2019 2020
The majority of utility scale renewables are wind. There is also significant net metered solar and a 500
KW utility scale solar plant. This scenario does meet the Prime Minister’s goals cost effectively. This
does require that a large on shore wind project (3 MW project) be developed by 2015 to meet the
2015 goal. This is expected to be challenging.
Wind has a load profile that covers more hours of the year than solar; requiring less load shifting to
become 100 percent renewable. We also assumed in this case that the waste to energy could be run
just a night at 420 kW instead of all day at 210 kW. This does allow for covering more of the night
time load.
Te Aponga Uira 20 Proprietary
Economic Viability Report 19 September 2012The storage additions over time in kW are shown below in Table 4-3 below:
Table 4-3: Summary of the Recommended Scenario
Recommended Scenario
Added Storage Capacity in kW 2012 2013 2014 2015 2016 2017 2018 2019 2020
Storage GS: Batteries developed 0 0 0 400 550 650 400 900 0
Storage GS: Batteries under development 120 240 360 0 0 0 0 0 0
Storage LS: Pump Storage Hydro 0 0 0 0 0 0 0 500 0
Storage LS: Batteries 0 0 0 0 0 0 600 0 500
Storage LS: Reverse Thermal Storage (Cold) 0 0 0 0 0 0 100 100 100
The total amount of storage in this scenario is 5,520 MW. This scenario includes 500 kW of small
scale pumped hydro in 2019.
The figure below shows the energy by fuel type over time:
Figure 4-2: Energy Mix of Recommended Scenario
Recommended Scenario annual energy mix (renewables and storage)
40,000,000
35,000,000
30,000,000 Storage GS
Wave
Small Scale/ Community Wind
25,000,000 Small Hydro
Utility Scale Solar
Waste-to-Energy/ Biomass
kWh
20,000,000
Net metered solar
Bio Diesel Gen.
Energy Efficiency
15,000,000
Utility (Onshore) Wind
Storage LS
Off-shore wind
10,000,000
Solar behind the meter
5,000,000
-
2012 2013 2014 2015 2016 2017 2018 2019 2020
Figure 4-3 presents total Operating Expenditures (OpEx) and capital expenditures over time (Cap
Exp) for this scenario. The large Cap Ex expenditures in 2019 are for the offshore wind and pumped
hydro additions in that year.
Te Aponga Uira 21 Proprietary
Economic Viability Report 19 September 2012Figure 4-3: Annual Expenditures by Type – Recommended Scenario
Recommended Scenario total annual expenditures by type
30,000,000
25,000,000
20,000,000
$NZ
15,000,000 Total OPEX
Total CAPEX
10,000,000
5,000,000
-
2012 2013 2014 2015 2016 2017 2018 2019 2020 2021 2022 2023 2024 2025 2026 2027
Cumulative Expenditures are shown below through 2027:
Figure 4-4: Cumulative Expenditures of the Recommended Scenario
Recommended Scenario total cumulative expenditures by fuel
160,000,000
140,000,000
120,000,000
100,000,000
Storage
$NZ
80,000,000
Biodiesel
Renewables
60,000,000
40,000,000
20,000,000
-
2012 2013 2014 2015 2016 2017 2018 2019 2020 2021 2022 2023 2024 2025 2026 2027
Te Aponga Uira 22 Proprietary
Economic Viability Report 19 September 2012Table 4-4: Presents a Summary of Key Parameters of the Recommended Scenario:
Recommended Scenario
Result Summary Table Indicator Unit
Nominal Costs Renewables $ 149.24 M$NZ
Nominal Costs Biodiesel $ - M$NZ
Nominal Benefits $ 314.56 M$NZ
Net Value $ 165.32 M$NZ
Benefit Cost Ratio 2.11 B/C
Interest Rate 12.50% -
Project Length 15 Year
Average cost per kWh (all years) $ 0.54 $NZ
Recommended Scenario
Source: %
Solar 28%
Wind 53%
Other 10%
Biodiesel 0%
Storage 11%
Total 102%
4.3 Other Scenarios
This section presents the other scenarios that we considered:
50 % renewable by 2020 – this scenario provides the lowest cost, is the most cost effective but does
not meet the Prime Minister’s goals.
100 % Renewable by 2020 with Batteries for Load shifting- This scenario uses batteries to shift
load to cover the night time hours. It does not meet the Prime Minister’s 2015 goal but does meet the
2020 goal. It is the most expensive scenario and the least cost effective.
100 % by 2020; Biodiesel Scenario- This scenario uses 850 kW of biodiesel rather than any storage
for load shifting to meet 100 percent by 2020. This scenario does not meet the 2015 goal of 50%
renewable energy.
50 % Renewable by 2015; 100 % Renewable by 2020 – Renewable, biodiesel and Storage mix-
This scenario uses bio diesel along as well as storage to load shift. The storage includes batteries;
storage cooling and small pumped storage. There is significant solar and wind in this scenario.
50 % Renewable by 2015; 100 % Renewable by 2020 - Renewable Mix – without biodiesel. The
main difference between this one and the previous scenario is no biodiesel was used. SThis scenario
Te Aponga Uira 23 Proprietary
Economic Viability Report 19 September 2012and the one above are both cost effective, meet the Prime Minister’s goal and both are very feasible
scenarios.
We now present additional information about these scenarios in this section and in Appendix D.
4.3.1 50 % By 2020
The table below presents summary data for this scenario. This scenario has the lowest total
expenditures at $63 M. This is because it does not reach the Prime Minister’s goal of 100%
renewable energy by 2020 – only 50 % by 2020. As less utility scale projects are required it is an
achievable scenario.
Table 4-5: Summary table for the 50% renewable scenario
50% renewables
Result Summary Table Indicator Unit
Nominal Costs Renewables $ 62.89 M$NZ
Nominal Costs Biodiesel $ - M$NZ
Nominal Benefits $ 166.43 M$NZ
Net Value $ 103.53 M$NZ
Benefit Cost Ratio 2.65 B/C
Interest Rate 12.50% -
Project Length 15 Year
Average cost per kWh (all years) $ 0.66 $NZ
50% renewables
Source: %
Solar 24%
Wind 18%
Other 9%
Biodiesel 0%
Storage 0%
Total 50%
4.3.2 100 % Renewable by 2020 with Batteries for Load shifting
As noted above this scenario uses batteries to shift load to achieve the 100% renewable by 2020 goal.
This scenario’s cost are $294 M. The summary of the scenario is shown below:
Te Aponga Uira 24 Proprietary
Economic Viability Report 19 September 2012Table 4-6: Summary Table for the Load Shifting Scenario
100% renew w/ storage LS
Result Summary Table Indicator Unit
Nominal Costs Renewables $ 294.40 M$NZ
Nominal Costs Biodiesel $ - M$NZ
Nominal Benefits $ 301.30 M$NZ
Net Value $ 6.90 M$NZ
Benefit Cost Ratio 1.02 B/C
Interest Rate 12.50% -
Project Length 15 Year
Average cost per kWh (all years) $ 0.84 $NZ
100% renew w/ storage LS
Source: %
Solar 48%
Wind 17%
Other 13%
Biodiesel 0%
Storage 23%
Total 101%
This is the least cost effective scenario mostly due to the high cost of using batteries to shift load. As
this scenario is almost 50 % solar – load shifting of some kind is needed to cover the night time load.
4.3.3 100 % by 2020; Biodiesel Scenario
This is a potentially viable scenario if biodiesel is available in the quantities required. A summary of
this scenario is shown below:
Te Aponga Uira 25 Proprietary
Economic Viability Report 19 September 2012Table 4-7: Summary Table for the Bio Diesel Scenario
100% renew w/ biodiesel
Result Summary Table Indicator Unit
Nominal Costs Renewables $ 103.27 M$NZ
Nominal Costs Biodiesel $ 58.06 M$NZ
Nominal Benefits $ 243.07 M$NZ
Net Value $ 81.74 M$NZ
Benefit Cost Ratio 1.51 B/C
Interest Rate 12.50% -
Project Length 15 Year
Average cost per kWh (all years) $ 0.59 $NZ
100% renew w/ biodiesel
Source: %
Solar 48%
Wind 18%
Other 12%
Biodiesel 23%
Storage 0%
Total 100%
Solar is a significant resource in this scenario followed by biodiesel at 23 % and wind at 18 %. The
total cost of the renewables and biodiesel are just over $160M. If biodiesel were available in quantity
on Rarotonga this could be an option. The Growers are exploring growing biodiesel from algae. It is
unknown at this point what volumes if any might be available. It is also unknown whether realistically
other global sources of bio diesel will be readily available to Rarotonga.
4.3.4 50 % 2015; 100 % by 2020 Renewables and Storage Mix with Biodiesel
This scenario is the most diverse – using solar ( both customer side and utility scale); utility and
community wind; wave, waste to energy, biodiesel, small hydro, small pumped storage, batteries, and
storage cooling to meet the Prime Minister’s goals. Total spending on renewables and storage is just
over $170 M.
Te Aponga Uira 26 Proprietary
Economic Viability Report 19 September 2012Table 4-8: Summary Table for Renewables and Storage Mix with Biodiesel
Renewables and Storage Mix with Biodiesel
Result Summary Table Indicator Unit
Nominal Costs Renewables $ 142.15 M$NZ
Nominal Costs Biodiesel $ 29.44 M$NZ
Nominal Benefits $ 286.10 M$NZ
Net Value $ 114.51 M$NZ
Benefit Cost Ratio 1.67 B/C
Interest Rate 12.50% -
Project Length 15 Year
Average cost per kWh (all years) $ 0.58 $NZ
Renewables and Storage Mix with Biodiesel
Source: %
Solar 49%
Wind 17%
Other 15%
Biodiesel 11%
Storage 8%
Total 100%
4.3.5 50 % 2015; 100 % by 2020 Renewables and Storage Mix no Biodiesel
This scenario is very similar to the previous scenario. It also is very diverse using solar (both
customer side and utility scale); utility and community wind, wave, waste to energy, small hydro,
small pumped storage, batteries, and storage cooling to meet the Prime Minister’s goals. Its’ cost is
higher at $186 M, but with slightly higher benefits.
Te Aponga Uira 27 Proprietary
Economic Viability Report 19 September 2012Table 4-9: Summary Table for Renewables and Storage Mix without Biodiesel
Renewables and Storage Mix without Biodiesel
Result Summary Table Indicator Unit
Nominal Costs Renewables $ 186.17 M$NZ
Nominal Costs Biodiesel $ - M$NZ
Nominal Benefits $ 315.21 M$NZ
Net Value $ 129.04 M$NZ
Benefit Cost Ratio 1.69 B/C
Interest Rate 12.50% -
Project Length 15 Year
Average cost per kWh (all years) $ 0.61 $NZ
Renewables and Storage Mix without Biodiesel
Source: %
Solar 41%
Wind 28%
Other 17%
Biodiesel 0%
Storage 15%
Total 101%
The two above scenarios are viable options as well as the recommended scenario. If the wind
resources suggested especially the offshore resources in the recommended scenario do not develop
these two scenarios provide an options for reaching the Prime Minister’s goal as well.
4.4 Comparing Scenario Results
A graphical presentation of the nominal results of the 6 presented scenarios is displayed below in
Figure 4.5. The bar chart shows the total benefits as well as the expenditures over the full 15 year
project length. Apart from the 50% renewables scenario and the biodiesel scenario all benefits are
roughly the same. Expenditures for the 50% scenario are the lowest, while expenditures of the third
scenario (using batteries for load shifting) are highest.
Te Aponga Uira 28 Proprietary
Economic Viability Report 19 September 2012Figure 4-5: Benefit Cost Results by Scenario
Benefit Cost Results by Scenario
350
300
250
200
Million $NZ
Benefits
150 Expenditures
100
50
-
50% renewables 100% renew w/ 100% renew w/ Renewables and Renewables and Recommended
biodiesel storage LS Storage Mix with Storage Mix without Scenario
Biodiesel Biodiesel
Figure 4-6 shows the net present value benefits and expenditures. The figure shows that all net
benefits and costs are smaller, due to the effect of the interest rate. However, there is no change in the
order of cost effectiveness. The only sign of outcome (- or +) for the 100% Renewable scenario with
storage for load shifting changes from positive to negative.
Te Aponga Uira 29 Proprietary
Economic Viability Report 19 September 2012You can also read


