ARM Mali Graphics Debugger v1.3.2 - User Guide ARM Limited 2013-2014. All rights reserved. Non-Confidential Last edited on: October 30, 2014
←
→
Page content transcription
If your browser does not render page correctly, please read the page content below
ARM® Mali™ Graphics Debugger
                       v1.3.2
                                User Guide
             © ARM Limited 2013-2014. All rights reserved.
                                         Non-Confidential

                          Last edited on: October 30, 2014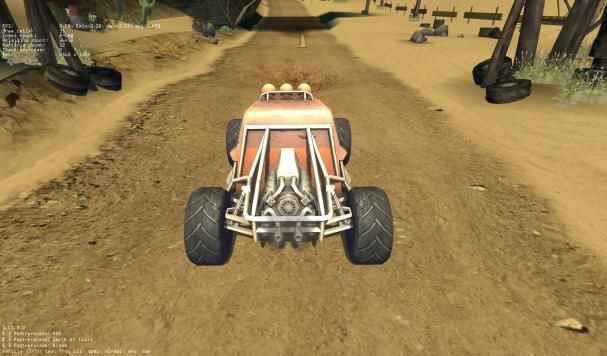
Mali Graphics Debugger v1.3.2 User Guide

Contents
1     Introduction .............................................................................................................................. 5
    1.1     Overview........................................................................................................................... 5
    1.2     Installation Package .......................................................................................................... 5
    1.3     Components ..................................................................................................................... 5
    1.4     This Release ..................................................................................................................... 5
2     Minimum Requirements ........................................................................................................... 6
    2.1     Host System Requirements .............................................................................................. 6
    2.2     Increasing Available Memory ............................................................................................ 6
    2.3     Target System Requirements ........................................................................................... 6
3     Host Installation ....................................................................................................................... 7
    3.1     Linux ................................................................................................................................. 7
    3.2     Windows ........................................................................................................................... 7
    3.3     Mac OS X ......................................................................................................................... 7
    3.4     Target Deliverables ........................................................................................................... 7
4     Target Installation .................................................................................................................... 8
    4.1     Overview........................................................................................................................... 8
    4.2     Linux ................................................................................................................................. 8
      4.2.1        Prerequisites .............................................................................................................. 8
      4.2.2        Installation ................................................................................................................. 8
      4.2.3        Run Instructions ......................................................................................................... 8
      4.2.4        Start the daemon ....................................................................................................... 8
      4.2.5        Start MGD GUI .......................................................................................................... 9
      4.2.6        Intercept the application ............................................................................................. 9
      4.2.7        Uninstalling ................................................................................................................ 9
    4.3     Android ............................................................................................................................. 9
      4.3.1        Prerequisites .............................................................................................................. 9
      4.3.2        Installation Instructions for Android 4.2 and 4.3.......................................................... 9
      4.3.3        Installation Instructions for Android 4.4 and 5.0........................................................ 10
      4.3.4        Run Instructions ....................................................................................................... 10
      4.3.5        Uninstalling .............................................................................................................. 10
    4.4     Troubleshooting .............................................................................................................. 11
      4.4.1        Target devices with no cp support............................................................................ 11
      4.4.2        No trace visible ........................................................................................................ 11
      4.4.3        Applications crash after installing MGD on Android 4.3 and below ........................... 11
      4.4.4        Frame Capture doesn’t work on Android 4.4 and above .......................................... 11
5     Getting Started with the Mali Graphics Debugger .................................................................. 13

Non-Confidential                                                                                                                                   2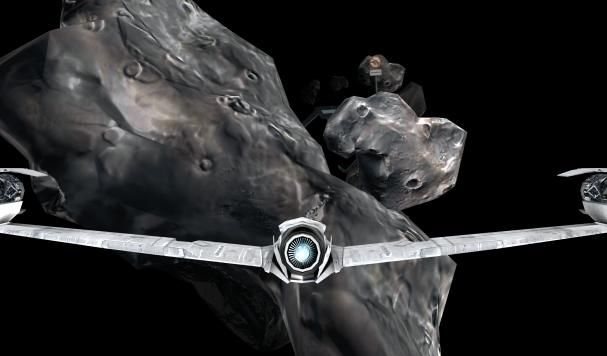
Mali Graphics Debugger v1.3.2 User Guide

    5.1     Running the Host GUI ..................................................................................................... 13
    5.2     Using the Mali Graphics Debugger on Your Application .................................................. 13
      5.2.1        Capturing a Live Trace............................................................................................. 13
      5.2.2        Pausing, stepping frames and resume ..................................................................... 13
      5.2.3        Capturing Framebuffer Content ............................................................................... 13
      5.2.4        Analyzing Overdraw ................................................................................................. 14
      5.2.5        Analyzing the Shadermap ........................................................................................ 14
      5.2.6        Overdraw and Shadermap limitations ...................................................................... 15
      5.2.7        Analyzing the Fragment Count................................................................................. 15
      5.2.8        Fragment Count Limitations ..................................................................................... 15
      5.2.9        Replaying a Frame .................................................................................................. 16
      5.2.10       Frame Replay Limitations ........................................................................................ 16
6     Exploring Your Application ..................................................................................................... 17
    6.1     API Function Calls .......................................................................................................... 17
    6.2     Trace Statistics ............................................................................................................... 17
    6.3     Trace Problems .............................................................................................................. 17
    6.4     Trace State ..................................................................................................................... 17
    6.5     Loaded Assets Tab ......................................................................................................... 17
      6.5.1        General Operations on Assets ................................................................................. 18
    6.6     Vertex/Fragment Shader Tabs ........................................................................................ 18
    6.7     Textures Tab................................................................................................................... 18
    6.8     Framebuffers Tab ........................................................................................................... 18
    6.9     Vertex Attributes Tab ...................................................................................................... 19
7     About the Implementation ...................................................................................................... 20
    7.1     OpenGL ES Conformance .............................................................................................. 20
8     Known Issues ........................................................................................................................ 21
    8.1     OpenGL ES Extensions .................................................................................................. 21
    8.2     Shading Language Version ............................................................................................. 21
    8.3     Shader Compiler ............................................................................................................. 21
    8.4     Performance ................................................................................................................... 21
    8.5     API Asset Coverage........................................................................................................ 21
    8.6     Tracing Multiple Processes ............................................................................................. 21
    8.7     Memory........................................................................................................................... 21
    8.8     Partial support for earlier trace versions .......................................................................... 22
    8.9     Maximum number of displayed vertex attributes ............................................................. 22
    8.10    GTK Warnings when closing MGD (Ubuntu only) ........................................................... 22
    8.11    Issues with texture and image output on 64-bit Linux host .............................................. 22

Non-Confidential                                                                                                                              3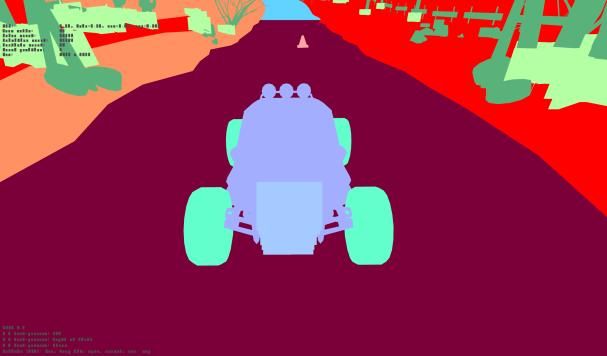
Mali Graphics Debugger v1.3.2 User Guide

    8.12      Issues viewing Khronos man pages ................................................................................ 22
    8.13      Temporary Hard Disk Space ........................................................................................... 22
    8.14      Intercepting without using LD_PRELOAD ....................................................................... 23
9     Changes from Previous Versions ........................................................................................... 24
    9.1       Changes between version 1.3.0 and 1.3.2 ...................................................................... 24
    9.2       Changes between version 1.2.2 and 1.3.0 ...................................................................... 24
    9.3       Changes between version 1.2.2 and 1.2.1 ...................................................................... 25
    9.4       Changes between version 1.2.1 and 1.2.0 ...................................................................... 25
    9.5       Changes between version 1.2.0 and 1.1.0 ...................................................................... 25
    9.6       Changes between version 1.1.0 and 1.0.2 ...................................................................... 28
    9.7       Changes between version 1.0.2 and 1.0.1 ...................................................................... 29
    9.8       Changes between version 1.0.1 and 1.0.0 ...................................................................... 30
    9.9       Changes in version 1.0.0 ................................................................................................ 31
10         Support .............................................................................................................................. 32
11         Legal .................................................................................................................................. 33
    11.1      Proprietary Notice ........................................................................................................... 33

Non-Confidential                                                                                                                                    4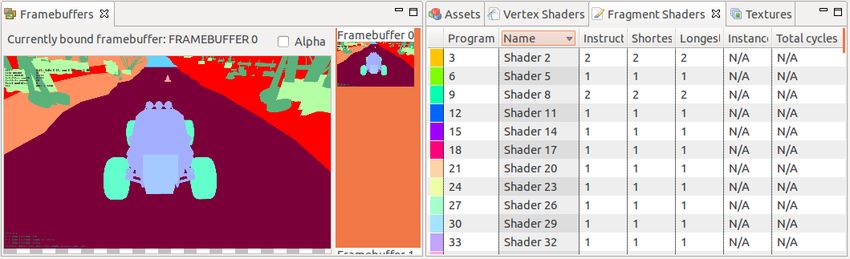
Mali Graphics Debugger v1.3.2 User Guide
1 Introduction
1.1 Overview
The Mali Graphics Debugger is a tool to help OpenGL® ES and OpenCL™ developers get the
best out of their applications through analysis at the API level. The tool allows the user to observe
OpenGL ES and OpenCL API call arguments and return values, and to interact with a running
target application so as to investigate the effect of individual calls on the target. Attempted misuse
of the API is highlighted, as are recommendations for improvement on a Mali-based system. Trace
information may also be captured to a file on one system and be analyzed later. The state of the
underlying GPU subsystem is observable at any point.
This document describes how to install and use the Mali Graphics Debugger on Windows, Linux
and Mac OS X®. It describes how to examine an OpenGL ES 2.0 or OpenGL ES 3.0 application
running on a Linux target or an OpenGL ES 2.0 application running on an Android™ target.
1.2 Installation Package
The installation package for the Mali Graphics Debugger contains everything you need to start
investigating OpenGL ES 2.0 or 3.0 applications on a desktop computer. Limited support for
OpenCL 1.1 is also provided.
You should have downloaded the installation package appropriate to your platform. The Mali
Graphics Debugger is available for Windows, Linux and Mac OS X, and comes in both 32-bit and
64-bit variants. Typically, you should download the package that most closely resembles your host
environment. If you aren't sure which package to choose, the 32-bit version will work across the
widest variety of platforms.
1.3 Components
The installation package contains three main components: the GUI application, the target intercept
components and Mali Graphics Debugger sample traces.
1.4 This Release
This is a minor release following the 1.3.0 release of the tool and provides the following
improvements:
Support for Android 5.0 “Lollipop”.
Non-Confidential 5
Mali Graphics Debugger v1.3.2 User Guide

2 Minimum Requirements
The Mali Graphics Debugger has a GUI that runs on a host system, and a shared library that
intercepts OpenGL ES 2.0, 3.0 and/or OpenCL calls made by an application running on a target
system. The two systems should allow network traffic to pass between them on port 5002. It is
possible for a single system to act both as host and target if it meets the criteria for both as set out
below.

2.1 Host System Requirements
Your host system should have Oracle Java installed at version 1.6 or later. The host should be
able to connect to the target via TCP/IP (for online analysis) and should have port 5002 open.
The installation requires 50MB of disk space.
Up to 2GB of RAM will be claimed by the installed application as it runs. If available, more memory
may be allocated to the application, which will allow larger traces to be accommodated.
Up-to-date operating system components and graphics drivers are recommended.

2.2 Increasing Available Memory
Increasing the amount of memory made available to the application will increase the maximum
trace size that may be accommodated. To do this, locate the mgd.ini file within the application
installation and open it with a text editor. Find the Java Virtual Machine (JVM) argument starting
with ‘-Xmx…’. The number that follows the argument defines the maximum amount of memory that
the application will claim when running, with a trailing ‘m’ for megabytes. This number can be
increased to match the capabilities of your system. Please note the format for the argument and
ensure that your modifications follow the same format exactly (i.e. no spaces, trailing lower-case
‘m’). The number you enter must be a multiple of 4.

2.3 Target System Requirements
In general, the Mali Graphics Debugger should work on any Linux system that supports OpenGL
ES 2.0 or OpenGL ES 3.0. Limited support is provided in this release for OpenCL 1.1. The system
should be able to substitute the existing OpenGL ES or OpenCL system libraries with the supplied
intercept libraries. The specific method for doing this is platform-specific.
In addition the application supports Android™ 4.2, 4.3, 4.4 and 5.0 on the Google Nexus 10
platform (only OpenGL ES 2.0). Other platforms should also work correctly although these have
not been tested.
MGD is supported only on target systems using an ARM Mali GPU.

Non-Confidential                                                                                           6
Mali Graphics Debugger v1.3.2 User Guide
3 Host Installation
3.1 Linux
On Linux, the Mali Graphics Debugger is provided as a gzipped tar archive that can be extracted to
any location on disk. This package can be extracted using any modern version (i.e. > 1.13) of GNU
tar:
tar xvzf Mali_Graphics_Debugger_v1.3.2._Linux_.tgz
The GUI executable is ‘mgd’ within the gui directory.
3.2 Windows
On Windows, the Mali Graphics Debugger is provided as an executable installer package. To
install the software, run the installer and follow the instructions on screen. A link to the installed
GUI will be added to the Start menu.
3.3 Mac OS X
On Mac OS X, the Mali Graphics Debugger is provided as a dmg package. It can be mounted by
double-clicking on it. The GUI executable is ‘mgd’ within the gui directory and can be launched
either from the dmg package or from the local filesystem after copying the mounted folder to the
local disk.
On Mac OS X version 10.9 (Mavericks) and later, the system will prevent you from running MGD
as the package is not signed. The workaround is to hold the CTRL key down when opening the
app.
3.4 Target Deliverables
The extracted directory hierarchy on the host will contain a ‘target’ directory containing the
following additional directories:
arm_fbdev
Containing daemon and libraries for Linux-based ARM target devices.
armhf_fbdev
Containing daemon and libraries for Linux-based ARM Hard Float target devices.
arm_android
Containing daemon and libraries for Android-based target devices.
Note: you will be required to manually add the libraries to your execution environment, see below
for details.
Non-Confidential 7Mali Graphics Debugger v1.3.2 User Guide 4 Target Installation 4.1 Overview The Mali Graphics Debugger has two target components that interact to collect and transmit trace information from your application to the GUI on the host. These two target components are: Intercept Library: The intercept library intercepts calls made by your application to one of the supported libraries and collects information about each call as it is made on the underlying system. The intercept library needs to be loaded before your application starts. Daemon: The daemon application collects trace data from all running, intercepted applications and passes this data to the host. All data is transferred using TCP/IP using port 5002. The method for using these components varies by target platform. Instructions for each supported platform are defined below. 4.2 Linux 4.2.1 Prerequisites A running OpenGL ES or OpenCL application. A network connection to a host running the MGD GUI. The target device should permit TCP/IP communication on port 5002. 4.2.2 Installation Navigate to the target directory and enter either the arm_fbdev folder (soft float implementation) or armhf_fbdev (hard float implementation) according to the configuration of your system. Inside this folder there should be the following: libinterceptor.so mgddaemon libEGL.so libGLESv2.so libOpenCL.so These files need to be copied to the target device. The location of the files does not matter as they should be able to run anywhere as long as the user has sufficient privileges. The execute permission bit needs to be set on the mgddaemon application. This can be done using the following command from the directory on the target to which the files were copied. chmod +x ./mgddaemon 4.2.3 Run Instructions To capture traces into MGD the user needs to do the following: 1) Start the daemon running if not already started. 2) Start a capture from the MGD GUI. 3) Start your application with the intercept libraries enabled. 4.2.4 Start the daemon The daemon should be started before you run your first trace. In a terminal, run: ./mgddaemon & Non-Confidential 8
Mali Graphics Debugger v1.3.2 User Guide from the directory you which you copied the daemon. The daemon can remain running for the duration that MGD is being used, and will handle applications starting and stopping. 4.2.5 Start MGD GUI Once the daemon has started connect the MGD GUI to the target by starting a capture. 4.2.6 Intercept the application To intercept the application correctly the system needs to preload the intercept library libinterceptor.so, in the MGD target distribution. To do you need to define the LD_PRELOAD environment variable to point at this library. For example: LD_PRELOAD=/path/to/intercept/libinterceptor.so ./your_app When the application starts, trace data should start to fill the trace window on the MGD GUI. If you are unable to use LD_PRELOAD on your system there is an alternative; see Section 8.14 for more information. 4.2.7 Uninstalling To uninstall simply remove the files which were loaded onto the target. 4.3 Android 4.3.1 Prerequisites Android Developer Tools (ADT) installed on a machine that connects to the Android device. PATH should include the path to the adb binary. The target device should be rooted and allow modification of the /system partition. The target device should permit TCP/IP communication on port 5002 4.3.2 Installation Instructions for Android 4.2 and 4.3 Run the following commands from a host command line from the target/arm_android directory located in installation directory of the MGD tool. adb shell su -c mount -o remount /system adb push libGLES_mgd.so /sdcard/ adb push mgddaemon /sdcard/ adb shell # The following commands run on the target su cd /sdcard/ cp mgddaemon /system/bin/mgddaemon chmod 777 /system/bin/mgddaemon cp libGLES_mgd.so /system/lib/egl/libGLES_mgd.so chmod 777 /system/lib/egl/libGLES_mgd.so cp /system/lib/egl/egl.cfg /system/lib/egl/egl.cfg.bak echo "0 0 mgd" > /system/lib/egl/egl.cfg The name of the application that should be traced should have its name written in /system/lib/egl/processlist.cfg. It is highly recommended that only a single application is Non-Confidential 9
Mali Graphics Debugger v1.3.2 User Guide
traced at any one time, but the processlist.cfg file may contain a list of process names separated
by a newline character. For convenience, the interceptor will print the name of any processes
which link against GLES to logcat, so the name of the process can be found in this way. For
example the line in logcat will read:
“Process = com.arm.mali.Timbuktu”, in which case your processlist.cfg file should contain
a single line: com.arm.mali.Timbuktu
Note: If you do not have a processlist.cfg file in the right place on your system, then the interceptor
will gather trace data from all running GLES applications. If you have more than one GLES
application running in this case then the debugger state presentation will not be reliable.
Once the steps above have been completed all subsequently opened applications will pass all
GLES/EGL calls through libGLES_mgd.so. To revert this, run the following on the target:
cp /system/lib/egl/egl.cfg.bak /system/lib/egl/egl.cfg
Note: If an application is started before the installation instructions above are executed, then the
application will not have loaded the interceptor library, and no tracing will occur.
4.3.3 Installation Instructions for Android 4.4 and 5.0
Android 4.4 uses a different mechanism to load the OpenGL ES and EGL libraries and the
configuration file /system/lib/egl/egl.cfg is no longer relevant.
To make Android load the MGD intercept library before the system library, the intercept library
must be named /system/lib/egl/libGLES.so. Usually there will not be any library with that
name on the system, so it is sufficient to:
follow the same instructions in 4.3.2 for installing the MGD deliverables on the target
system (modifying egl.cfg is not necessary)
create a symbolic link by running the following on the target:
ln -s /system/lib/egl/libGLES_mgd.so /system/lib/egl/libGLES.so
Once libGLES.so is installed, the system has to be restarted in order to load the new library.
Note: the mgddaemon process should be started after the graphics system has been loaded and
just before running the application to debug otherwise all the Android processes will be intercepted
by MGD.
4.3.4 Run Instructions
If you wish for MGD to connect to the daemon over USB, then you will need to run the following on
the host:
adb forward tcp:5002 tcp:5002
Next ensure you are running the daemon. In a terminal, run:
adb shell
su
mgddaemon
Now in MGD you can connect to the IP of the target, or to 127.0.0.1:5002 if using USB, and start
you application.
4.3.5 Uninstalling
To uninstall MGD you should do the following:
# Restore the old egl.cfg file
Non-Confidential 10Mali Graphics Debugger v1.3.2 User Guide
cp /system/lib/egl/egl.cfg.bak /system/lib/egl/egl.cfg
rm /system/bin/mgddaemon
rm /system/lib/egl/libGLES_mgd.so
The target device should then be rebooted to allow the original libraries to be reloaded.
4.4 Troubleshooting
4.4.1 Target devices with no cp support
On systems that do not have cp, you can instead use cat on the target, e.g:
cat /sdcard/libGLES_mgd.so > /system/lib/egl/libGLES_mgd.so
4.4.2 No trace visible
The interceptor component on the target reports through logcat on Android. If no trace is found
then it is advisable to review the logcat trace. Generally you should:
[Linux] Ensure that the interceptor library is in your PRELOAD path.
[Android 4.3 and earlier] Ensure that the egl.cfg file has been correctly modified.
[Android 4.4 and later] The system has to be fully restarted to load the intercept library.
Ensure you force close and reopen your application after installing the interceptor, to
ensure the interceptor is loaded.
Ensure the daemon is started before the application.
Ensure your application is making OpenGL ES or OpenCL calls.
4.4.3 Applications crash after installing MGD on Android 4.3 and below
Certain Android devices require that MGD be installed as multiple libraries. So instead of a single
/system/lib/egl/libGLES_mgd.so you must have /system/lib/egl/libGLESv1_CM_mgd.so,
/system/lib/egl/libGLESv2_mgd.so, and /system/lib/egl/libEGL_mgd.so. If, after following
the installation instructions in section 4.3.2, your Android applications start crashing, it’s possible
that your Android system is looking for several libraries instead of the single MGD library you’ve
installed. To check if this is the case and to resolve the problem, try running the following:
adb shell
# The following commands run on the target
su
mount -o remount /system
cd /system/lib/egl
ln -s libGLES_mgd.so libEGL_mgd.so
ln -s libGLES_mgd.so libGLESv2_mgd.so
ln -s libGLES_mgd.so libGLESv1_CM_mgd.so
chmod 777 *
This will create the required libraries as links to the main MGD library.
4.4.4 Frame Capture doesn’t work on Android 4.4 and above
If you find that the frame capture feature of MGD is not working on an Android 4.4 (or above)
device, it may be because the application is manually loading the graphics libraries based on the
information in /system/lib/egl/egl.cfg. To check if this is the case and to resolve the problem,
try to move /system/lib/egl/egl.cfg by running the following commands:
Non-Confidential 11Mali Graphics Debugger v1.3.2 User Guide adb shell # The following commands run on the target su mv /system/lib/egl/egl.cfg /system/lib/egl/egl.cfg.bak Non-Confidential 12
Mali Graphics Debugger v1.3.2 User Guide 5 Getting Started with the Mali Graphics Debugger 5.1 Running the Host GUI Run the application: On Windows by double-clicking the MGD icon. On Linux by running /path/to/installation/gui/mgd & On Mac OS X by double-clicking the MGD icon inside the gui directory. The main window should open. Load one of the supplied sample traces from /path/to/installation/samples using File- >Open, or using the toolbar button. The various application windows should fill with information from the loaded trace that you may examine at will. 5.2 Using the Mali Graphics Debugger on Your Application Before running your application, ensure that the supplied daemon application is running and that the appropriate interception libraries are in place. Instructions on how to do this can be found in the Target Installation section of this manual. Note that it is not necessary to rebuild your application to enable tracing. 5.2.1 Capturing a Live Trace Select Debug->Set Target IP… and review the target connection details. Ensure that port 5002 is open to allow the daemon to transfer data to the host application. With both target and host applications running as before, start a live capture by pressing the toolbar button. The GUI should show the trace captured dynamically from the target. When ready, stop the capture by pressing the toolbar button. 5.2.2 Pausing, stepping frames and resume The application can be paused by pressing the button; the application will be halted at the final eglSwapBuffers() call to allow you to examine the result. Once paused, individual frames can be rendered on target by stepping with the button. The application may be resumed by pressing the button. Note that only the threads that are calling the graphics API functions will be paused. 5.2.3 Capturing Framebuffer Content Whilst executing, it is possible to perform an in-depth capture of the output from the graphics system on a draw-by-draw basis. Press the button to take a snapshot of framebuffer content following each draw call in the next full frame of the application. Note that this involves considerable work in composing and transferring data that will slow the application down considerably. In order to capture subsequent frames you will need to pause the application with the button. Once paused, proceed by pressing the button for each frame that needs capturing. Non-Confidential 13
Mali Graphics Debugger v1.3.2 User Guide

5.2.4 Analyzing Overdraw
MGD has the ability to show overdraw in a given scene. Whilst capturing a live trace press the
button. MGD will now replace the fragment shader in the target application with an almost
transparent white colored fragment shader. Each time a pixel is rendered to the framebuffer the
alpha value is increased via an additive blend, meaning the whiter the final image appears the
more overdraw happens in that area.

                 Original Image                         Image with overdraw feature turned on

An application with low levels of overdraw should appear to be a uniform dull grey.

5.2.5 Analyzing the Shadermap
MGD has the ability to give each shader program in use in a given scene a different solid color.
Whilst capturing a live trace, press the   button. This allows the shader in use by each object in
the scene to be identified, and allows detection of any bugs that may be caused by incorrect
shader assignment. An example of this feature is displayed below:

                 Original Image                        Image with shader map feature turned on

There are 100 unique colors that can be assigned to shader programs, at which point programs
will have duplicate colors. The program that corresponds to a color can be identified by matching
the color in the scene with the color shown in the shader views, as shown below. Alternatively you
may position the cursor over a captured framebuffer image (captured in shadermap mode) and the
active shader will be identified above the image.

Non-Confidential                                                                                     14
Mali Graphics Debugger v1.3.2 User Guide 5.2.6 Overdraw and Shadermap limitations Applying any full screen post processing effects, for example rendering to a texture, will prevent the overdraw map or shadermap from displaying correctly on the device. However, the information can be seen by switching to the correct framebuffer in the UI after capturing a frame while either feature is active. 5.2.7 Analyzing the Fragment Count MGD has the ability to count the number of fragments processed by a shader per draw call. If depth testing is enabled and a fragment would be excluded as a result, then that fragment will not be included in the count. To toggle this feature, click the button. When enabled, each draw call will increment the “Instances run” field of the fragment shader used to draw it. The fragment count represents the number of fragments that have been rendered with the selected shader in the current frame up to, and including the currently selected draw call. An example of this feature is shown below. The “Total cycles” field is calculated using the average number of cycles for a given shader multiplied by the number of fragments processed. Note: the two columns ‘Instances run’ and ‘Total cycles’ will only be available for those frames where the fragment count analysis has been requested. These columns will indicate ‘N/A’ (not available) for other frames. 5.2.8 Fragment Count Limitations To maintain compatibility with older OpenGL ES 2.0 hardware and software, this feature uses a software method to count the number of fragments. As a result, a single draw call can take several Non-Confidential 15
Mali Graphics Debugger v1.3.2 User Guide seconds to complete. In addition, the target device screen will show only the final draw call in a frame, and the frame capture feature will not show any usable information. 5.2.9 Replaying a Frame MGD has the ability to replay certain frames, depending on what calls were in that frame. To see if a frame can be replayed you must pause you application in MGD. Once paused, if a frame can be replayed, the button will be enabled. Clicking this button will cause MGD to reset the OpenGL ES state of your application back to how it was before the previous frame had been drawn. It will then play back all the function calls in that frame. This feature can be combined with the Overdraw, Shadermap, and Fragment Count features. You can, for example, pause you application in an interesting position, activate the Overdraw mode and then replay the frame. The previous frame will be replayed exactly as before but with the overdraw mode enabled. You can repeat this process with the other modes enabled to get a complete picture for a single frame. 5.2.10 Frame Replay Limitations Frame replay will be disabled if the frame you want to replay: creates or deletes any OpenGL ES/EGL objects, changes state that had not previously been changed, is not complete (i.e. no eglSwapBuffers call), has calls from multiple threads/contexts, calls various unsupported functions. More information about exactly why frame replay is disabled for a particular frame can be found in the Console View in MGD. Non-Confidential 16
Mali Graphics Debugger v1.3.2 User Guide

6 Exploring Your Application

6.1 API Function Calls
The main editor window shows a table of function calls made by your application as it is running.
Use this to examine exactly what your application was requesting of the graphics system and what
that system returned.
Each call has the time at which it was made, the list of arguments sent to the call and the value (if
any) returned by the underlying system when the function was called. Note that some columns in
this table may be initially hidden – right click in the table to enable or disable columns.
The overview window shows a frame-oriented view of the trace. Each frame is delimited by a call
to eglSwapBuffers(). Selecting an item in the overview will highlight the corresponding item in
the main trace.
Double-clicking on an API call will open a browser page showing the documentation for that
function (if available).

6.2 Trace Statistics
This window shows a selected summary of the trace as a whole. Use this to gain an overview of
the state of your application as it ran.

6.3 Trace Problems
This window shows problems that were detected with one or more API calls as they were made.
These problems can include improper use of the API (passing illegal arguments, for example) or
issues known to adversely impact performance. Use this view to improve the quality and
performance of your application.
Selecting an entry in this view will highlight the offending issue(s) within the trace view. Hover your
cursor over the problem report to gain a more detailed view of the problem.

6.4 Trace State
This view shows the state of the underlying system at a time following the function selected in the
trace view, and is updated as the trace selection changes. Use this to explore how the system
state changes over time and the causes of that change.
The initial state is shown as an entry in normal type. If the relevant API standard defines an initial
state then this will be shown, otherwise  will appear instead.
If a state item has changed then its value will be shown in bold type. The function call that made
the change can be located by selecting ‘Select Previous Change Location’ from the right click
menu on the state item. The function call that next changes a given state item can be located in a
similar way.
The state items affected by the currently selected function are highlighted in the view and in the
navigation strip to the right of the view.

6.5 Loaded Assets Tab
This view shows those items currently reserved or allocated by calls to the graphics system, and
includes textures, shaders, framebuffers and EGL context values. Use this to explore what your
application has loaded and what is currently active.

Non-Confidential                                                                                     17
Mali Graphics Debugger v1.3.2 User Guide
The Assets tab shows a tree of asset items (if any) as loaded by API calls up to and including the
currently selected function. Selecting any item within the tree will show a preview of the item if
available.
6.5.1 General Operations on Assets
The following operations are available on an asset item wherever it appears in the GUI:
Asset items shown in normal type are known to the system, but are not currently bound.
Assets shown in bold type are those currently bound and in use.
Double clicking an asset item will show a larger view of the item.
The right click menu on an asset item allows you to locate where the asset was either
created or modified.
6.6 Vertex/Fragment Shader Tabs
These are an alternative tabular view of all currently loaded shaders. For each shader various
cycle counts are shown allowing you to identify which shaders are most costly.
Active shaders are shown in bold type as before.
6.7 Textures Tab
This shows an alternative tabular view of all currently loaded textures and includes information on
their size and format. Use this to visualize the images that you have loaded into the system.
Loading textures is done using an external program: note that for larger traces the application can
take a short time to convert and display all textures. The following texture formats are currently
supported:
GL_COMPRESSED_RGBA8_ETC2_EAC
GL_COMPRESSED_RGB8_ETC2
GL_ETC1_RGB8_OES
GL_LUMINANCE
GL_ALPHA
GL_RGBA4
GL_RGBA with type GL_UNSIGNED_BYTE or GL_UNSIGNED_SHORT_4_4_4_4
GL_RGB with type GL_UNSIGNED_BYTE
GL_COMPRESSED_RGBA_ASTC_*_KHR
GL_COMPRESSED_SRGB8_ALPHA_ASTC_*_KHR
6.8 Framebuffers Tab
This view shows the content of any framebuffers loaded at the currently selected point in the trace
but only if a framebuffer capture has been successfully executed on the target. Use this to gain an
insight into what the graphics system has produced as a result of your application calls.
The view shows the bound framebuffer as a large image, with a series of smaller images
representing the other buffers available to the system. For a captured frame it is possible to step
through the sequence of draw calls for that frame one at a time and observe how the final scene is
constructed.
Non-Confidential 18Mali Graphics Debugger v1.3.2 User Guide 6.9 Vertex Attributes Tab This view shows the values of the vertex attributes that are passed to the vertex shader when a ‘draw’ call happens. Therefore, vertex attributes are visible only when a ‘draw’ call such as glDrawArrays or glDrawElements is selected in the trace. If GL_ELEMENT_ARRAY_BUFFER_BINDING or GL_ARRAY_BUFFER_BINDING is set, the corresponding buffer object will be used to provide the values. Non-Confidential 19
Mali Graphics Debugger v1.3.2 User Guide

7 About the Implementation
The Mali Graphics Debugger works by intercepting each OpenGL ES or OpenCL call made by the
application under test. Once intercepted, call arguments are logged before they are passed
transparently to the existing OpenGL ES or OpenCL library. The logged data is collected and
passed to the host via a daemon running on the system.

7.1 OpenGL ES Conformance
This product is based on a published Khronos Specification. Under normal trace conditions no
changes are made to the stream of calls made by the application on the existing OpenGL ES
implementation and therefore should not affect the conformance status of that implementation.

Non-Confidential                                                                                20
Mali Graphics Debugger v1.3.2 User Guide
8 Known Issues
8.1 OpenGL ES Extensions
Generally, known OpenGL ES extensions will appear in the trace, but will not have an effect on the
trace or asset state.
8.2 Shading Language Version
The host application supports syntax-highlighting of shaders from OpenGL ES 3.0 and before.
There is support for Open CL kernel source but this is currently limited to a plain text view.
8.3 Shader Compiler
The system uses a built-in version of the Mali Offline Shader Compiler to determine vertex
and fragment shader cycle counts. These cycle counts will only be correct for Mali 400
devices running r2p4 drivers, however, other Mali-400 devices are likely to offer similar
counts.
The shader compiler currently only supports OpenGL ES 2.0 shaders at present. No cycle
counts will be displayed for other shader versions.
8.4 Performance
The Mali Graphics Debugger aims to be as unobtrusive as possible. However, there is a
performance impact imposed by the gathering and sending of trace data to the host. This is
particularly pronounced when you request a snapshot of a frame as this causes pixel read-back
calls to be inserted by the interceptor after each draw call.
The interceptor library performance has been improved: the library now has negligible impact on
application performance when not tracing.
8.5 API Asset Coverage
There is currently no support for most API extension functions or enumerations
Not all asset types are covered at present
Not all texture types/formats are currently supported
8.6 Tracing Multiple Processes
If multiple applications are traced simultaneously then the trace shown in the GUI will contain
function calls from all applications together. The trace state will then be a combination of the state
from all applications that is likely to be misleading. Advice on this issue can be found in the Target
Installation section of this manual.
8.7 Memory
Capturing for long periods of time or attempting to capture many framebuffer and/or other images
is very expensive on memory. If a memory shortage is detected an active trace may be terminated
to protect the system. See Section 2.2 above for advice.
Non-Confidential 21Mali Graphics Debugger v1.3.2 User Guide 8.8 Partial support for earlier trace versions As new features are being added to the Mali Graphics Debugger, the data format of the saved traces is updated. We aim to support opening and visualizing traces captured with an earlier version of the tool but we cannot guarantee full functionality with older traces. The best solution is to update the Mali Graphics Debugger software on both target and host and re-trace the application. 8.9 Maximum number of displayed vertex attributes The Vertex Attributes view is able to display up to 32 different vertex attributes. If an application is using more than 32 vertex attributes the remaining ones are captured and stored in the trace file but not displayed. 8.10 GTK Warnings when closing MGD (Ubuntu only) Occasionally on closing the application the system will show errors from the GIMP Toolkit (GTK) similar to the following: LIBDBUSMENU-GTK-CRITICAL **: watch_submenu: assertion `GTK_IS_MENU_SHELL(menu)' failed (Mali Graphics Debugger:3989): LIBDBUSMENU-GLIB-WARNING **: Trying to remove a child that doesn't believe we're it's parent. These are believed to relate to issues within GTK itself: they are widely reported and are believed to be harmless. 8.11 Issues with texture and image output on 64-bit Linux host Mali Graphics Debugger requires that the 32-bit version of libjpeg62 be available on your system. On certain distributions, this is not there by default. On Ubuntu, this can be installed using the following command: sudo apt-get install libjpeg62:i386 8.12 Issues viewing Khronos man pages Depending on your particular platform, you may or may not be able to correctly view the Khronos man pages when double clicking functions. This is particularly an issue for Windows which uses Internet Explorer. This unfortunately is outside of our control, as it is an incompatibility between the Khronos man page format, and the platform default browser. 8.13 Temporary Hard Disk Space During normal operation Mali Graphics Debugger uses a large amount of temporary disk storage. If there is not enough storage space available in the system temporary directory many error messages will be displayed and MGD can crash. The temporary directory used for MGD can be modified by adding the following line to the mgd.ini text file in the installation directory, after the -vmargs entry: -Djava.io.tmpdir= Non-Confidential 22
Mali Graphics Debugger v1.3.2 User Guide

8.14 Intercepting without using LD_PRELOAD
In some cases it may not be possible to use LD_PRELOAD (for example, LD_PRELOAD is already
being used for another purpose). In this case you need to define both LD_LIBRARY_PATH and
MGD_LIBRARY_PATH, as follows:
  LD_LIBRARY_PATH=/path/to/intercept/dir/:$LD_LIBRARY_PATH
  MGD_LIBRARY_PATH=/path/to/original/drivers/dir/
In this case, the /path/to/intercept/dir/ should be the directory on the target where the installation
files were copied. Typically this contains libinterceptor.so, libGLESv2.so, libEGL.so etc.
The /path/to/original/drivers/dir/ should contain the pre-existing libGLESv2.so, libEGL.so files from
the graphics driver installation.
LD_PRELOAD need not be defined when using this method.
When a graphics application runs, the MGD intercept libraries are loaded from the
LD_LIBRARY_PATH first. These intercept libraries dynamically load the original graphics libraries
from the MGD_LIBRARY_PATH location as required.

Non-Confidential                                                                                         23
Mali Graphics Debugger v1.3.2 User Guide

9 Changes from Previous Versions

9.1 Changes between version 1.3.0 and 1.3.2
The following summarizes the changes made in this issue.
Issue          Summary
[MGD-1475]     Support for Android 5.0

9.2 Changes between version 1.2.2 and 1.3.0
The following summarizes the changes made in this issue.
Issue          Summary
[MGD-504]      The results of glGetError are now show for every call
[MGD-246]      Added “Step” feature to allow stepping through frames on the target
[MGD-896]      Traces are now in a binary format to increase performance
[MGD-282]      Added a feature in the Vertex Attribute View to visualise sparse vertex indices.
               Also added a warning if the vertex indices are too sparse.
[MGD-1024]     Added support for replaying frames which don’t create or destroy state
[MGD-297]      Shader cycles statistics are now calculated for ‘Midgard’ based devices
[MGD-263]      Double-clicking an MGD trace file now opens MGD (Windows only)
[MGD-900]      Search function is faster
[MGD-1000]     MGD is more responsive when selecting the last frame in a big trace
[MGD-1001]     MGD no longer runs out of memory after opening and closing several trace files
[MGD-1092]     Fixed Shader View sorting when using “Show create location”
[MGD-241]      String arguments are now shown instead of the pointer value in the Trace View
[MGD-1121]     The Vertex Attribute View is now correct when the minimum vertex index is >0
[MGD-1138]     Fixed Shaders View so it shows shaders correctly before they’ve been linked
[MGD-1155]     Added EGL parameters are in the Assets View
[MGD-146]      Stopped context being lost in the Outline View when selecting a call other than
               glDrawElements
[MGD-1104]     Fixed shadermaps so they use the same shader number as API calls
[MGD-1096]     In a multi-context trace, the trace problems are now correct
[MGD-1094]     Constants are now correctly displayed for glClear
[MGD-65]       Texture formats for T-Rex HD are now correct
[MGD-1066]     Stopped UI locking up while saving traces
[MGD-831]      Attaching a texture to a channel of an FBO now detaches whatever is currently
               bound
[MGD-1091]     Added support for BGRA textures
[MGD-1079]     Framebuffer view is now cleared when trace file gets closed

Non-Confidential                                                                                  24
Mali Graphics Debugger v1.3.2 User Guide
[MGD-1065] Stopped UI locking up when connecting to a non-existing IP address
[MGD-1015] “Show create location” / Show last modification now works for Shader Views
[MGD-997] It is no longer possible to close main application window when Open File dialog is
open
[MGD-1071] Asset view selection is no longer cleared when stepping backwards through the
trace
[MGD-1068] Stepping through draw calls no longer resets the asset table
[MGD-1036] Fixed a NullPointerException which was thrown after reopening the Assets View
[MGD-903] Stopped the framebuffer view of other open traces being cleared when you close a
trace
[MGD-2] Cancelling file read no longer results in Stream Closed error
[MGD-888] Traces can be exported to a text file
[MGD-210] Trace file highlights can now be removed once set
[MGD-947] Function arguments now display correct enumeration values
[MGD-935] Fixed java.util.ConcurrentModificationException thrown while tracing GFXBench
9.3 Changes between version 1.2.2 and 1.2.1
The following summarizes the changes made in this issue.
Issue Summary
[MGD-1012] Fixed unique indices count.
[MGD-231] Support for Android KitKat 4.4.
9.4 Changes between version 1.2.1 and 1.2.0
The following summarizes the changes made in this issue.
Issue Summary
[MGD-935] Fixed java.util.ConcurrentModificationException.
[MGD-197] Show framebuffer pixel information.
[MGD-922] Eliminate memory-free error on interceptor closedown.
[MGD-921] Fix for interceptor segfault on GFXBench3 (PBO).
[MGD-907] Handle Unicode characters in shader sources.
9.5 Changes between version 1.2.0 and 1.1.0
The following summarizes the changes made in this issue.
Issue Summary
[D905] Allow binary shaders to be debugged. All apps will fall back to compiled shaders.
[D852] Added end to end tests for fragment count
Non-Confidential 25Mali Graphics Debugger v1.3.2 User Guide
[D837] Handle click on empty framebuffer image. Previously the app would throw a generic
warning if an empty framebuffer was double-clicked.
[D887] Suppress multiple error dialogs. These were produced when trying to read a texture
without the appropriate decoder. Only one report is now produced for each failing
decoder.
[D463] Shaders view shows a fragment count for each shader
All frames now start with eglSwapBuffers. Previously this call was included at the end
of a frame. This change improves application consistency.
Add an 'empty message' to the framebuffers view.
[A860] Fixed exception thrown when calculating shader statistics.
[A876] Add armhf_fbdev in the installer
[A873] Fix workbench save/restore with new versions.
[D3] Fixed vertex and fragment views being empty after shader deletion Shaders are
shown next to their bound program in the shader views There may be duplicate
shaders, as a shader can be bound to multiple programs After a shader is deleted, the
shader is shown greyed out if still attached Vertex shaders in the vertex shader view
also now have a colour
Add framebuffer size in the tooltip
[D335] README_linux and README_android merged into user guide Added target
installation content to the userguide Deleted README_android and README_linux
[D844] Daemon now reports version during start up
[D852] Updated user documentation. Also improved the messages that a daemon produces
when it starts up. Includes updates to user guide and code to better document the use
of port 5002.
[D859] Adding Android ASTC support
All mga references become mgd
Changed test trace file extension to mgd.
Fix frame and draw call index numbers in stats view. These were one-out.
Adding ASTC decoding to GUI.
[D854] Changed Linux installer extension to tgz. This simplifies publishing.
[D160] Renaming State view 'State' column to 'State Item'
[D836] Renaming samples to have a .mgd extension
Show colors in the shaders view.
[D838] Close process streams after use. These were no being closed, and so were
accumulating until the system ran out of descriptors.
Rename Trace Problems view
[A753] Clear frame image when model unloads.
[D12] Show multiple texture formats/types only if they are different.
[D34] Overdraw map now supports GLES3 shaders (Timbuktu works)
[D63] Add status line with progress report for background jobs.
[A595] Fix 'task already scheduled or canceled' when closing and re-opening stats view.
Non-Confidential 26Mali Graphics Debugger v1.3.2 User Guide
[A801] Fix exception when cancelling a file open action.
[A788] Inform the user when the connection to the target is broken
[A793] change extension to .mgd
[A722] Better message for broken URLs in help lookup.
Fix opening a file shows up as dirty.
[A815] Add title to vertex attribute index column.
Hide the filmstrip panel if no screenshots are available.
Display screenshots in the left pane in the GUI.
[A760] Saving now updates tab. And you can differentiate between save and save as.
Adding single-step function.
Fixing interaction between pause and framebuffer requests.
Improve image drawing, remove unnecessary images.
Add support for RGB and RGB565 formats for framebuffers.
Enable O3 optimization in the Android build.
[A794] Message when texture cannot be displayed externally.
Implemented overdraw map
[A834] Fix bug calculating shader cycle average.
[A779] Vertices per draw call and frame now show Unique vertices as well
[A834] Add vertices count to shader stats.
[A284] Selecting frame selects last call in frame. Previously the first call would be selected.
Will allow us to more easily present per-frame information.
Enable all the basic texture formats.
Add GL_ALPHA texture format as grayscale image.
Revised error handling. All LOGE or LOGI statements now terminate with \n
(previously there was a mix). All exit() calls are now made with a non-zero value if
indicating failure.
Implemented core GLES3 vertex attrib types
[A727] Updated User Guide. Updated known-issues section to contain information on the
Khronos manual page issues.
Added mgd.ini option to substitute vendor
Renaming start/stop to connect/disconnect. This better reflects what these
commands actually do, and helps towards separating the start/stop controls.
Added LD_LIBRARY_PATH/MGD_LIBRARY_PATH interception method By
naming/symlinking MGD appropriately, MGD can be placed in the
LD_LIBRARY_PATH variable, and the library path to forward calls to can then be
specified by passing the environment variable MGD_LIBRARY_PATH. This method is
safer than LD_PRELOAD, and can be used with other tracers.
Improved interceptor to support more drivers
Included updated GLES/glext.h
Updated size of bitfields in CL definition.
Non-Confidential 27Mali Graphics Debugger v1.3.2 User Guide
Add to the trace a timestamp showing the time before/after each function call.
Stop up-scaling the FB images if they are already smaller than the canvas.
[A762] Fixed find on a live trace
Added armhf build to bundle
Updated emulator to load libGLES from same dir Now loads libGLES* from same
directory as libEGL, rather than using LD_LIBRARY_PATH, which was causing some
trouble previously.
[A758] Fix null pointer exception when saving. This occurs when a constant value is
unrecognised. These are now replaced with 'unrecognised' but this can only be
temporary until unknown constants are properly supported.
[A724] Add User Guide note on GTK warnings.
[A720] Improving the progress bar on multiple file load. The previous bar was not correctly
showing the total progress when opening multiple files, this has been fixed. There
remains an issue with the blocking of the UI thread by the openEditor call, but this is
unavoidable at the moment.
[A717] Only permit existing file to be opened. Previously the file->open dialog would allow
the user to type a filename that didn't exist, causing problems later in the flow.
[A691] Search substrings (they don't need to fully match).
Fix Y coordinate of CUBEMAP.
[A684] Fix bug. MGD did not show up on Mac with Java 1.6
[D686] Fixing standard Mac menu items. The 'About MGD' and 'Preferences' options were
missing from the Mac implementation.
[A697] Revising socket close mechanism to eliminate errors. The socket closedown code
reported lots of warnings even in the correct case. Code has now been refactored to
improve the messaging and to try and eliminate spurious warnings.
Added EGL plugin to send context on eglMakeCurrent
GLES3 working on Android, and Nexus10 4.3 booting. Only needed chmodding to
work on Android 4.3, so have changed the README to reflect this requirement. Have
also removed the GLES2 version of the android interceptor, and will now ship GLES3
as it is public.
[D698] Fix sequencing on save. Save operation no longer closes an active trace if the user
cancels the file selection dialog.
9.6 Changes between version 1.1.0 and 1.0.2
The following summarizes the changes made in this issue.
Issue Summary
[353] Added Vertex Attributes view, which shows all the vertices used in a ‘draw’ call
[353] Indices buffers are captured in the trace
Added warning for swapping between buffer targets
[653] Adding statistic for vertices per frame and show vertices count in the Outline View
Shader statistics are now updated individually
Non-Confidential 28You can also read