Residential property in the EU28: Unity in diversity - Belgian ...
←
→
Page content transcription
If your browser does not render page correctly, please read the page content below
Residential property in the EU28: Unity in diversity

Johan Van Gompel, Senior Economist KBC & Jan Van Hove, Chief Economist KBC

In recent years, there was a broad-based recovery in Europe’s housing markets. Since the second half
of 2016, a majority of EU countries are again recording annual house price increases of above 5%. The
price rally has prompted public debate as to whether EU property markets are overvalued. In general,
fundamental factors, such as disposable income, interest rates and demographics, can explain much
of the recent rally seen in the EU28. The upturn can, in particular, be linked to the prevailing low
interest-rate environment and to the economic recovery that started early 2013. Looking forward, the
sustained positive growth environment will likely provide sufficient counterweight to rising interest
rates. Therefore, further house price increases, albeit at a notably more modest pace than of late, are
the most likely scenario for the coming years. The main risks facing Europe’s housing markets are to
emerge in circumstances where there is: (1) a severe growth slowdown combined with rising
unemployment, (2) an unexpectedly strong and sudden increase in interest rates, and (3) a decline in
popularity of real estate as an investment. Based on our assessment of valuation metrics and
household indebtedness indicators, vulnerabilities to such shocks seem the largest in Sweden,
Luxembourg and Austria.

The purpose of this report is threefold. First, it maps and compares the price developments in
European residential real estate markets (Section 1). We illustrate that the national property markets
have displayed quite different price developments since 1995. This can partly be explained by a
considerable diversity in terms of demand and supply features of the countries’ housing markets
(Section 2). Second, the report provides an overview of various valuation metrics that help inform the
current public debate as to whether European housing markets are now overvalued based on
economic fundamentals (Section 3).
                                                                                                         1
                       BELGIAN FINANCIAL FORUM / REVUE BANCAIRE ET FINANCIÈRE – BANK- EN FINANCIEWEZEN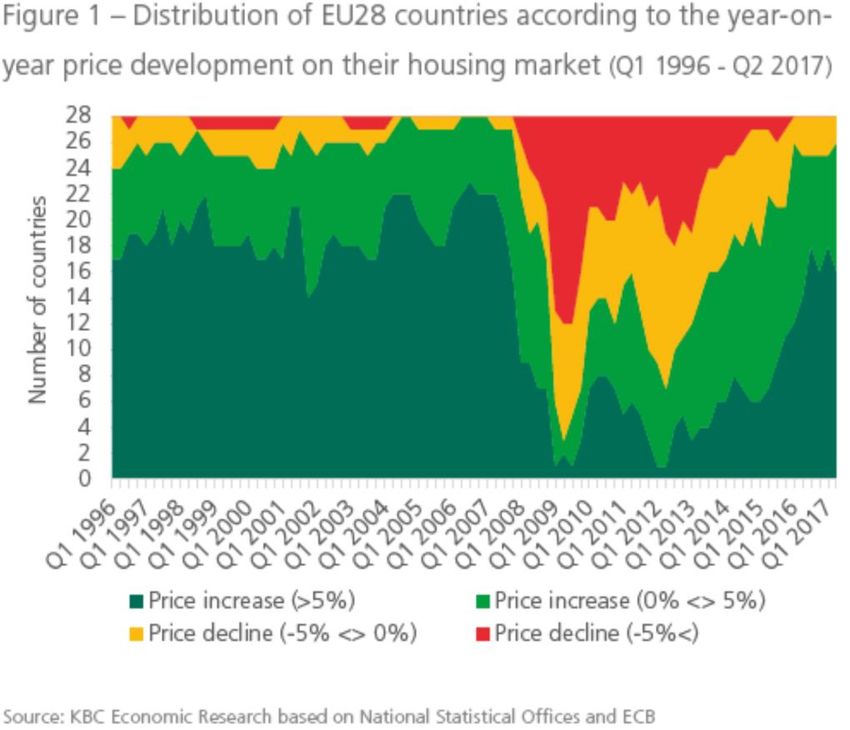
Third, these valuation metrics are complemented by indicators of household indebtedness for the EU
countries. We bring the figures together in two dashboards that provide an overview of the
vulnerabilities of the EU countries’ property markets. We also present simulations for EU28 house
price changes in 2018- 2019, based on macro-drivers, and give an overview of factors that likely
determine Europe’s property markets in the longer term (Section 4).

It is important to emphasize that our assessment is based on macroeconomic fundamentals. The
calculations do not fully account for the role played by country-specific factors, which can be hugely
important as well. Our purpose is not to predict potential future corrections, but rather to point at
potential vulnerabilities of the EU28 housing markets from two perspectives (valuation and
indebtedness). Moreover, the country-level results do not preclude the possibility of a different
conclusion at the regional level within countries. House price dynamics can vary tremendously within
a country, with prices in the capital in particular often rising more than the national averages, driven
in part by factors such as the role played by foreign buyers.

    1. Past developments of prices

Property markets are prone to boom-bust cycles. They typically reflect overshooting of house prices
(i.e. a long-term deviation from fundamentals) followed by undershooting (i.e. a severe correction).
This was seen in many EU countries in the run-up to and during the past financial and economic crisis.
In this section, we illustrate that the EU countries’ experiences since the mid-90s, and during the crisis
in particular, were far from uniform.

Long-term price development

House prices across Europe have shown significantly different developments during the past two
decades. Before the outbreak of the financial crisis in 2008, there was an upward price movement
almost everywhere, but its intensity varied strongly across countries. Nevertheless, a clear majority of
countries experienced an annual price increase of above 5% in 1995-2007. This is illustrated in Figure
1, where we show the distribution of the 28 Member States according to the annual price
development on their housing market. During the crisis, the downturn in prices was unequal as well,
and in some countries even (almost) non-existent. In recent years, we saw a broad-based recovery.
Since the second half of 2016, a majority of countries are again recording price increases of above 5%.
However, a few countries (Italy and Greece) still have declining prices, albeit less pronounced.

                                                                                                          2
                        BELGIAN FINANCIAL FORUM / REVUE BANCAIRE ET FINANCIÈRE – BANK- EN FINANCIEWEZEN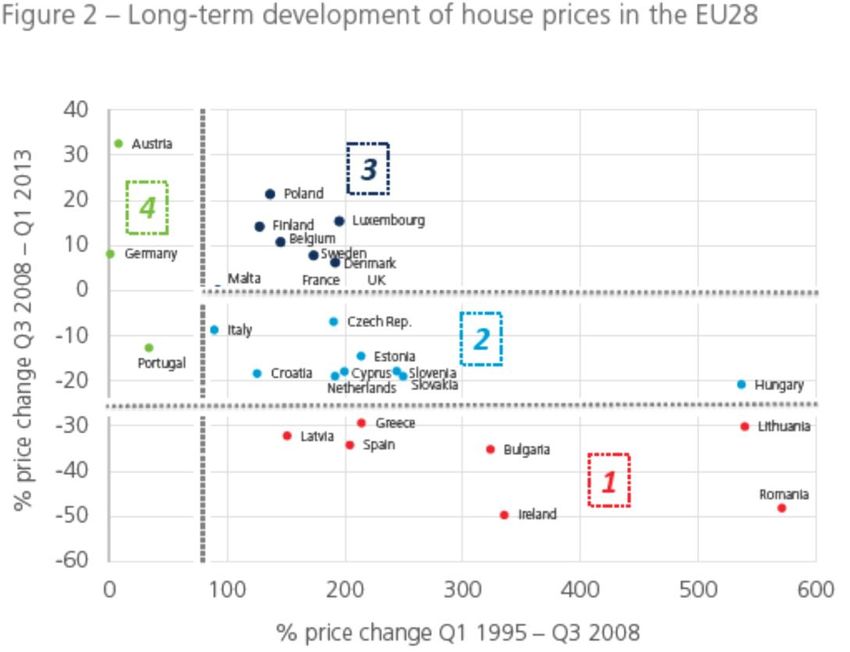
Broadly speaking, the 28 EU Member States can be divided into four groups (Figure 2):

       (1) A first group of countries (red dots) experienced very sharp house price increases before
           the start of the financial crisis, followed by an intense slump. Ireland, Spain, Greece,
           Latvia, Lithuania, Bulgaria and Romania belong to this group. With the exception of
           Greece, where the correction continues today, prices have been picking up significantly
           again in these countries in recent years;

       (2) A number of countries (light blue dots) saw strong price increases before the crisis, but
           the downturn that followed was more modest. This second group includes the
           Netherlands, Italy, the Czech Republic, Slovakia, Slovenia, Hungary, Estonia, Croatia and
           Cyprus. In Italy, Slovenia, Croatia and Cyprus, prices did not yet recover (much) in recent
           years;

       (3) A third group (dark blue dots) also saw strong price increases before the crisis, but the
           correction that followed was rather limited or even non-existent. This group consists of
           Belgium, Luxembourg, France, Denmark, Sweden, Finland, the UK, Poland and Malta. In
           recent years, price increases have accelerated quite strongly again in Luxembourg, the UK,
           Sweden and Malta;

                                                                                                        3
                      BELGIAN FINANCIAL FORUM / REVUE BANCAIRE ET FINANCIÈRE – BANK- EN FINANCIEWEZEN
(4) A fourth group of countries (green dots) includes Germany, Austria and Portugal, where
        house price increases since 1995 lagged far behind the growth rate seen in the other EU
        countries. In these three countries price increases have only accelerated in recent years.

The divided picture might seem surprising in the light of the European convergence and integration
process. In particular, although euro area countries had broadly similar nominal interest rates, at least
before the outbreak of the financial crisis, their house price patterns diverged strongly. Also, the
different price trends cannot (fully) be explained by economic catch-up, since some of the highest
rates of increase of house prices occurred in highly developed countries in Europe. Explanations for
marked differences in national trends are plentiful. First, despite the economic and monetary
integration in Europe, the performances of the countries’ economies have varied, sometimes
drastically, with widely different paths for national GDP growth and unemployment rates. Second,
houses typically are non-tradable goods, which – except to some extent for vacation homes and
investment properties - limits international arbitrage. Hence, price developments are mainly
determined by country-specific demand and supply features of the countries’ housing markets (see
e.g. Hilbers et al, 2008). These include demographics, fiscal and structural policies (housing taxation
and subsidies, supply rigidities like building regulations, etc.) and the ease and cost of funding property
purchases (mortgage interest rate levels, regulatory regimes, etc.). We will discuss such characteristics
in Section 2 of this report.

                                                                                                          4
                        BELGIAN FINANCIAL FORUM / REVUE BANCAIRE ET FINANCIÈRE – BANK- EN FINANCIEWEZEN
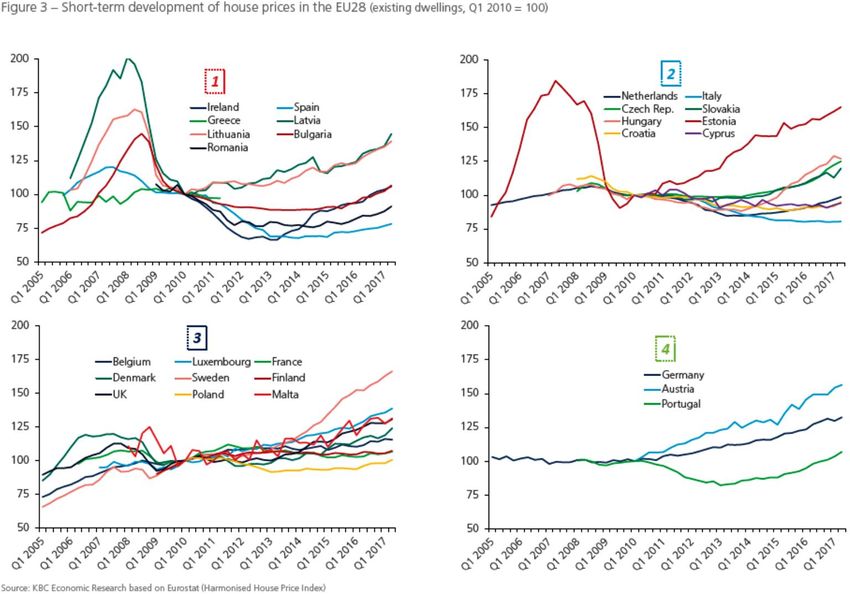
Recent price developments

The recent financial crisis has highlighted the importance of correctly measuring the prices of
residential property. To that end, Eurostat launched its harmonised house price index (HPI) in 2009,
with the purpose of providing comparable, timely and frequent statistics on changes in the EU28’s
property prices. Figure 3 illustrates Eurostat’s HPI for the four groups of countries identified in the
previous section. The data indicate that a corner has been turned and a clear recovery is now firmly
established. For the EU as a whole, the annual rate of price change started to increase in mid-2013,
turning positive at the beginning of 2014. In 2015 and 2016 house prices have rallied strongly again in
a majority of EU countries. The broad-based upturn is supported by stronger price growth both in
countries that did not experience a price collapse in the aftermath of the crisis and in countries that
did suffer from such a bust but that have in the meantime seen big corrections that facilitate a
recovery going forward. Nevertheless, the upturn in prices has been taking place at a notably different
pace across countries. Countries that have been at the upper end of the spectrum of the price
increases are Ireland, Hungary and Sweden. The development is most striking in the case of Sweden
as the country had already experienced a strong price increase before the crisis, but without a marked
correction thereafter. Italy and Greece are the only EU countries where price developments remained
negative even after 2014. In Finland, France, Cyprus and Croatia no clear upswing in prices is seen thus
far.

                                                                                                         5
                       BELGIAN FINANCIAL FORUM / REVUE BANCAIRE ET FINANCIÈRE – BANK- EN FINANCIEWEZEN
These evolutions point to a clear relationship between the general economic development and house
prices. Over the short to medium-term GDP and housing cycles are indeed subject to close co-
movements (see Rünstler, 2017). Several European countries hit severely by the crisis in terms of
economic output and employment, were also confronted with a substantial downturn on their
property market. The most explicit examples are Ireland and Spain. Both countries suffered from a
deep economic crisis due to their relatively large financial and real estate sectors, and the connections
between both of these. In other crisis countries, like Italy and Portugal, the crisis effect was not as
pronounced in their real estate market. The recent pick-up in house prices can be linked to the
recovery of the business cycle in Europe that started in early 2013, with GDP growth now
strengthening in almost all European countries. Households in most EU countries have been enjoying
a (sometimes rapid) rise in their incomes thanks to strong job creation and tightening labour markets,
which are pushing up wage growth, particularly in Central and Eastern Europe. On top of that,
monetary policy has remained very accommodative in recent years and long-term interest rates,
although rising, have remained at historically low levels. This has fed affordability of housing for
households and enhanced the attractiveness of property as an investment, both of which resulted in
higher demand for dwellings.
6
BELGIAN FINANCIAL FORUM / REVUE BANCAIRE ET FINANCIÈRE – BANK- EN FINANCIEWEZEN2. Housing market characteristics
National property markets are products of an often-complicated range of geographical, demographic,
socio-economic and political factors. Markets in the EU28 display considerable diversity in terms of
these features, which explain clear differences in past national developments in house prices. It is
difficult, and therefore beyond the scope of this study, to provide a view on how each of these features
individually affects prices, since such features often interact and these causal relationship are often
two-way with, e.g., price developments influencing authorities’ property-related policies. Also, recent
developments show that even within groups of countries with similar structural characteristics, some
countries were hit hard by property-related crises, whereas others were not. In this section, we first
focus on housing demand and supply and then give a (non-exhaustive) overview of specific features.
Housing demand and supply
As in any market, price formation in the housing market results from the interaction between demand
and supply. Key factors for housing demand include disposable income and interest rates. Both affect
the affordability of housing, which we discuss in Section 3 in the context of housing market valuation.
There are other factors outside the business cycle context as well, the most important one being
demographics. The trend in household formation plays a greater role in determining demand for
accommodation than the population trend. As a result of the fall in average family size, the number
of households in the EU has increased more rapidly than the population. The trend towards smaller
families relates to an increased diversity in household types that reflects a range of socioeconomic
drivers, including an increase in the number of one-parent families, the ageing population and the
decrease of the average number of children per family (see Van Gompel and Van Goubergen, 2017).
7
BELGIAN FINANCIAL FORUM / REVUE BANCAIRE ET FINANCIÈRE – BANK- EN FINANCIEWEZENTo determine whether there is shortage or surplus of properties in the housing market, the number
of households (demand) is generally set off against the number of dwelling units (supply). In reality,
however, there is no clear link between these two. That is because households are becoming more
varied and it is difficult to categorise them as ‘residential’ (the reason being the increasing presence
of co-parenting, living-apart-together relationships, etc.) and also due to the increasing number of
second homes, student lodgings and the use of accommodation for the purposes of tourism (e.g. hotel
rooms, recreation houses…). This, together with a normal requirement for some level of vacancy rates
to smooth transitions from one property to another, explains why the ratio of accommodation units
to households is above 1 in all countries and relatively high in traditional tourist destinations in
Southern Europe. Hence, it is not easy to interpret and compare the absolute value of the ratio across
countries.
For the EU as a whole, the ratio of accommodation units to households showed an increasing trend
since the 90s (Figure 4). In fact, this is at odds with the rising trend in prices seen in most countries till
the financial crisis. One explanation is that the rising ratio is attributed to the increasing number of
second homes, student lodgings and tourism accommodations, which also exerted pressure on prices.
In recent years, the ratio seems to have stabilised or even fallen slightly. In most countries, investment
in new housing came down after 2007 (in the EU28 from 6.6% of GDP to a low of 4.8% in 2015),
resulting in a slower increase in the accommodation stock. The declining ratio of accommodation units
to households likely contributes to explaining the recent recovery in house prices seen in most
countries. In the period 2009-2016, the average yearly increase in the number of households
surpassed the average yearly increase in the number of accommodation units in two thirds of EU
countries (Figure 5). A number of countries recording the highest gap between household growth and
accommodation growth (Ireland and Sweden) also recorded relatively strong house price increases in
recent years.
8
BELGIAN FINANCIAL FORUM / REVUE BANCAIRE ET FINANCIÈRE – BANK- EN FINANCIEWEZENInstitutional and structural features
Housing demand and supply are affected by many institutional and structural features that are
particular to a country’s residential property market. These features can play a key role in accentuating
or mitigating price developments in the property sector. On the demand side, intra-national
residential mobility is an important factor, since a high frequency of switching residence can
accelerate the speed with which price adjustments take place. In Europe, intra-national residential
mobility is high in Scandinavia and the UK (Figure 6). From Eurostat’s SILC-survey, we know that
around one third of the population in these countries move to another dwelling within a five-years
period. In most Southern and Central European countries, the figure is below 10%. Correspondingly,
the rate of (outright) home-ownership in these countries is relatively high.
Eurostat data suggest that the number of owner-occupiers in Europe has fallen since 2010 and,
conversely, the number of tenants has increased. This is partly attributable to the pronounced
increase in the number of immigrants, more of whom turn to the rental market for accommodation.
In addition, the rising number of tenants is, at least for some countries, likely also due to the steep
house prices rises over the past two decades. This affected the affordability of property for particular
segments of the population and, combined with relatively modest increases in rentals, encouraged
people towards the rental market in most countries. Buy-to-let markets therefore have grown
substantially over the past several years in many countries. The affordability issue went hand in hand
with lower interest rates increasing the relative return in rental property for investors, enhancing the
attractiveness of, and the demand for, housing as an investment. Results from the ECB Household
Finance and Consumption Survey show that the number of households owning other real estate
property than their main residence has indeed increased in many countries (Figure 7).
9
BELGIAN FINANCIAL FORUM / REVUE BANCAIRE ET FINANCIÈRE – BANK- EN FINANCIEWEZENHousing markets are also affected by macroeconomic, structural and macro-prudential policies.
These policies work by altering the path of the various fundamental factors determining general
housing market conditions. Monetary policy affects short-term interest rates, which either directly or
through their impact on longer-term rates will have an important impact on the affordability of
housing. Currently, monetary policy in Europe remains supportive for housing markets. Structural
policies, like building and land use regulations or authorisation processes for permits, affect
construction costs and times, and thereby the supply of housing. In some countries, such as Ireland
and the Czech Republic, supply constraints have meant supply has not responded quickly to demand
in recent years, and can explain to some degree the sharp price increases seen recently. According to
OECD research, the elasticity of housing supply in relation to prices is generally rather limited, implying
that prices are primarily determined by the demand for housing in the short term (see Sánchez, 2011).
Supervisory and regulatory (prudential) policies affect housing market dynamics through their impact
on the cost and ease of financing house purchases. These typically include capital requirements for
lenders and loan limits for borrowers. More generally, other characteristics of the housing finance
sector - such as transaction costs and the importance of non-banks in credit provision - are also
relevant for developments on housing markets. A study by Rünstler et al. (2016) shows a large degree
of heterogeneity in financial/credit cycles across EU States, partly as a result of diverging
characteristics. In a low interest-rate world, the role of macro-prudential policies is becoming
increasingly important. Taxes on property also vary across countries. From OECD statistics (2015), we
know that overall taxation - i.e. transaction and recurrent taxes on the transfer, use and ownership of
property - in Europe is the highest (above 3% of GDP) in France, the UK, Belgium and Luxembourg,
and the lowest (below 1% of GDP) in Latvia, Slovenia, Austria, Slovakia, the Czech Republic and Estonia.
10
BELGIAN FINANCIAL FORUM / REVUE BANCAIRE ET FINANCIÈRE – BANK- EN FINANCIEWEZENCentral and Eastern European countries’ housing markets have also been exposed to transition-
specific factors (see e.g. Égert and Mihaljek, 2007). In the past, housing markets in these countries
were distorted owing to large-scale public ownership and rent regulations. In the last decades of the
communist regime, there appears to have been underinvestment in that housing construction was
often limited to small, standardised apartments. At that time, there were chronic shortages of
housing, often with long waiting lists and sometimes two or more families to share a dwelling. Thus,
the strong price increases in these countries up to the financial crisis might to some extent be viewed
as a correction for these distortions. Moreover, part of these price increases reflects improvements in
the quality of the housing stock. Finally, in many countries in the region, in connection with EU entry,
foreign demand for housing has increased, primarily in capital cities and holiday resorts.
3. Housing market valuation
In this section, we present different valuation indicators for the EU28. One set of frequently used
metrics are price-to-income and price-to-rent ratios, that relate house prices to household income
and to rentals. More comprehensive valuation methods, often based on an econometric model,
include other relevant factors, such as interest rates and demographics. It is important to mention
that our assessment focusses only on the particular set of economic fundamentals as determinants of
correct house prices, and does not account for the role played by country-specific factors which can
be important as well. Moreover, our approach is based on macro-data only, neglecting microeconomic
dynamics like regional differences or price evolution differences across real estate categories.
Traditional valuation measures
The price-to-income ratio relates the development of house prices to that of per capita disposable
income. If the ratio rises to well above its long-term average, this indicates that there is pressure on
households' funding capacity. Therefore, the ratio reflects the trend in affordability of home-
ownership for an average household. In cases where the ratio deviates excessively above its long-term
average, prospective buyers would find purchasing a home more difficult, which in turn should reduce
demand and leads to downward pressure on prices. The price-to-rent ratio compares house prices
and rentals. In equilibrium, households should be indifferent between buying and renting. When the
price of houses for sale increases too much relative to rents, potential buyers find it relatively more
advantageous to rent, which should in turn exert downward pressure on house prices. In practice,
calculating this ratio generally involves relating house prices to the component of the rental value in
the harmonised consumer price index.
Figure 8 shows both ratios in relation to their average for the period Q1 1996 – Q2 2017. According to
these measures, property markets in Luxembourg and Sweden were by far the most overvalued in the
EU in Q2 2017. In these two countries, the ratios exceed their long-term average by 25% or more.
In Malta, Belgium, the UK, Austria, the Czech Republic and France, there is also some indication of an
overvaluation, albeit to a lesser degree. On the other side of the spectrum, mainly countries in Central
and Eastern Europe but also Ireland and Southern European countries have ratios that are (well) below
average historical values.
11
BELGIAN FINANCIAL FORUM / REVUE BANCAIRE ET FINANCIÈRE – BANK- EN FINANCIEWEZENThe main advantage of these often-used measures is their simplicity of computation. Conclusions
based on both measures have to be considered with caution, however, due to their simplifying
assumptions. First, each ratio has its own specific defects. E.g., aggregate disposable income is in fact
not the appropriate denominator in the price-to-income ratio, as it covers the whole population
instead of that of (potential) home buyers. In regard to the price-to-rent ratio, rentals can be highly
regulated, distorting the interpretation of the ratio. Moreover, the house price is calculated on the
basis of new transactions on the secondary market and therefore reflects current market conditions,
whereas rents correspond to the rent component of the consumer price index and usually reflect the
movement in rents under existing leases rather than that under new leases. Second, from a technical
point of view, there is the shortcoming that the calculated equilibrium level depends on the period
chosen, which is often too short - due to lack of historical data - to be able to consider the average as
a real long-term equilibrium level. Comparing the most recent values of the ratios with that level
therefore provides a distorted picture, so that they cannot be used as a statistically significant
valuation. Nor is it certain that the equilibrium value is constant over time, because of changes in
factors such as property taxation and the operation of the mortgage market.
Debt-servicing approach
More generally, the traditional valuation metrics have the shortcoming that they only take account of
one aspect (income or rent) and ignore other factors that also determine house prices (such as interest
rates and demographics). The traditional price-to-income ratio, meant to assess housing affordability,
can be extended by taking mortgage interest-rate developments explicitly into account.
12
BELGIAN FINANCIAL FORUM / REVUE BANCAIRE ET FINANCIÈRE – BANK- EN FINANCIEWEZENSince a property purchase is usually financed by borrowing, an affordability analysis should take
account of the debt service or repayment burden incurred by the homeowner. The debt service-to-
income ratio gives broader indication of affordability, by relating debt service payments (i.e. capital
repayments and interest) to disposable income. Two opposite forces have influenced the ratio in the
past decades. The prevailing low-interest environment exerted downward pressure on the ratio,
whereas softer (sometimes exuberant) mortgage-lending policies of particular banks and the
corresponding increase in household indebtedness drove the ratio upward.
In order to assess the valuation of house prices, we can express the debt service-to-income ratio as a
percentage deviation from its long-term average, in the same way as for the price-to-income and
price-to-rent ratios (with all the due caveats mentioned above). Time series for the ratio are available
from the Bank for International Settlements (BIS) for only a limited number of EU countries (Figure 9).
The deviations from the long-term average indicate that the Belgian, Finnish, Swedish and French
housing markets are overvalued by 10-20%. One should be cautious in comparing the results with
those obtained from the price-to-income ratio, as the reference period is shorter (Q1 1999 – Q2 2017)
due to limited data availability.
13
BELGIAN FINANCIAL FORUM / REVUE BANCAIRE ET FINANCIÈRE – BANK- EN FINANCIEWEZENEconometric-model approach
Given the numerous caveats attached to the valuation metrics discussed so far, it is preferable to place
greater reliance to model-based approaches that take into account a wider set of fundamental factors.
Many publications over the last ten years have set out to interpret the price trends on the property
market by means of co-integration models. These models, also used by the ECB, the EC and the IMF,
aim to establish a long-term or equilibrium link between house prices and a series of fundamental
determinants. The extent to which the actual house price deviates from the estimated equilibrium
level can then be considered as a measure of over- or undervaluation. In practice, the deviation
corresponds to the residual of the econometric regression equation, which represents the part of the
house price development that cannot be imputed to the explanatory variables.
Due to the lack of sound statistics on housing supply, empirical research has been largely limited to
demand factors in studies of house prices. These generally involve household disposable income, the
mortgage interest rate and a variable reflecting demographic developments (i.e. total population or
the number of households). Sometimes, housing investment by households is used as a proxy for
housing supply. In a recent discussion paper published by the European Commission, a co-integration
relationship was estimated between house prices and their demand and supply determinants, based
on panel data for the EU28 countries from the early 90s till 2015 (see Philiponnet and Turrini, 2017).
Greece, the United Kingdom, Sweden, Portugal and Latvia were the countries where prices in 2015
were the highest compared to their fundamentals. At the other end of the spectrum, prices in
Romania, Ireland, Poland, Spain and Germany were found to be much lower than fundamentals.
Regression analyses are useful as a valuation method compared to traditional measures, but the
results can be subject to a number of valid criticisms as well. For instance, the estimated relationship
can often be unstable, because the regression coefficients vary over time, due to changes in the
regulatory conditions, product innovation, property taxes, etc. Financial institutions may e.g. decide
to ease or tighten their mortgage lending conditions, the latter for instance as result of the financial
regulator becoming more stringent. The factors mentioned often impact households' borrowing
capacity, but usually are more difficult to adequately take into account in a regression analysis. Instead
of becoming a measure of market valuation, the difference between recorded property prices and the
equilibrium price, as recorded by the regression, may result from the omission of one or more
fundamental determinants.
Valuation measures ECB
The ECB also uses an econometric model-based indicator in its assessment of EU’s housing markets,
on top of three traditional metrics (i.e. the price-to-income, price-to-rent and an asset-pricing
approach). The indicator corresponds to the residuals of the regression of house prices on household
disposable income, the mortgage interest rate and the housing stock. The specification of the equation
may vary according to the characteristics of the country considered and data availability. Due to data
limitations, often real GDP and the 10-year government bond interest rate are used as explanatory
variables, instead of disposable income and the mortgage rate. One should be cautious therefore
when comparing the models’ findings with the ones obtained from alternative econometric models.
This, by the way, also applies to the traditional metrics, as the ECB often uses a relatively short
reference period to compute the long-term averages of the price-to-income and price-to-rent ratios.
14
BELGIAN FINANCIAL FORUM / REVUE BANCAIRE ET FINANCIÈRE – BANK- EN FINANCIEWEZENUltimately, the ECB considers the average of the four metrics to assess the housing market valuation
level. Figure 10 shows this average for the EU28 countries, as well as the minima and maxima
(corresponding to the lowest and highest estimates using the four methods) and the econometric
model-based indicator. It is seen that the range across different valuation techniques differs widely
for some countries, illustrating that the metrics are surrounded by a lot of uncertainty. In Q2 2017,
the average points to a strongly overvalued market in Sweden (by 48%) and Luxembourg (by 26%).
Sweden in fact is the only country in the EU where the econometric model-based indicator suggests
an extreme overvaluation, by more than 30%. For Austria and France, the model-based indicator
points at an overvaluation of some 15%. Remarkably, several countries that previously experienced
an overshooting of house prices, creating a substantial overvaluation, now see their property market
being undervalued due to an undershooting of prices following the severe correction in the aftermath
of the financial crisis. Spain, Ireland and some Central European countries are in that situation. The
undervaluation in these countries is still in place, despite the upswing in prices seen in recent years.
4. Vulnerabilities and price simulation
Developments in the property sector can have major implications for financial and macroeconomic
stability. Residential real estate represents an important part of households’ wealth and constitutes a
source of collateral for lenders. Furthermore, housing construction is typically an important
component of the real economy, as a source of employment, investment and growth. In that context,
the monitoring of the valuation of house prices and the indebtedness of households has become a key
element in the detection of any property bubbles.
15
BELGIAN FINANCIAL FORUM / REVUE BANCAIRE ET FINANCIÈRE – BANK- EN FINANCIEWEZENIn this section, we present dashboards that give an overview of potential vulnerabilities from both
perspectives (valuation and indebtedness). We conclude by presenting a simulation for the EU28’s
property markets in 2018-2019.
Combining valuation dashboard
In the previous section of this study, we presented different valuation approaches separately, each
delivering insights from different angles. Although it was argued that the econometric approach is the
most preferred method, it remains useful to use various approaches in a complementary way in the
final assessment of house prices. Table 1 brings calculations for different valuation metrics from two
sources (KBC and ECB) together in one dashboard. We include: (1) the traditional often-used price-to-
income and price-to-rent ratios (calculated by KBC), (2) the econometric model-based valuation (KBC
and ECB), and (3) the average of the four-valuation metrics calculated by the ECB (see above).
Vulnerable property markets are identified on the basis of setting thresholds, that are determined by
the distribution of the indicators across countries. Given the limitation of KBC’s econometric models
to its own home countries, the threshold-approach is not applied in this case. Countries belonging to
the 90th percentile of the distribution of the indicator are in red. Markets in these countries are
considered as most vulnerable in terms of their overvaluation. Sweden, Luxembourg, Austria and, to
a lesser extent, France belong to this group.
Countries belonging to the 80th percentile of the distribution (orange) warrant close monitoring as
well. This applies to Belgium, the UK and Germany. For the Netherlands and the Czech Republic there
is limited indication of overvaluation, both from the ECB’s econometric model. At the other end of the
spectrum, the threshold is set on the basis of the 20th percentile of the distribution (green). Here,
countries are identified in which housing markets are least vulnerable from a valuation point of view,
with markets being (clearly) undervalued. Ireland and Romania clearly belong to this group. In several
Southern and Central European countries (particularly Greece, Poland, Latvia, Lithuania and Croatia)
there is green as well, albeit to a lesser extent.
16
BELGIAN FINANCIAL FORUM / REVUE BANCAIRE ET FINANCIÈRE – BANK- EN FINANCIEWEZEN17 BELGIAN FINANCIAL FORUM / REVUE BANCAIRE ET FINANCIÈRE – BANK- EN FINANCIEWEZEN
Household stretch dashboard

Apart from housing market overvaluation, the vulnerabilities in household stretches can be elevated
as well. A high and increasing level of household indebtedness makes an economy more vulnerable to
shocks and, therefore, forms a serious threat to macroeconomic and financial stability. Hence, it needs
to be watched closely. Table 2 summarises a number of debt indicators for the EU28 countries into
one single dashboard. Like the valuation dashboard discussed above, vulnerable countries are
identified on the basis of setting thresholds that are determined by the distribution of the various
indicators across countries. Countries belonging to the 90th, 80th and 20th percentile of the
distribution of the indicator are red, orange and green, respectively.

The data suggest that concerns about household indebtedness in Cyprus, Denmark and the
Netherlands are most warranted. The level of household mortgage debt in these countries amounts
to (well) above 175% of household disposable income (red). Although the debt level is less worrying,
the strong increase in it during the past years also suggests potential vulnerabilities in Slovakia,
Sweden and Belgium (orange).

Despite the strong rise in the mortgage debt ratio, the financial position of Belgian households as a
total remains very robust overall, as is evident from the ratio of financial assets to debts, which is one
of the highest in the EU28.* The latter ratio is particularly low in Cyprus, Finland, Slovakia, Greece,
Ireland and Luxembourg. Countries in Central and Eastern Europe generally score relatively well in
terms in the different indicators (green). In this group, Slovakia has the highest debt position and the
lowest financial assets-to-debt ratio.

                                                                                                          18
                        BELGIAN FINANCIAL FORUM / REVUE BANCAIRE ET FINANCIÈRE – BANK- EN FINANCIEWEZEN
19 BELGIAN FINANCIAL FORUM / REVUE BANCAIRE ET FINANCIÈRE – BANK- EN FINANCIEWEZEN
It should be mentioned that the data in Table 2 may underestimate particular countries'
vulnerabilities. For instance, in the case of mortgage debt, Eurostat's data exclude securitised loans,
which may be quite important. Also, central bank data on arrears sometimes are higher than those
registered by Eurostat's SILC survey. Ireland is a clear example where one should be cautious in
interpreting the data used. Institutional features can moreover amplify property-related
vulnerabilities. Many of them are related to mortgage lending. E.g., tax deductibility reduces the net
costs for households of servicing their debt and gives them the incentive to borrow more. Similarly, a
lengthening of mortgage maturities and easing of loan-to-value or debt service-to-income constraints
may raise borrowing capacity considerably. It tends to encourage indebtedness, which is in turn
related to higher house prices. Other features, like the prevailing type of interest rate, play a role as
well. In a period of low interest rates, variable mortgage rates may induce households to take
excessively big mortgages. When rates start rising during the life of the mortgage, debt servicing may
be at risk. Table 3 shows the mentioned characteristics for the EU28 countries. From the set of
countries that warrant attention, given conclusions drawn from the valuation and household stretch
dashboard above, Sweden and the Netherlands, and to a lesser extent Denmark and Portugal, stand
out as having features of mortgages with higher vulnerabilities. In particular, the typical mortgage
maturity in Sweden is by far the highest in the EU, a feature that is combined with generous mortgage
rate deductibility.

                                                                                                         20
                       BELGIAN FINANCIAL FORUM / REVUE BANCAIRE ET FINANCIÈRE – BANK- EN FINANCIEWEZEN
EU house price simulation
In nearly all EU countries, the post-crisis housing market correction appears to be behind us. Recently,
house price dynamics have again become quite strong in a majority of states. The question now arises
as to whether these developments are sustainable and if the recovery will last in the years ahead.
Looking into 2018, housing market activity in the EU will likely continue to expand amid still favourable
lending conditions and an ongoing firm growth momentum in the broader economy. The ECB will
continue quantitative easing, albeit at a reduced pace, until at least September 2018. This implies that
any significant tightening of the ECB’s policy stance is still distant. In our scenario, a first-rate hike by
the ECB will likely be only in 2019.
Although this implies a rising rate environment, it should keep sovereign bond and mortgage interest
rates, from an historical perspective, at relatively low levels for a while, too. Moreover, real GDP
growth in Europe is expected to remain strong in 2018, thereby providing continued support to
employment and income growth. Not only will the benign environment result in households
continuing to buy property, it will also bring about continued appetite from investors. Both will
underpin robust house price growth in most of the EU Member States in 2018.
From 2019 onwards, we expect house prices to rise more slowly in most markets, as some GDP growth
moderation is likely and bond and mortgage interest rates will by then be on a clear upward trajectory.
Increased residential investment and, hence, a more flexible housing supply will add to the forecast
price slowdown. In several EU countries, housing investment has been particularly low for a prolonged
period despite strong house price increases.
Planning, zoning and land use regulations have often been important supply side constraints to
housing, restricting new residential construction. Due to the underinvestment and given relatively
strong increases in the number of households, these countries are facing a large accumulated housing
shortage, aggravating the house price increase. Very recently, residential investment is growing more
dynamically again in most EU countries, however, adding to supply and likely curbing down price
increases in the period ahead.
21
BELGIAN FINANCIAL FORUM / REVUE BANCAIRE ET FINANCIÈRE – BANK- EN FINANCIEWEZENBased on the aforementioned economic scenario, we expect house prices in the EU to rise on average
by 4.0% in 2018 and 3.5% in 2019, compared to an estimated increase of 4.4% in 2017. It is important
to emphasize that risks to this scenario are mainly downward biased and include, e.g., a faster
monetary policy normalisation, a hard Brexit or renewed worries about the stability of the European
project.
22
BELGIAN FINANCIAL FORUM / REVUE BANCAIRE ET FINANCIÈRE – BANK- EN FINANCIEWEZENCountries for which we have identified property-related vulnerabilities – i.e. elevated valuations
and/or debt burdens - could deviate from the general price path. To prevent these vulnerabilities from
further building up, macro-prudential authorities in these countries are likely to (further) tighten their
policy stance, resulting in a stronger slowdown of price dynamics than envisaged for the total EU. This
will particularly be the case in Sweden, Luxembourg and Austria (see Table 4). In our view, the risk of
an eventual price correction is also the biggest in these countries. It is important to emphasize that
the views expressed only reflect a simulation based on macro-drivers and do not account for country-
specific factors which can play a hugely important role as well.
In the longer-term Europe’s property markets will grapple with the various disruptive forces of
demographics, technology and urbanization. The net impact on house prices is not always fully clear,
though. One could argue, for instance, that less buoyant (in some countries even negative) population
growth will temper house price dynamics in the coming decade. However, as referred to above, it is
the number of households rather than total population that matters. The continuing fragmentation of
the family, in addition to an increasing number of elderly singles, is likely to foster growth in the
number of households and, hence, demand for housing. If the response on the supply side is not
adequate, this could exacerbate price pressure on the secondary market. Changes in household
numbers and structures stemming from migration flows can moreover contribute to housing
boom/bust cycles, as witnessed, for instance, in Ireland and Spain in the past decade.
Finally, the more complex life-course of individuals and households is producing an ever-greater
variety of housing needs. The mismatch between the diversity of life-courses and housing market
developments will become more challenging. In particular, the growth in the number of single-person
households (many of them elderly persons) is leading to much higher demand for smaller living units,
like studios or service flats. Also, new living formulas, like multi-family housing, cohousing or fractional
ownership, will likely gain popularity. As car-dependent lifestyles will become unattractively
expensive,
more people will moreover want to live in urban environments with high-density housing. Homes will
be smaller, but closer to work, school and shopping. As a consequence, future price developments for
different segments of dwellings will likely diverge more than they used to do in the past.
References
Central Bank of Ireland (2017), “A review of residential mortgage lending requirements”, Box A1, 28
November 2017.
Du Caju, Ph. (2017), “Pockets of risk in the Belgian mortgage market: Evidence from the Household
Finance and Consumption Survey (HFCS)”, Working Paper Research NBB, nr. 332.
Égert, B. and D. Mihaljek (2007), “Determinants of house price dynamics in Central and Eastern
Europe”, Focus on European Economic Integration, nr. 1, pp. 52-76.
European Systemic Risk Board (2016), “Vulnerabilities in the EU residential real estate sector”,
November.
23
BELGIAN FINANCIAL FORUM / REVUE BANCAIRE ET FINANCIÈRE – BANK- EN FINANCIEWEZENHilbers, P., A. Hoffmaister, A. Banerji and H. Shi (2008), “House price developments in Europe: a
comparison”, IMF Working Paper, WP/08/211.
Sánchez, A. and A. Johansson (2011), “The price responsiveness of housing supply in OECD
countries”, OECD Working Papers nr. 837.
Philiponnet, N. and A. Turrini (2017), “Assessing house price developments in the EU”, European
Commission Discussion Paper nr. 047.
Rünstler, G. (2017), “House price cycles in the European Union: seven stylized facts”, European
Central Bank, Presentation at Lietuvos Bankas conference, 11 May 2017.
Van Gompel, J. and J. Van Goubergen (2017), "Sociodemographic change in Europe: general trends
and crosscountry differences", KBC Economic Research Report, nr. 04.
Warisse, C. (2017), “Analysis of the developments in residential property prices: Is the Belgian
market overvalued?”, NBB Economics Review, June, pp. 61-77.
24
BELGIAN FINANCIAL FORUM / REVUE BANCAIRE ET FINANCIÈRE – BANK- EN FINANCIEWEZENYou can also read