Effects of Body Position and Hypovolemia on the Regional Distribution of Pulmonary Perfusion During One-Lung Ventilation in Endotoxemic Pigs
←
→
Page content transcription
If your browser does not render page correctly, please read the page content below
ORIGINAL RESEARCH
                                                                                                                                             published: 10 September 2021
                                                                                                                                           doi: 10.3389/fphys.2021.717269

                                                Effects of Body Position and
                                                Hypovolemia on the Regional
                                                Distribution of Pulmonary Perfusion
                                                During One-Lung Ventilation in
                                                Endotoxemic Pigs
                                                Jakob Wittenstein 1 , Martin Scharffenberg 1 , Xi Ran 1,2 , Yingying Zhang 1,3 , Diana Keller 1 ,
                                                Sebastian Tauer 1 , Raphael Theilen 1 , Yusen Chai 1 , Jorge Ferreira 1 , Sabine Müller 1 ,
                                                Thomas Bluth 1 , Thomas Kiss 1,4 , Marcus J. Schultz 5 , Patricia R. M. Rocco 6 ,
                                                Paolo Pelosi 7,8 , Marcelo Gama de Abreu 1,9,10* and Robert Huhle 1
                                                1
                                                  Department of Anaesthesiology and Intensive Care Medicine, Pulmonary Engineering Group, University Hospital Carl
                                                Gustav Carus Dresden at Technische Universität Dresden, Dresden, Germany, 2 Department of Intensive Care, Chongqing
                                                General Hospital, University of Chinese Academy of Science, Chongqing, China, 3 Department of Anesthesiology, Affiliated
                                                Hospital of Southwest Medical University, Luzhou, China, 4 Department of Anaesthesiology, Intensive-, Pain- and Palliative
                                                Care Medicine, Radebeul Hospital, Academic Hospital of the Technische Universität Dresden, Radebeul, Germany,
                           Edited by:           5
                                                  Department of Intensive Care and Laboratory of Experimental Intensive Care and Anaesthesiology, Academic Medical
                   Andrew T. Lovering,          Center, University of Amsterdam, Amsterdam, Netherlands, 6 Laboratory of Pulmonary Investigation, Carlos Chagas Filho
   University of Oregon, United States          Institute of Biophysics, Federal University of Rio de Janeiro, Rio de Janeiro, Brazil, 7 Department of Surgical Sciences and
                          Reviewed by:          Integrated Diagnostics, University of Genoa, Genoa, Italy, 8 Anesthesia and Critical Care, San Martino Policlinico Hospital,
                         Susan Hopkins,         Istituto di Ricovero e Cura a Carattere Scientifico (IRCCS) for Oncology and Neurosciences, Genoa, Italy, 9 Department of
    University of California, San Diego,        Intensive Care and Resuscitation, Anesthesiology Institute, Cleveland Clinic, Cleveland, OH, United States, 10 Department of
                           United States        Outcomes Research, Anesthesiology Institute, Cleveland Clinic, Cleveland, OH, United States
                 Erik Richard Swenson,
             University of Washington,
                           United States        Background: The incidence of hypoxemia during one-lung ventilation (OLV) is as high
                  *Correspondence:              as 10%. It is also partially determined by the distribution of perfusion. During thoracic
              Marcelo Gama de Abreu             surgery, different body positions are used, such as the supine, semilateral, lateral, and
                   gamadem@ccf.org
                                                prone positions, with such positions potentially influencing the distribution of perfusion.
                    Specialty section:
                                                Furthermore, hypovolemia can impair hypoxic vasoconstriction. However, the effects of
          This article was submitted to         body position and hypovolemia on the distribution of perfusion remain poorly defined. We
                Respiratory Physiology,
                                                hypothesized that, during OLV, the relative perfusion of the ventilated lung is higher in the
                a section of the journal
                 Frontiers in Physiology        lateral decubitus position and that hypovolemia impairs the redistribution of pulmonary
             Received: 30 May 2021              blood flow.
         Accepted: 10 August 2021
      Published: 10 September 2021
                                                Methods: Sixteen juvenile pigs were anesthetized, mechanically ventilated, submitted
                               Citation:
                                                to a right-sided thoracotomy, and randomly assigned to one of two groups: (1)
       Wittenstein J, Scharffenberg M,          intravascular normovolemia or (2) intravascular hypovolemia, as achieved by drawing
    Ran X, Zhang Y, Keller D, Tauer S,          ∼25% of the estimated blood volume (n = 8/group). Furthermore, to mimic thoracic
 Theilen R, Chai Y, Ferreira J, Müller S,
            Bluth T, Kiss T, Schultz MJ,        surgery inflammatory conditions, Escherichia coli lipopolysaccharide was continuously
       Rocco PRM, Pelosi P, Gama de             infused at 0.5 µg kg−1 h−1 . Under left-sided OLV conditions, the animals were further
Abreu M and Huhle R (2021) Effects of
   Body Position and Hypovolemia on
                                                randomized to one of the four sequences of supine, left semilateral, left lateral, and
the Regional Distribution of Pulmonary          prone positioning. Measurements of pulmonary perfusion distribution with fluorescence-
Perfusion During One-Lung Ventilation           marked microspheres, ventilation distribution by electrical impedance tomography,
                  in Endotoxemic Pigs.
            Front. Physiol. 12:717269.          and gas exchange were then performed during two-lung ventilation in a supine
     doi: 10.3389/fphys.2021.717269             position and after 30 min in each position and intravascular volume status during OLV.

Frontiers in Physiology | www.frontiersin.org                                          1                                       September 2021 | Volume 12 | Article 717269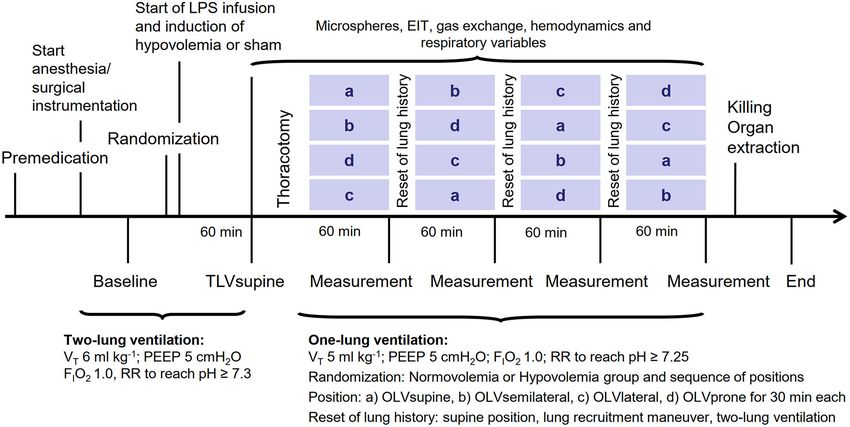
Wittenstein et al.                                                                                                           Perfusion During One-Lung Ventilation

                                                Results: During one-lung ventilation, the relative perfusion of the ventilated lung was
                                                higher in the lateral than the supine position. The relative perfusion of the non-ventilated
                                                lung was lower in the lateral than the supine and prone positions and in semilateral
                                                compared with the prone position. During OLV, the highest arterial partial pressure of
                                                oxygen/inspiratory fraction of oxygen (PaO2 /FI O2 ) was achieved in the lateral position
                                                as compared with all the other positions. The distribution of perfusion, ventilation, and
                                                oxygenation did not differ significantly between normovolemia and hypovolemia.
                                                Conclusions: During one-lung ventilation in endotoxemic pigs, the relative perfusion of
                                                the ventilated lung and oxygenation were higher in the lateral than in the supine position
                                                and not impaired by hypovolemia.

                                                Keywords: one-lung ventilation, OLV, pulmonary perfusion, thoracic anesthesia, hypovolemia, body position, HPV,
                                                gravity

INTRODUCTION                                                                             position is needed for certain esophageal and spinal
                                                                                         surgery approaches. In addition, the supine position is
During one-lung ventilation (OLV), the incidence of relevant                             required during mediastinal and cardiac surgery, and the
hypoxemia can be as high as 10% and can be associated with                               semilateral position is used during open thoracic aortic
postoperative complications (Kazan et al., 2009). The incidence                          repair (Crawford position). Currently, it is not known how
of hypoxemia is mainly determined by the pulmonary blood                                 these positions compare with respect to the distribution of
flow to the ventilated and non-ventilated lung, with the latter                          regional pulmonary perfusion and gas exchange. Furthermore,
representing the intrapulmonary right-to-left shunt. During                              during thoracic surgery, the incidence of major bleeding
OLV, hypoxic pulmonary vasoconstriction (HPV) redirects                                  leading to acute intravascular hypovolemia can reach
pulmonary blood flow toward the ventilated lung. In turn,                                up to 5% (Schirren et al., 2015). It has been proposed
regional pulmonary blood flow is influenced by gravity (Szegedi                          that acute intravascular hypovolemia may alter hypoxic
et al., 2010), local mechanical forces (Alfery et al., 1981), and                        pulmonary vasoconstriction (Deem et al., 1995) and thereby
intravascular volume status (Deem et al., 1995), as summarized                           gas exchange. However, the effect of hypovolemia on
in the west-zone model (West et al., 1964). Furthermore, the                             the distribution of pulmonary blood flow during OLV is
atelectasis and hypo-ventilated zones and the hyper-inflated                             not well-determined.
areas of the ventilated lung contribute to perfusion-ventilation                            In this study, we aimed to determine the distribution of
mismatch and have an additive effect on shunting in the                                  pulmonary blood flow during commonly used body positions
non-ventilated lung (Hedenstierna et al., 1986). Body position                           for thoracic surgery during normo- and hypovolemia in
may further influence the distribution of pulmonary perfusion                            pigs undergoing one-lung ventilation. We hypothesized that
because of different gravitational and ventilation distributions                         the pulmonary blood flow of the ventilated lung would be
in corresponding positions. Finally, the geometry of the                                 highest in the lateral decubitus position. We also hypothesized
vascular tree that branches asymmetrically plays an important                            that intravascular hypovolemia impairs the redistribution
role in the spatial distribution of pulmonary blood flow                                 of pulmonary blood flow because of an altered hypoxic
(Glenny and Robertson, 2011).                                                            pulmonary vasoconstriction.
   One-lung ventilation is required for different thoracic
procedures to allow access to the surgical field. Depending
on the surgical access, a patient can be placed in a supine,                             METHODS
semilateral, lateral, or prone position. While the lateral
decubitus position is most frequently used, the prone                                    The Institutional Animal Care and Welfare Committee and the
                                                                                         Government of the State of Saxony, Germany, approved the study
                                                                                         (DD24.1-5131/449/71, TVV 69/2018). All the animals in this
Abbreviations: CV, Coefficient of variation; EIT, Electrical impedance                   study received humane care in compliance with the Principles
tomography; ERS , Elastance of the respiratory system; EVLWI, Extravascular
lung water index; FI O2 , Inspired fraction of oxygen; GEDVI, Global end-diastolic
                                                                                         of Laboratory Animal Care formulated by the National Society
volume index; HPV, Hypoxic pulmonary vasoconstriction; I:E, Inspiratory                  for Medical Research and the US National Academy of Sciences
to expiratory time ratio; ITBVI, Intrathoracic blood volume index; LPS,                  Guide for the Care and Use of Laboratory Animals. This study
Lipopolysaccharide; OLV, One-lung ventilation; PEEP, Positive end-expiratory             also complied with the relevant aspects of the Animal Research:
pressure; PICCO, Pulse Contour Cardiac Output; Pmean, Mean airway pressure;              Reporting of In Vivo Experiments (ARRIVE) guidelines (Percie
Ppeak, Peak airway pressure; PVRI, Pulmonary vascular resistance index; Qrel,I ,
Relative pulmonary blood flow; RR, Respiratory rate; RRS , Resistance of the
                                                                                         du Sert et al., 2020). The animals were kept at a controlled
respiratory system; SVRI, Systemic vascular resistance index; TLV, Two-lung              temperature and a light-dark cycle with free access to water
ventilation; VT , Tidal volume.                                                          and food.

Frontiers in Physiology | www.frontiersin.org                                        2                                September 2021 | Volume 12 | Article 717269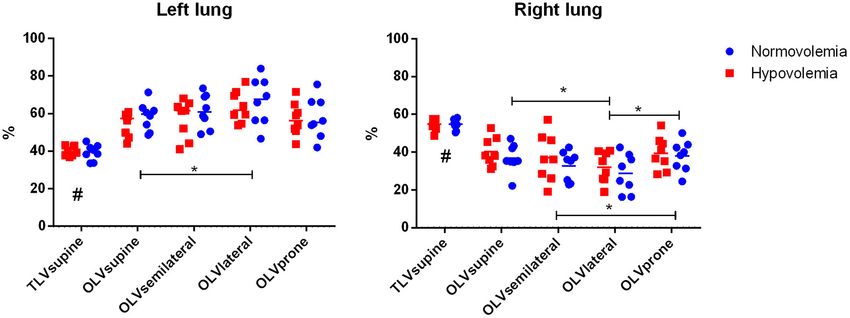
Wittenstein et al.                                                                                                                Perfusion During One-Lung Ventilation

 FIGURE 1 | The time course of the interventions and measurements. LPS, lipopolysaccharide; VT , tidal volume; PEEP, positive end-expiratory pressure; FI O2 , fraction
 of inspired oxygen; RR, respiratory rate; microspheres, measurement of regional pulmonary perfusion; EIT, electrical impedance tomography.

Experimental Protocol                                                                  double-lumen tube (39 Fr., Silbroncho Fuji, Tokyo, Japan) was
The time course of the experiments is presented in Figure 1.                           placed through a tracheotomy, where the bronchial tip was
Sixteen female pigs (German landrace, weighing 35–49 kg,                               inserted into the left main bronchus, under fiberoptic control
Danish Specific Pathogen Free Certification, www.spf.dk) were                          conditions (AmbuaScope 3 and AmbuaView, Ambu GmbH,
intramuscularly sedated with midazolam (1 mg kg−1 ) and                                Bad Nauheim, Germany). In another investigation, the results
ketamine (10 mg kg−1 ). Intravenous anesthesia was induced and                         of which are being published elsewhere, a left-sided video-
maintained with midazolam (bolus of 0.5–1 mg kg−1 , followed                           assisted thoracoscopy was performed, where three pressure
by 1 mg kg−1 h−1 ) and ketamine (bolus of 3–4 mg kg−1 ,                                sensors were attached to the parietal pleura in the left hemi-
followed by 15 mg kg−1 h−1 ). Muscle paralysis was achieved with                       thorax, as described previously (Kiss et al., 2019). Thereafter,
atracurium (bolus 3–4 mg kg−1 , followed by 3 mg kg−1 h−1 ). The                       the baseline measurements of gas exchange, respiratory signals,
intravascular volume was maintained with a crystalloid solution                        hemodynamics, and the distribution of ventilation by electrical
(E153; Serumwerk Bernburg AG, Bernburg, Germany) at a rate                             impedance tomography (EIT) were performed (baseline).
of 5 ml kg h−1 . The mean arterial pressure was kept >60 mmHg                              The animals were randomly assigned to normovolemia or
by norepinephrine and colloid infusion, as appropriate. Colloids                       hypovolemia. For the induction of moderate hypovolemia, 25%
were used in the case of increasing hemoglobin. Furthermore, the                       of the calculated blood volume, estimated as 70 ml kg−1 (Hannon
animals were ventilated in a volume-controlled mode: a fraction                        et al., 1990), was drawn from the central venous catheter. To
of inspired oxygen (FI O2 ) of 1, a tidal volume (VT ) of 6 ml                         mimic the inflammatory response to surgical trauma due to
kg−1 , a positive end-expiratory pressure (PEEP) of 5 cm H2 O, an                      major thoracic surgery (Takenaka et al., 2006; Sánchez-Pedrosa
inspiratory: expiratory (I:E) ratio of 1:1, a constant gas flow of 25                  et al., 2018), 0.5 µg/kg/h of lipopolysaccharides (LPS) from E.
L/min, and a respiratory rate (RR) adjusted to arterial pH >7.3.                       coli O111:B4 (Sigma-Aldrich, St. Louis, MO, United States) was
    All skin incisions were preceded by the infiltration of 2–5 ml                     continuously infused through the central venous line. In previous
lidocaine 2%. After the surgical preparation of the right internal                     studies, a low-dose LPS infusion was shown to reduce hypoxic
carotid artery, a pulse contour cardiac output (PiCCO) catheter                        pulmonary vasoconstriction (Reeves and Grover, 1974; Theissen
(20 cm; Pulsion Medical Systems SE, Feldkirchen, Germany)                              et al., 1991). An hour after the start of LPS infusion, the two-
was inserted to continuously monitor the arterial pressure. A                          lung ventilation supine (TLVsupine) measurements of regional
7.5 Fr. pulmonary artery catheter (Opticath; Abbott, Abbott                            pulmonary perfusion (microspheres), gas exchange, respiratory
Park, IL, United States) was used to measure cardiac output                            signals, hemodynamics, and the distribution of ventilation were
(CO), and pulmonary artery pressure was advanced through an                            performed. Thereafter, the animals were randomly submitted
8.5 Fr. sheath placed in the right external jugular vein until                         to one of four sequences during OLV according to a Latin
typical pulmonary arterial pressure waveforms were observed.                           square design, namely, (1) a-b-c-d, (2) b-d-a-c, (3) d-c-b-a,
Urine was collected with a bladder catheter inserted through                           and (4) c-a-d-b (30 min per body position, crossover), with
a median mini-laparotomy. For lung separation, a left-sided                            a = supine, b = left semilateral, c = left lateral, and d =

Frontiers in Physiology | www.frontiersin.org                                      3                                      September 2021 | Volume 12 | Article 717269
Wittenstein et al. Perfusion During One-Lung Ventilation
prone position. To mimic a thoracic surgery, a right-sided The distributions of pulmonary blood flow along the
thoracotomy was performed between the medial-clavicular and craniocaudal, ventrodorsal, and left-right axes under each of
anterior axillary lines in the 4th−5th intercostal space by placing the experimental conditions were assessed by linear regression.
a rib spreader. For OLV, a volume-controlled mode was used: Additionally, a three-dimensional reconstruction of the lung was
VT of 5 ml kg−1 , FI O2 of 1, PEEP of 5 cmH2 O, I:E of 1:1, performed, considering the spatial coordinates of each lung piece
and RR of 30–35 min−1 titrated to achieve an arterial pH and the pulmonary blood flow at each of the x (left-right),
of >7.25 and a flow of 25 L min−1 . Thirty minutes after y (dorsal-ventral), and z (caudal-cranial) coordinates. Color
placing the animals in the respective body positions (OLVsupine, mapping was performed to identify the regional distribution of
OLVsemilateral, OLVlateral, OLVprone), the measurements pulmonary blood flow based on Qrel,i . The color map was then
of regional pulmonary perfusion, gas exchange, respiratory normalized by the maximum Qrel under each of the experimental
signals, hemodynamics, and the distribution of ventilation were conditions, resulting in a color scale ranging from white (0, lowest
performed. To reset lung history between interventions, the perfusion) to red (1, highest perfusion). The relative centers of
animals were placed in the supine position and disconnected perfusion along the left-right axes, the dorsal-ventral, and the
from the ventilator. An alveolar recruitment maneuver was caudal-cranial axis were calculated by.
then performed, with two-lung ventilation resuming thereafter
until the normalization of gas exchange, before the start of
1
each position. 1 X X
CoPx = P x· Qrel.i x, y, z
Qrel,i x, y, z
Measurements x=0 y,z
Measurement of Regional Pulmonary Blood Flow
The distribution of regional pulmonary blood flow was marked with the three body directions represented by x, y, and z. The
with IV-administered fluorescence and color-labeled 15-µm coefficient of variation (ratio of the SD to the mean in percent)
diameter microspheres (Thermo Fisher Scientific, Waltham, of mean pulmonary perfusion was calculated to determine the
MA, United States). The colors used were blue, blue-green, spatial heterogeneity of pulmonary perfusion distribution.
yellow-green, orange, and red. To avoid bias, the colors were Electrical Impedance Tomography
randomly assigned at any given time point. Immediately before Electrical impedance tomography measurements were conducted
injection, the microspheres were vortexed, sonicated for 90 s, with an operating frequency of 130 kHz and 50 frames s−1 . Raw
and drawn into 2-ml syringes. All the injections were performed measured EIT data were then filtered at 50 Hz and reconstructed
for over 60 s to average the blood flow over several cardiac and using PulmoVista R 500 (Drägerwerk AG & Co. KGaA, Lubeck,
respiratory cycles. During the injection, ∼1.5 × 10⁶ microspheres Germany), a commercially available software. Each EIT image
were administered. of the resulting reconstructed temporal image series consisted
Postmortem lungs were extracted en bloc and flushed with of 32 × 32 pi. The reconstruction of these images was carried
50 ml kg−1 of a hydroxyethyl starch 130/0.4 solution (Voluven, out as described in detail by the group of authors of this study
Fresenius Kabi, Bad Homburg, Germany) and air-dried by (Bluth et al., 2019). The global region of interest was a half-sphere
continuous tracheal airflow for 7 days with a continuous covering the left hemisphere of the EIT, thus, only containing
pressure of 25 cm H2 O. The lungs were then coated with a the ventilated lung, as described previously (Wittenstein et al.,
one-component polyurethane foam (BTI Befestigungstechnik, 2020). The center of ventilation was defined as the median of
Ingelfingen, Germany), suspended vertically in a square box, tidal impedance changes (surrogate for ventilation) along the
and embedded in a rapidly setting urethane foam (polyol and dorsoventral axis and left-right axis of the left lung and expressed
isocyanate; Elastogran, Lemförde, Germany). as a percentage, with 0% representing most dorsal and most left
The foam block was then cut into cubes of ∼1.2 cm3 . Each and 100% most ventral and most central lung zones.
cube was weighed and assigned a three-dimensional coordinate.
The samples were then soaked for 7 days in 3 ml of 2- Gas Exchange and Hemodynamics
ethoxyethyl acetate (Aldrich Chemical Co. LLC, Milwaukee, WI, Arterial and mixed venous blood samples were analyzed using
United States) to retrieve the fluorescent dye. The fluorescence a blood gas analyzer (ABL 80 Flex Basic, Radiometer Medical,
was read in a luminescence spectrophotometer (LS-50B; Perkin- Copenhagen, Denmark). The mean arterial and pulmonary
Elmer, Beaconsfield, United Kingdom), with the measured artery pressures were measured continuously, and cardiac
intensity of fluorescence in each probe then being normalized output was determined with a pulmonary artery catheter
according to its weight (xi ). The relative pulmonary blood flow using a conventional thermodilution method. Extravascular
Qrel,i of a probe i was also determined according to: lung water (EVLW, a surrogate for lung injury), intrathoracic
blood volume (ITBV), and global end-diastolic blood volume
xi (GEDV, a surrogate for cardiac preload), systemic vascular
Qrel,i = 1 P resistance (SVR, a surrogate for cardiac afterload), and stroke
n xi
volume (SV) were determined using the PiCCO catheter. The
with the denominator holding the mean relative blood flow of values were then normalized to body surface area [pulmonary
one lung per time point. The mean normalized relative blood flow vascular resistance index (PVRI), systemic vascular resistance
was, therefore, 1. index (SVRI), global end-diastolic volume index (GEDVI), and
Frontiers in Physiology | www.frontiersin.org 4 September 2021 | Volume 12 | Article 717269Wittenstein et al. Perfusion During One-Lung Ventilation
intrathoracic blood volume index (ITBVI), respectively] and TABLE 1 | Characteristics of the animal and experimental protocol.
body weight [extravascular lung water index (EVLWI]), as
Variable Normovolemia Hypovolemia P=
reported previously (Kelley et al., 1973). Furthermore, PiCCO
was not used to guide fluid treatment, since the normal values Body weight [kg] 43.5 ± 1.4 43.1 ± 4.6 0.803
of pigs lie outside the reference ranges for humans (Längin et al., Total anesthesia time [min] 713 ± 52 738 ± 81 0.493
2020). LPS total dose [µg] 178.6 ± 13.6 187.2 ± 25.8 0.422
Aspirated blood volume [ml] 0±0 755 ± 80 ≤0.001
Respiratory Signals
Crystalloid infusion [ml kg−1 ] 47 ± 6 46 ± 10 0.847
Airway flow was measured with the internal sensors of the
Colloids [mlkg−1 ] 7±6 8±8 0.843
ventilator. On the other hand, airway pressure was measured at
Norepinephrine [µg kg−1 ] 3±5 52 ± 53 0.036
the y-piece with a custom-made measurement system composed
Cumulative urine output [mL] 945 ± 489 809 ± 303 0.514
of a pressure transducer (163PC01D48-PCB; FirstSensors AG,
Berlin, Germany) and corresponding hardware and software for Mean ± SD; significance was accepted at P < 0.05. Differences between the two groups
amplification and recording (custom-built software written in were compared by Student’s t-test.
LabVIEW, National Instruments, Austin, TX, United States).
Furthermore, respiratory system elastance (ERS ) and resistance
(RRS ) were determined by the multiple linear regression of the the groups (P = 0.593). In the hypovolemia group, 755 ± 80 ml
linear equation of motion composed of the RRS and ERS two- of blood was drawn (Table 1), resulting in a significant decrease
compartmental model of the respiratory system. in ITBVI (baseline: 765 ± 79 ml m−2 vs. TLVsupine: 619 ±
122 ml m−2 ; P = 0.006) and GEDVI (baseline: 612 ± 63 ml
Statistical Analyses m−2 vs. TLVsupine: 496 ± 98 ml m−2 ; P = 0.006) at TLVsupine
Sample size calculation was based on the perfusion vs. baseline. In all the animals, the LPS infusion resulted in a
measurements of relative perfusion distribution by positron- significant increase in PVRI at TLVsupine vs. baseline (baseline:
emission tomography using 68 Ga-labeled microspheres from a 150 ± 53 dyn s cm−5 m−2 ; TLVsupine: 365 ± 243 dyn s cm−5
previous study of the group of authors on pigs under two-lung m−2 ; P = 0.006) and SVRI (baseline: 1,153 ± 237 dyn s cm−5
ventilation conditions and different levels of PEEP (Bluth et al., m−2 ; TLVsupine: 1,602 ± 579 dyn s cm−5 m−2 ; P = 0.014).
2019). In this study, we expected that the relative perfusion of the
ventilated lung during OLV would be higher than during TLV. Regional Pulmonary Blood Flow (Primary
Assuming an effect size of 2, we estimated that eight animals Endpoint)
per group would yield a power of 80% to detect the difference Compared with TLVsupine, the OLV resulted in the shift of
in the distributions of pulmonary perfusion between TLV and perfusion toward the ventilated left lung, irrespective of position
OLV in the supine, semilateral, lateral, and prone positions, with (Figures 2, 3, Table 2). During OLV, the relative perfusion of the
α = 0.01 corrected for multiple comparisons. The data were ventilated lung was higher in the lateral as compared with the
presented as mean and SD if not stated otherwise. The statistical supine position, while the relative perfusion of the non-ventilated
analysis was conducted with SPSS (Version 27, IBM Corp., lung was lower in the lateral position as compared with the
Armonk, NY, United States). Significance was accepted at P < supine and prone positions, and in the semilateral compared with
0.05. The differences between the two groups, respective body the prone position. The relative perfusions of the ventilated and
positions, and the sequences of interventions were compared non-ventilated lungs were not different between normovolemia
using a linear mixed-effects model with repeated measures, and hypovolemia.
using composite ventilation-position (levels: TLVsupine, In the ventilated left lung, the center of relative perfusion
OLVsupine, OLVsemilateral, OLVlateral, and OLVprone) as the along the left-right axis shifted toward the hilum during
within-subject factor and with group and sequence as between OLVsemilateral, OLVlateral, and OLVprone as compared with
subject-factors. The significance of the within-subject factors OLVsupine. Along the dorsal-ventral axis, the perfusion shifted
was corrected for sphericity according to Greenhouse–Geisser. toward the dorsal during OLVsemilateral, OLVlateral, and
Pairwise post-hoc multiple comparisons were also performed OLVprone as compared with OLVsupine. Along the caudal-
according to least significant difference (LSD) when appropriate. cranial axis, the perfusion shifted toward the cranial in the
semilateral position as compared with TLVsupine. The center of
RESULTS perfusion did not differ between normovolemia and hypovolemia
(Table 2).
Characteristics of Animal and The spatial heterogeneity of relative perfusion in the ventilated
Experimental Protocol left lung was highest during TLVsupine and lowest during OLV
Body weight, total time of anesthesia, total time on mechanical in the prone position, while there was no difference between
ventilation, the cumulative doses of crystalloids and colloids, normovolemia and hypovolemia (Table 2).
and total urine output did not differ significantly between
normovolemia and hypovolemia, while the cumulative Regional Ventilation (EIT)
norepinephrine dose was higher in hypovolemia than in In the ventilated left lung, the center of ventilation along the
normovolemia (Table 1). Hemoglobin was not different between left-right axis shifted toward the lung hilum during OLV in
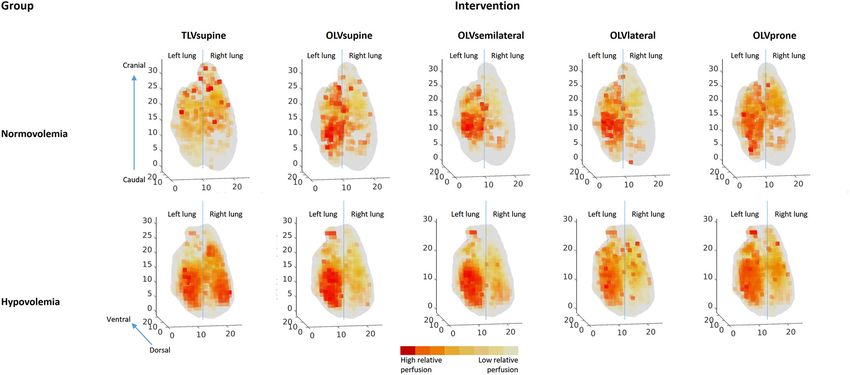
Frontiers in Physiology | www.frontiersin.org 5 September 2021 | Volume 12 | Article 717269Wittenstein et al. Perfusion During One-Lung Ventilation FIGURE 2 | Representative three-dimensional perfusion maps for one animal from each group. Lungs are shown from the dorsal with the left lung on the left side and right lung on the right side. Axes are divided in cm. Lighter colors represent lower relative pulmonary perfusions, while darker colors represent higher relative pulmonary perfusions. FIGURE 3 | Relative perfusion of the left and right lungs. Mean and single values. Significance was accepted at P < 0.05. Differences between the two groups, respective body positions, and the sequences of interventions were compared using a linear mixed-effects model with repeated measures, with TLVsupine, OLVsupine, OLVsemilateral, OLVlateral, and OLVprone as within-subject factors and with group and sequence as fixed between subject-factors. The significance of the within-subject factors was corrected for sphericity according to Greenhouse–Geisser. Pairwise post-hoc multiple comparisons were performed according to LSD when appropriate. #P < 0.05 TLVsupine vs. all the others, *P < 0.05. The relative perfusions of the ventilated and the non-ventilated lungs were not different between normo- and hypovolemia (P = 0.457 and P = 0.418, respectively). Mixed effects position × group ventilated lung: P = 0.852 and mixed effects position × group non-ventilated lung: P = 0.891. all positions as compared with TLVsupine. Furthermore, it also Gas Exchange shifted toward the lung hilum during OLV in the prone as The variables of gas exchange are summarized in Table 4, where compared with the lateral position (Table 3). In addition, the PaO2 /FI O2 differed significantly between TLVsupine and OLV in center of ventilation along the dorsal-ventral axis of the left lung all the positions. It was higher in the lateral as compared with shifted toward the dorsal during OLV in the prone as compared the other positions during OLV, while there was no difference with the supine position. The center of ventilation along the between normovolemia and hypovolemia. Additionally, PaCO2 left-right and dorsoventral axes did not differ among the in the arterial blood gas analysis differed significantly between groups (Table 3). TLVsupine and OLV in all the positions, while it was not Frontiers in Physiology | www.frontiersin.org 6 September 2021 | Volume 12 | Article 717269
Frontiers in Physiology | www.frontiersin.org

                                                                                                                                                                                                                                                                                           Wittenstein et al.
                                                TABLE 2 | Perfusion of the left lung.

                                                Variable                         Group      TLVsupine                    OLVsupine                 OLVsemilateral           OLVlateral               OLVprone              Sequence P =      Group P =       Position P =      ME P =

                                                Center of perfusion left-right   Normo      30.7 ± 5.0         p         28.8 ± 3.6     se, l, p        31.6 ± 2.6      p    31.1 ± 4.2     p        32.8 ± 2.6                0.614            0.695           ≤0.001          0.368
                                                axis [% from left]               Hypo       28.5 ± 4.9                   29.0 ± 3.3                     29.9 ± 3.5           30.8 ± 3.1              33.4 ± 2.7
                                                Center of perfusion              Normo      27.5 ± 3.6                   28.9 ± 3.0     sl, l, p        27.1 ± 3.1           27.3 ± 2.9              27.5 ± 3.0                0.673            0.948            0.025          0.627
                                                dorsal-ventral axis [% from      Hypo       27.5 ± 4.4                   28.3 ± 3.9                     27.7 ± 4.1           27.5 ± 3.3              27.7 ± 3.8
                                                dorsal]
                                                Center of perfusion              Normo      45.4 ± 6.0         sl        46.0 ± 5.2                     46.8 ± 4.6           46.1 ± 4.7              45.2 ± 3.1                0127             0.462            0.048          0.444
                                                caudal-cranial axis [% from      Hypo       42.9 ± 3.7                   44.2 ± 4.1                     46.1 ± 4.5           45.0 ± 4.0              45.3 ± 3.5
                                                caudal]
                                                CV of relative perfusion %       Normo     157.9 ± 19.1     sl, l, p    154.4 ± 11.2                   151.4 ± 15.9         147.2 ± 10.3            139.4 ± 10.4   s, se       0.026            0.075           ≤0.001          0.104
                                                                                 Hypo      180.0 ± 24.3                 153.4 ± 14.7                   152.9 ± 14.9         145.4 ± 8.4             143.8 ± 8.0

                                                Mean ± SD; Normo, normovolemia group; Hypo, hypovolemia group; TLV, two-lung ventilation; OLV, one-lung ventilation; CV, coefficient of variation; ME, mixed effects position × group. Significance was accepted at P < 0.05. The
                                                differences between the two groups, respective body positions, and the sequences of interventions were compared using a linear mixed-effects model with repeated measures, with TLVsupine, OLVsupine, OLVsemilateral, OLVlateral, and
                                                OLVprone as within-subject factors and with group and sequence as fixed between subject-factors. The significance of the within-subject factors was corrected for sphericity according to Greenhouse–Geisser. Pairwise post-hoc multiple
                                                comparisons were performed according to least significant difference (LSD) when appropriate. s P < 0.05 vs. OLVsupine, se P < 0.05 vs. OLVsemilateral, l P < 0.05 vs. OLVlateral, and p P < 0.05 vs. OLVprone.

                                                TABLE 3 | Electrical impedance tomography of the left lung.
7

                                                Variable                                Group     TLVsupine                       OLVsupine             OLVsemilateral         OLVlateral             OLVprone         Sequence P =        Group P =        Position P =       ME P =

                                                CoVleftright [% from left)              Normo     51.1 ± 3.9        s, se, l, p    50 ± 3.6                56.5 ± 4.3           55 ± 3.7        p     54.8 ± 3.4            0.527             0.456            ≤0.001           0.743
                                                                                        Hypo      51.6 ± 3.2                      51.8 ± 3.4               56.5 ± 1.8          56.3 ± 2.3             54.3 ± 3.6
                                                CoVdorso-ventral [% from dorsal]        Normo     49.6 ± 1.9                      49.2 ± 1.6       p       49.8 ± 1.5          49.6 ± 1.4             48.9 ± 1.4            0.822             0.636             0.040           0.958
                                                                                        Hypo      49.1 ± 2.2                      49.3 ± 1.6                50 ± 1.2             50 ± 1               49.4 ± 1.8

                                                Mean ± SD; Normo, normovolemia group; Hypo, hypovolemia group; TLV, two-lung ventilation; OLV, one-lung ventilation; CoV, center of ventilation along the left-right and dorso-ventral axes; ME, mixed effects position × group.
                                                Significance was accepted at P < 0.05. Differences between the two groups, respective body positions, and the sequences of interventions were compared using a linear mixed-effects model with repeated measures, with TLVsupine,
                                                OLVsupine, OLVsemilateral, OLVlateral, and OLVprone as within-subject factors and with group and sequence as fixed between subject factors. The significance of the within-subject factors was corrected for sphericity according to
                                                Greenhouse–Geisser. Pairwise post-hoc multiple comparisons were performed according to LSD when appropriate. s P < 0.05 vs. OLVsupine, se P < 0.05 vs. OLVsemilateral, l P < 0.05 vs. OLVlateral, and p P < 0.05 vs. OLVprone.
September 2021 | Volume 12 | Article 717269

                                                                                                                                                                                                                                                                                           Perfusion During One-Lung Ventilation
Wittenstein et al. Perfusion During One-Lung Ventilation
ME P =
Mean ± SD; Normo, normovolemia group; Hypo, hypovolemia group; BL, baseline; TLV, two-lung ventilation; OLV, one-lung ventilation; pHa, arterial pH, FI O2 , fraction of inspired oxygen; PaO2 , arterial partial pressure of oxygen; PaCO2 ,
arterial partial pressure of carbon dioxide, SaO2 , arterial oxygen saturation; SvO2 , mixed venous oxygen saturation; ME, mixed effects position × group. Significance was accepted at P < 0.05. Differences between the two groups,
respective body positions, and the sequences of interventions were compared using a linear mixed-effects model with repeated measures, with TLVsupine, OLVsupine, OLVsemilateral, OLVlateral, and OLVprone as within-subject factors
and with group and sequence as fixed between subject-factors. The significance of the within-subject factors was corrected for sphericity according to Greenhouse–Geisser. Pairwise post-hoc multiple comparisons were performed
different for the different positions during OLV, and there was no
0.629
0.273
0.940
0.603
0.459
group difference. Arterial pH also differed significantly between
TLVsupine and OLV in all the positions, while it was similar in
Position P =
the different positions during OLV. Arterial pH was lower in
≤0.001
≤0.001
≤0.001
≤0.001
≤0.001
hypovolemic as compared with normovolemic animals. Mixed
venous oxygen saturation was significantly different between
TLVsupine and OLVsupine and between OLVsemilateral and
OLVprone. Furthermore, the mixed venous oxygen saturation
Group P =
0.304
0.425
0.878
0.578
0.578
was higher during OLVlateral compared with OLVsupine and
OLVprone. There was no difference between the two groups.
Hemodynamic and Respiratory Variables
Sequence P =
Hemodynamic and respiratory variables are summarized in the
0.481
0.464
0.936
0.862
0.862
(Supplementary Material Tables 1, 2).
DISCUSSION
7.29 ± 0.08
7.25 ± 0.11
In a model of thoracic surgery and OLV with normovolemia and
OLVprone
64 ± 13
69 ± 15
94 ± 24
65 ± 13
61 ± 16
78 ± 9
91 ± 8
89 ± 8
moderate hypovolemia in pigs, we found that (1) the relative
pulmonary blood flow of the ventilated lung was highest in
according to LSD when appropriate. s P < 0.05 vs. OLVsupine, se P < 0.05 vs. OLVsemilateral, l P < 0.05 vs. OLVlateral, and p P < 0.05 vs. OLVprone.
the lateral position and lowest in the supine position; (2) the
s, se, p
relative pulmonary blood flow of the non-ventilated lung was
s, p
s
lowest in the lateral position and highest in the supine and
prone positions; (3) the spatial heterogeneity of pulmonary blood
7.31 ± 0.08
7.26 ± 0.12
OLVlateral
123 ± 45
101 ± 14
flow of the ventilated lung was lowest in the prone position; (4)
63 ± 11
69 ± 15
67 ± 12
95 ± 5
94 ± 5
76 ± 9
PaO2 /FI O2 during OLV was highest in the lateral position; and
(5) hypovolemia did not influence the distribution of perfusion,
irrespective of body position.
To the knowledge of the authors, this is the first in vivo
OLVsemilateral
7.25 ± 0.11
7.28 ± 0.1
study that systematically investigated the effects of body position
66 ± 12
69 ± 13
89 ± 20
80 ± 24
64 ± 10
65 ± 12
91 ± 6
90 ± 9
and intravascular volume status on the distribution of relative
pulmonary perfusion during OLV in a clinically relevant model of
thoracic surgery. Previous physiological studies have investigated
the effects of OLV through either a closed chest or minor
l
surgeries (Bardoczky et al., 2000; Szegedi et al., 2010). In contrast,
7.29 ± 0.08
7.23 ± 0.13
OLVsupine
65 ± 13
72 ± 17
78 ± 18
85 ± 26
85 ± 10
62 ± 14
90 ± 7
64 ± 9
major surgeries trigger the inflammatory cascade (Hannon et al.,
1990; Kiss et al., 2019), which can blunt HPV (Himmat et al.,
2018) and interfere with the distribution of pulmonary perfusion.
We also used LPSs to mimic the inflammatory response to
s, se, l, p
s, se, l, p
s, se, l, p
s, se, l, p
s, se, p
major thoracic surgery, which was previously shown to reliably
reduce hypoxic pulmonary vasoconstriction (Reeves and Grover,
1974; Theissen et al., 1991) while not altering hemodynamics
7.39 ± 0.03
7.39 ± 0.06
TLVsupine
562 ± 45
565 ± 64
100 ± 0
78 ± 12
53 ± 5
51 ± 7
99 ± 4
79 ± 6
significantly (Traber et al., 1989). Another strength of this
study is that normovolemia and moderate hypovolemia (Silva
et al., 2013), both of which may occur during thoracic surgery
(Nakamura et al., 2015) and can influence HPV (Deem et al.,
7.38 ± 0.04
7.42 ± 0.07
504 ± 105
509 ± 50
50 ± 12
100 ± 1
100 ± 1
54 ± 6
77 ± 7
78 ± 6
1995), were addressed. We chose the left semilateral and lateral
BL
decubitus positions because of the fact that the effects of
mediastinal compression are more pronounced in the left than
in the right semilateral and lateral positions (Chang et al., 2002).
Normo
Normo
Normo
Normo
Normo
Group
Hypo
Hypo
Hypo
Hypo
Hypo
TABLE 4 | Gas exchange.
Effects of Body Position on Regional
FI O2 /PaO2 [mmHg]
Pulmonary Perfusion and Ventilation
PaCO2 [mmHg]
The finding that the relative perfusion of the ventilated lung
was highest in the lateral decubitus position during OLV is
SaO2 [%]
SvO2 [%]
Variable
in line with clinical data (Bardoczky et al., 2000; Szegedi
pHa
et al., 2010). In the lateral decubitus position, gravitational
Frontiers in Physiology | www.frontiersin.org 8 September 2021 | Volume 12 | Article 717269Wittenstein et al. Perfusion During One-Lung Ventilation
forces, in addition to HPV, reduce the blood flow of the study, the lower arterial pH in the hypovolemia group might
non-ventilated lung. Furthermore, HPV also allows ventilation- have counteracted the deleterious effects of hypovolemia on HPV,
perfusion matching by reducing perfusion to poorly oxygenated resulting in similar regional perfusions for both groups. However,
lung tissue through smooth muscle contractions in primarily the differences in the arterial pH between the groups were small
low-resistance pulmonary arteries (Weir et al., 2005). In addition and most likely clinically irrelevant.
to HPV, hypercapnic pulmonary vasoconstriction (HCPV)
reduces perfusion to hypo-ventilated and, therefore, hypercapnic Intravascular Volume Status
lung regions (Dorrington et al., 2010). In the supine and The finding rejects the hypothesis that intravascular hypovolemia
prone positions, HPV, HCPV, and regional mechanical forces influences regional pulmonary perfusion, which is in contrast
determine regional pulmonary perfusion, while gravity does with previous studies. In isolated rat lungs perfused with plasma,
not influence the shift of perfusion toward the ventilated lung HPV was weakened, when compared with lungs perfused with
(Szegedi et al., 2010). In addition to the geometry of the vascular blood (McMurtry et al., 1977; Deem et al., 1998). Similar results
tree, which branches asymmetrically (Glenny and Robertson, were found in isolated rat, cat, and rabbit lungs (Hakim and
2011) regional mechanical forces in the ventilated lung determine Malik, 1988). In this experiment, we performed low-dose LPS
the distribution of pulmonary blood flow. Regional mechanical infusions in both groups, which altered pulmonary vascular
forces are defined by tissue deformation, thorax shape (Tawhai resistance (Theissen et al., 1991), possibly masking the further
et al., 2009), and mechanical ventilation (Alfery et al., 1981). High effects of acute intravascular hypovolemia on the distribution
airway pressures can divert the blood flow from the ventilated to of pulmonary perfusion. As stated, during OLV in the supine
the non-ventilated lung by compressing the capillaries. In fact, and prone positions, the distribution of regional perfusion to the
peak, mean, and plateau airway pressures were higher during ventilated and non-ventilated lungs is mainly determined with
OLVsupine as compared with OLVlateral, possibly contributing HPV, HCPV, and lung volume, with gravity playing a minor role.
to lower relative perfusion of the ventilated lung in this position. Therefore, the most pronounced effects of acute intravascular
HPV, HCPV, gravity, and regional mechanical forces as well as hypovolemia would be expected in these positions. However,
lung volume do not only influence the distribution of blood flow even in OLVsupine and OLVprone, we found no differences
toward the ventilated and non-ventilated lung but also determine between the groups, supporting the claim that an acute moderate
its regional distribution within the ventilated lung. In fact, during hemorrhage during thoracic surgery only has a minor effect on
OLV, the lateral position center of perfusion along the left-right the distribution of pulmonary perfusion.
axis shifted toward the lung hilum as compared with the supine
position, while the center of ventilation along the left-right axis Possible Clinical Implications
shifted toward peripheral lung areas as compared with the supine The results suggest that the lateral decubitus position may
position, possibly resulting in improved ventilation-perfusion serve as a means to improve the distribution of perfusion
matching. This might represent another mechanism of better gas and oxygenation during OLV. In fact, during OLV in the
exchange for this body position during OLV. supine, semilateral, and prone positions, but not the lateral
During OLV in the semilateral position, HPV is augmented decubitus position, the central venous oxygen saturation was
by gravity. In line with our results, in a small clinical trial arterial lower than 70%, indicating tissue hypoxia (Sevuk et al., 2016) in
saturation as a surrogate for regional pulmonary perfusion was the normovolemia group. Interestingly, moderate hypovolemia
not different between semilateral and lateral position (Watanabe did not influence the distribution of perfusion and shunting,
et al., 2000). Thirty-three adult patients undergoing right challenging the concept that the intravascular volume expansion
thoracotomy with left OLV were divided into three groups: in patients with volume depletion might be useful for the reversal
supine position (n = 11), left semilateral decubitus position (n = of hypoxemia during OLV.
9), and left lateral decubitus position (n = 13). The final PaO2 and
SaO2 at the end of the OLV were lowest in the supine position, Limitations
while there was no difference between the semilateral and lateral This study has several limitations. First, the thoracic surgery
decubitus positions (Watanabe et al., 2000). model did not fully represent the clinical scenario, especially
because of the lack of the surgical manipulation of the
Gas Exchange lungs and its potential effects on atelectasis in the dependent
The fact that PaO2 /FI O2 was higher during OLV in lateral as lung and pulmonary vascular resistance. Furthermore, the
compared with the supine, semilateral, and prone positions can absolute values of ITBVI, GEDVI, and EVLWI in this study
be explained by the differences in regional pulmonary perfusion, need to be interpreted with caution, since there were no
namely, the lower perfusion of the non-ventilated lung and reference tables and they vary between species (Längin et al.,
the better ventilation-perfusion matching of the ventilated lung. 2020). Additionally, HPV is more pronounced in pigs than
The gas exchange itself, especially hypercapnia, may influence in humans and other species (Tucker and Rhodes, 2001).
intrapulmonary shunt and HPV (Benumof et al., 1976). However, Thus, we could not extrapolate the findings directly to human
PaCO2 did not differ significantly during OLV in the four patients. Second, we addressed only the short-term effects of
positions and the groups. Nevertheless, arterial pH was lower the different body positions during OLV, although OLV is
in the hypovolemia group. Furthermore, lower arterial pH has usually limited to short periods. Third, we did not measure
the potential to increase HPV (Brimioulle et al., 1990). In this lactate as a surrogate of organ hypoxia. However, we determined
Frontiers in Physiology | www.frontiersin.org 9 September 2021 | Volume 12 | Article 717269Wittenstein et al. Perfusion During One-Lung Ventilation
mixed venous oxygen saturation, which is an important in the analyses of the data. JW, XR, YZ, DK, ST, RT, YC,
marker for the oxygen supply of organs (Janotka and Ostadal, JF, SM, and RH cut and soaked the lungs and measured and
2021). analyzed fluorescence. JW, MS, MJS, TB, TK, PR, PP, MG,
and RH wrote the draft of the manuscript. All authors have
CONCLUSIONS read and approved the submitted manuscript, agreed to be
accountable for the content of the article, and agreed with
During OLV in endotoxemic pigs, the relative perfusion of the its publication.
ventilated lung and oxygenation were higher in the lateral than
the supine position and not impaired by hypovolemia.
FUNDING
DATA AVAILABILITY STATEMENT This study was supported by departmental funds.
The raw data supporting the conclusions of this article will be
made available by the authors, without undue reservation. ACKNOWLEDGMENTS
We thank the research fellows of the Pulmonary Engineering
ETHICS STATEMENT Group, University Hospital Carl Gustav Carus, and Technische
Universität Dresden, Germany, for their assistance in conducting
The animal study was reviewed and approved by Landesdirektion
the experiments.
Sachsen, 09105 Chemnitz.
AUTHOR CONTRIBUTIONS SUPPLEMENTARY MATERIAL
JW, MS, TK, RH, and MG planned and designed the study. The Supplementary Material for this article can be found
JW, MS, XR, DK, ST, RT, and RH conducted the experiments. online at: https://www.frontiersin.org/articles/10.3389/fphys.
JW, MS, YC, TB, TK, MS, PR, PP, MG, and RH were involved 2021.717269/full#supplementary-material
REFERENCES functional role within the healthy human lung. J. Appl. Physiol. 108, 1084–1096.
doi: 10.1152/japplphysiol.90963.2008
Alfery, D. D., Benumof, J. L., and Trousdale, F. R. (1981). Improving oxygenation Glenny, R. W., and Robertson, H. T. (2011). Determinants of pulmonary blood
during one-lung ventilation in dogs: the effects of positive end-expiratory flow distribution. Compr. Physiol. 1, 39–59. doi: 10.1002/cphy.c090002
pressure and blood flow restriction to the nonventilated lung. Anesthesiology Hakim, T. S., and Malik, A. B. (1988). Hypoxic vasoconstriction in
55, 381–385. doi: 10.1097/00000542-198110000-00008 blood and plasma perfused lungs. Respir. Physiol. 72, 109–121.
Bardoczky, G. I., Szegedi, L. L., d’Hollander, A. A., Moures, J. M., de Francquen, doi: 10.1016/0034-5687(88)90083-7
P., and Yernault, J. C. (2000). Two-lung and one-lung ventilation in patients Hannon, J. P., Bossone, C. A., and Wade, C. E. (1990). Normal physiological
with chronic obstructive pulmonary disease: the effects of position and F(IO)2. values for conscious pigs used in biomedical-research. Lab. Anim. Sci. 40,
Anesth. Analg. 90, 35–41. doi: 10.1097/00000539-200001000-00008 293–298.
Benumof, J. L., Mathers, J. M., and Wahrenbrock, E. A. (1976). Cyclic hypoxic Hedenstierna, G., Tokics, L., Strandberg, A., Lundquist, H., and Brismar, B.
pulmonary vasoconstriction induced by concomitant carbon dioxide changes. (1986). Correlation of gas exchange impairment to development of atelectasis
J. Appl. Physiol. 41, 466–469. doi: 10.1152/jappl.1976.41.4.466 during anaesthesia and muscle paralysis. Act aAnaesthesiol. Scand. 30, 183–191.
Bluth, T., Kiss, T., Kircher, M., Braune, A., Bozsak, C., Huhle, R., et al. doi: 10.1111/j.1399-6576.1986.tb02393.x
(2019). Measurement of relative lung perfusion with electrical impedance and Himmat, S., Alzamil, A., Aboelnazar, N., Hatami, S., White, C., Dromparis, P.,
positron emission tomography: an experimental comparative study in pigs. Br. et al. (2018). A decrease in hypoxic pulmonary vasoconstriction correlates with
J. Anaesth. 123, 246–254. doi: 10.1016/j.bja.2019.04.056 increased inflammation during extended normothermic ex vivo lung perfusion.
Brimioulle, S., Lejeune, P., Vachiery, J. L., Leeman, M., Melot, C., and Naeije, R. Artif. Organs. 42, 271–279. doi: 10.1111/aor.13017
(1990). Effects of acidosis and alkalosis on hypoxic pulmonary vasoconstriction Janotka, M., and Ostadal, P. (2021). Biochemical markers for clinical
in dogs. Am. J. Physiol. 258, H347–353. doi: 10.1152/ajpheart.1990.258.2.H347 monitoring of tissue perfusion. Mol. Cell. Biochem. 476, 1313–1326.
Chang, H., Lai-Fook, S. J., Domino, K. B., Schimmel, C., Hildebrandt, J., doi: 10.1007/s11010-020-04019-8
Robertson, H. T., et al. (2002). Spatial distribution of ventilation and Kazan, R., Bracco, D., and Hemmerling, T. M. (2009). Reduced cerebral oxygen
perfusion in anesthetized dogs in lateral postures. J. Appl. Physiol. 92, 745–62. saturation measured by absolute cerebral oximetry during thoracic surgery
doi: 10.1152/japplphysiol.00377.2001 correlates with postoperative complications. Br. J. Anaesth. 103, 811–816.
Deem, S., Bishop, M. J., and Alberts, M. K. (1995). Effect of anemia on doi: 10.1093/bja/aep309
intrapulmonary shunt during atelectasis in rabbits. J. Appl. Physiol. 79, Kelley, K. W., Curtis, S. E., Marzan, G. T., Karara, H. M., and Anderson, C.
1951–1957. doi: 10.1152/jappl.1995.79.6.1951 R. (1973). Body surface area of female swine. J. Anim. Sci. 36, 927–930.
Deem, S., Swenson, E. R., Alberts, M. K., Hedges, R. G., and Bishop, M. J. doi: 10.2527/jas1973.365927x
(1998). Red-blood-cell augmentation of hypoxic pulmonary vasoconstriction: Kiss, T., Bluth, T., Braune, A., Huhle, R., Denz, A., Herzog, M., et al.
hematocrit dependence and the importance of nitric oxide. Am. J. Respir. Crit. (2019). Effects of positive end-expiratory pressure and spontaneous
Care Med. 157, 1181–1186. doi: 10.1164/ajrccm.157.4.9707165 breathing activity on regional lung inflammation in experimental
Dorrington, K. L., Balanos, G. M., Talbot, N. P., and Robbins, P. A. (2010). acute respiratory distress syndrome. Crit. Care Med. 47, e358–e365.
Extent to which pulmonary vascular responses to PCO2 and PO2 play a doi: 10.1097/CCM.0000000000003649
Frontiers in Physiology | www.frontiersin.org 10 September 2021 | Volume 12 | Article 717269Wittenstein et al. Perfusion During One-Lung Ventilation
Längin, M., Konrad, M., Reichart, B., Mayr, T., Vandewiele, S., Postrach, J., et al. endotoxin infusion in unanesthetized sheep. J. Appl. Physiol. 70, 2120–2125.
(2020). Hemodynamic evaluation of anesthetized baboons and piglets by doi: 10.1152/jappl.1991.70.5.2120
transpulmonary thermodilution: normal values and interspecies differences Traber, D. L., Flynn, J. T., Herndon, D. N., Redl, H., Schlag, G., and Traber,
with respect to xenotransplantation. Xenotransplantation 27:e12576. L. D. (1989). Comparison of the cardiopulmonary responses to single bolus
doi: 10.1111/xen.12576 and continuous infusion of endotoxin in an ovine model. Circ. Shock.
McMurtry, I. F., Hookway, B. W., and Roos, S. (1977). Red blood cells play a crucial 27, 123–138.
role in maintaining vascular reactivity to hypoxia in isolated rat lungs. Chest. Tucker, A., and Rhodes, J. (2001). Role of vascular smooth muscle in the
71(2 suppl):253–256. doi: 10.1378/chest.71.2_Supplement.253 development of high altitude pulmonary hypertension: an interspecies
Nakamura, H., Saji, H., Kurimoto, N., Shinmyo, T., and Tagaya, R. (2015). Impact evaluation. High Alt. Med. Biol. 2, 173–189. doi: 10.1089/152702901750265288
of intraoperative blood loss on long-term survival after lung cancer resection. Watanabe, S., Noguchi, E., Yamada, S., Hamada, N., and Kano, T.
Ann. Thorac. Cardiovasc. Surg. 21, 18–23. doi: 10.5761/atcs.oa.13-00312 (2000). Sequential changes of arterial oxygen tension in the supine
Percie du Sert, N., Hurst, V., Ahluwalia, A., Alam, S., Avey, M. T., Baker, M., et al. position during one-lung ventilation. Anesth. Analg. 90, 28–34.
(2020). The ARRIVE guidelines 2.0: updated guidelines for reporting animal doi: 10.1097/00000539-200001000-00007
research. PLoS Biol. 18:e3000410. doi: 10.1371/journal.pbio.3000410 Weir, E. K., López-Barneo, J., Buckler, K. J., and Archer, S. L. (2005). Mechanisms
Reeves, J. T., and Grover, R. F. (1974). Blockade of acute hypoxic of disease acute oxygen-sensing mechanisms. N. Engl. J. Med. 353, 2042–2055.
pulmonary hypertension by endotoxin. J. Appl. Physiol. 36, 328–332. doi: 10.1056/NEJMra050002
doi: 10.1152/jappl.1974.36.3.328 West, J. B., Dollery, C. T., and Naimark, A. (1964). Distribution of blood flow in
Sánchez-Pedrosa, G., VaraAmeigeiras, E., Casanova Barea, J., Rancan, L., isolated lung; relation to vascular and alveolar pressures. J. Appl. Physiol. 19,
SimónAdiego, C. M., and GaruttiMartínez, I. (2018). Role of surgical 713–724. doi: 10.1152/jappl.1964.19.4.713
manipulation in lung inflammatory response in a model of lung Wittenstein, J., Scharffenberg, M., Ran, X., Keller, D., Michler, P., Tauer, S., et al.
resection surgery. Interact. Cardiovasc. Thorac. Surg. 27, 870–877. (2020). Comparative effects of flow vs. volume-controlled one-lung ventilation
doi: 10.1093/icvts/ivy198 on gas exchange and respiratory system mechanics in pigs. Intensive Care Med.
Schirren, M., Sponholz, S., Oguhzan, S., Kudelin, N., Ruf, C., Trainer, S., et al. Exp. 8(Suppl. 1):24. doi: 10.1186/s40635-020-00308-0
(2015). Intraoperative Blutungen in der Thoraxchirurgie. Chirurg 86, 453–458.
doi: 10.1007/s00104-015-2999-8 Conflict of Interest: MG received consultation fees from Dräger, Ambu, GE
Sevuk, U., Altindag, R., Baysal, E., Yaylak, B., Adiyaman, M. S., Akkaya, S., et al. Healthcare, and ZOLL.
(2016). The effects of hyperoxaemia on tissue oxygenation in patients with a
nadir haematocrit lower than 20% during cardiopulmonary bypass. Perfusion The remaining authors declare that the research was conducted in the absence of
31, 232–239. doi: 10.1177/0267659115595281 any commercial or financial relationships that could be construed as a potential
Silva, P. L., Guldner, A., Uhlig, C., Carvalho, N., Beda, A., Rentzsch, I., et al. (2013). conflict of interest.
Effects of intravascular volume replacement on lung and kidney function and
damage in nonseptic experimental lung injury. Anesthesiology 118, 395–408.
Publisher’s Note: All claims expressed in this article are solely those of the authors
doi: 10.1097/ALN.0b013e31827e554c
Szegedi, L. L., D’Hollander, A. A., Vermassen, F. E., Deryck, F., and Wouters, and do not necessarily represent those of their affiliated organizations, or those of
P. F. (2010). Gravity is an important determinant of oxygenation the publisher, the editors and the reviewers. Any product that may be evaluated in
during one-lung ventilation. Acta Anaesthesiol. Scand. 54, 744–750. this article, or claim that may be made by its manufacturer, is not guaranteed or
doi: 10.1111/j.1399-6576.2010.02238.x endorsed by the publisher.
Takenaka, K., Ogawa, E., Wada, H., and Hirata, T. (2006). Systemic inflammatory
response syndrome and surgical stress in thoracic surgery. J. Crit. Care. 21, Copyright © 2021 Wittenstein, Scharffenberg, Ran, Zhang, Keller, Tauer, Theilen,
48–53; discussion 53-55. doi: 10.1016/j.jcrc.2005.07.001 Chai, Ferreira, Müller, Bluth, Kiss, Schultz, Rocco, Pelosi, Gama de Abreu and Huhle.
Tawhai, M. H., Nash, M. P., Lin, C.-L., and Hoffman, E. A. (2009). Supine This is an open-access article distributed under the terms of the Creative Commons
and prone differences in regional lung density and pleural pressure gradients Attribution License (CC BY). The use, distribution or reproduction in other forums
in the human lung with constant shape. J. Appl. Physiol. 107, 912–20. is permitted, provided the original author(s) and the copyright owner(s) are credited
doi: 10.1152/japplphysiol.00324.2009 and that the original publication in this journal is cited, in accordance with accepted
Theissen, J. L., Loick, H. M., Curry, B. B., Traber, L. D., Herndon, D. N., and academic practice. No use, distribution or reproduction is permitted which does not
Traber, D. L. (1991). Time course of hypoxic pulmonary vasoconstriction after comply with these terms.
Frontiers in Physiology | www.frontiersin.org 11 September 2021 | Volume 12 | Article 717269You can also read