Mapping lymphatic filariasis in Loa loa endemic health districts naïve for ivermectin mass administration and situated in the forested zone of ...
←
→
Page content transcription
If your browser does not render page correctly, please read the page content below
Beng et al. BMC Infectious Diseases   (2020) 20:284
https://doi.org/10.1186/s12879-020-05009-3

 RESEARCH ARTICLE                                                                                                                                    Open Access

Mapping lymphatic filariasis in Loa loa
endemic health districts naïve for
ivermectin mass administration and
situated in the forested zone of Cameroon
Andrew A. Beng1,2, Mathias E. Esum1,2, Kebede Deribe3,4*, Abdel J. Njouendou1,2, Patrick W. C. Ndongmo1,2,
Raphael A. Abong1,2, Jerome Fru1,2, Fanny F. Fombad1,2, Gordon T. Nchanji1,2, Glory Amambo1,2,
Narcisse T. V. Gandjui1,2, Benjamin Biholong5, Georges Nko’Ayissi5, Patrick Mbia6, Julie Akame6, Peter I. Enyong1,2,
Steven D. Reid7, Jean J. Tougoue8, Yaobi Zhang7,9 and Samuel Wanji1,2

  Abstract
  Background: The control of lymphatic filariasis (LF) caused by Wuchereria bancrofti in the Central African Region
  has been hampered by the presence of Loa loa due to severe adverse events that arise in the treatment with
  ivermectin. The immunochromatographic test (ICT) cards used for mapping LF demonstrated cross-reactivity with L.
  loa and posed the problem of delineating the LF map. To verify LF endemicity in forest areas of Cameroon where
  mass drug administration (MDA) has not been ongoing, we used the recently developed strategy that combined
  serology, microscopy and molecular techniques.
  Methods: This study was carried out in 124 communities in 31 health districts (HDs) where L. loa is present. At least
  125 persons per site were screened. Diurnal blood samples were investigated for circulating filarial antigen (CFA) by
  FTS and for L. loa microfilariae (mf) using TBF. FTS positive individuals were further subjected to night blood
  collection for detecting W. bancrofti. qPCR was used to detect DNA of the parasites.
  Results: Overall, 14,446 individuals took part in this study, 233 participants tested positive with FTS in 29 HDs, with
  positivity rates ranging from 0.0 to 8.2%. No W. bancrofti mf was found in the night blood of any individuals but L.
  loa mf were found in both day and night blood of participants who were FTS positive. Also, qPCR revealed that no
  W. bancrofti but L.loa DNA was found with dry bloodspot. Positive FTS results were strongly associated with high L.
  loa mf load. Similarly, a strong positive association was observed between FTS positivity and L loa prevalence.
  Conclusions: Using a combination of parasitological and molecular tools, we were unable to find evidence of W.
  bancrofti presence in the 31 HDs, but L. loa instead. Therefore, LF is not endemic and LF MDA is not required in
  these districts.
  Keywords: Wuchereria bancrofti, FTS test, qPCR, Loa loa, Ivermectin, Forested zone

* Correspondence: kebededeka@yahoo.com
3
 Centre for Global Health Research, Brighton and Sussex Medical School,
Brighton BN1 9PS, UK
4
 School of Public Health, College of Health Sciences, Addis Ababa University,
P.O. Box 9086, Addis Ababa, Ethiopia
Full list of author information is available at the end of the article

                                         © The Author(s). 2020 Open Access This article is licensed under a Creative Commons Attribution 4.0 International License,
                                         which permits use, sharing, adaptation, distribution and reproduction in any medium or format, as long as you give
                                         appropriate credit to the original author(s) and the source, provide a link to the Creative Commons licence, and indicate if
                                         changes were made. The images or other third party material in this article are included in the article's Creative Commons
                                         licence, unless indicated otherwise in a credit line to the material. If material is not included in the article's Creative Commons
                                         licence and your intended use is not permitted by statutory regulation or exceeds the permitted use, you will need to obtain
                                         permission directly from the copyright holder. To view a copy of this licence, visit http://creativecommons.org/licenses/by/4.0/.
                                         The Creative Commons Public Domain Dedication waiver (http://creativecommons.org/publicdomain/zero/1.0/) applies to the
                                         data made available in this article, unless otherwise stated in a credit line to the data.
Beng et al. BMC Infectious Diseases   (2020) 20:284                                                             Page 2 of 11

Background                                                     sensitivity of the ICT test in detecting W. bancrofti in
Lymphatic filariasis (LF) is a chronic, debilitating vector-   low prevalence settings [15, 16]. Recently, a new strategy
borne disease caused by the filarial parasites Wuchereria      was developed to assess LF in co-endemic areas with
bancrofti, Brugia malayi and B. timori. It is transmitted      other filariae [17].
by Culex, Anopheles and Mansonia mosquitoes respect-             To verify LF endemicity in forested areas in Cameroon
ively [1]. In 1997, the World Health Organization              where mass drug administration has not been started,
(WHO) targeted LF for elimination by 2020 through a            this new strategy was applied using a combination of
strategy of mass drug administration (MDA) [2, 3]. By          serological (FTS), parasitological (TBF) and molecular
the year 2000, WHO reported that, nearly 1.4 billion           biological (qPCR) techniques.
people in 73 countries worldwide were at risk of LF,
with an estimated number of 120 million people in-             Methods
fected, and about 40 million people disfigured and inca-       Study sites
pacitated by the disease [4]. Based on recent WHO              The study was carried out in 31 health districts, located
reports [5], LF elimination as a public health problem         in 4 Regions in the forest zone of Cameroon. Thirteen
was validated in several countries and 893 million people      health districts were surveyed in the East, 10 health dis-
in 49 countries worldwide remain threatened by lymph-          tricts were in the Center Region, four health districts
atic filariasis and require preventive chemotherapy.           each were in the South and Littoral Regions respectively.
   In order to carry out MDA, LF must be mapped to de-         A total of 124 communities were involved, 4 from each
lineate areas where MDA is required and preventive             of the 31 health districts. (Fig. 1; Supplementary material
chemotherapy (PC) given to the eligible population (in         Figures S1 and S2). These communities are located in
areas where prevalence of antigenemia is ≥1%), and with        the forest area of Cameroon which are breeding sites of
a minimum therapeutic coverage of 65% for 5–6 years            different filarial transmitting vectors and MDA has not
[6]. The global strategy is a yearly single dose of two-       been introduced in these communities. The survey was
drugs regiment, distributed to at-risk populations In Af-      conducted from July 2016 to January 2017.
rica, WHO recommends an annual dose of ivermectin
(150 μg/kg body weight) combined with albendazole              Study design
(400 mg) due to the co-endemicity of LF and onchocer-          This study was a cross-sectional community-based survey.
ciasis in this continent [7].                                  Following mass sensitization on the importance of the
   LF was previously mapped in Cameroon using two              study, a complete census of all households was carried out
strategies in two different zones. In the northern zone        in each community and 50 households selected using sim-
(two regions), which were not endemic for loiasis, W.          ple random sampling. A minimum of 2 participants were
bancrofti microfilaremia was confirmed microscopically         randomly selected from each of the selected households.
using night blood smears [2]. In the southern part (8 re-         In each community, at least 125 participants both male
gions) endemic for loiasis, LF was mapped based on the         and female of greater than 5 years, who had been resident
positivity of the immunochromatographic test (ICT) [8].        in the community for at least 5 years, were recruited and
A total of 158 health districts in Cameroon were previ-        screened during the day for the presence of W. bancrofti
ously identified as endemic for LF. About 134 HDs were         using the Alere Filarial Test strip (FTS, Alere, Scarbor-
eligible for LF MDA following completion of epidemio-          ough, ME, USA). All eligible participants in the commu-
logical mapping and based on historical data [2, 8]. The       nity who willingly consented or accented (if below 21
other 24 health districts not eligible for MDA were later      years) were recruited for the study. Sociodemographic fac-
on carved out into 31 health districts by the health au-       tors were collected using a structured questionnaire. We
thorities and they were highly endemic for loiasis.            used the algorithm shown in Fig. 2 to detect the presence
   The implementation of MDA against LF in Cameroon            of W. bancrofti. Blood samples for FTS testing, thick blood
started in 2008 in the North and Far North regions [9].        film (TBF) and dry blood spot (DBS) for real time poly-
However, the implementation of MDA in the southern             merase chain reaction (qPCR) were also obtained. Night
parts of Cameroon is facing serious drawbacks due to           blood samples (10:00 pm to 12.30 am) was collected from
the co-endemicity of Loa loa and the risk of severe ad-        FTS positive individuals for microscopy to detect W. ban-
verse events (SAE) in individuals with high microfilaria       crofti microfilariae, and for qPCR.
(Mf) loads, if treated with ivermectin [10, 11]. In the
past, epidemiological mapping used ICT cards to assess         Circulating filarial antigen test with FTS
the prevalence of LF but recent findings in Democratic         Antigen testing was performed with FTS according to the
Republic of the Congo (DRC) and Cameroon reported              manufacturer’s instructions. In brief, 75 μL of finger prick
cross reactivity of this tool with high L loa Mf load in       blood collected from eligible participants using non-
blood [12–14]. Another study demonstrated the loss of          heparinized microcapillary tubes (soda lime glass,
Beng et al. BMC Infectious Diseases (2020) 20:284 Page 3 of 11
bancrofti (night blood of FTS positive individuals, be-
tween 10:00 pm to 12.30 am) or mf of L. loa (day blood,
8 am to 4 pm). In brief, the collected 50 μL of blood was
placed on the centre of a clean slide, and spread repeat-
edly in a circular area of about 1.5 cm using the microca-
pillary tube. They were air dried and packaged for
staining at the base. All blood smears were stained with
10% Giemsa within 24 h. The stained smears were exam-
ined using a light microscope at 10X objective lens (or
using 40X objectives lens), for blood dwelling mf. Any
mf present were identified based on the the size and
presence or absence of a sheath, quantified and
recorded.
Whatman dry blood spot (DBS)
For each participant, 6 spots of 50 μL of blood were
loaded onto Whatman filter paper (GE Healthcare UK
Ltd., Little Chalfont, United Kingdom.) to prepare dry
blood spots (DBS) for analysis by qPCR. After drying,
DBS were kept separately in individual plastic bags at
ambient temperatures and was later stored at − 80 °C
until processed. Given the diurnal periodicity of L. loa
mf, sampling was performed between 10:00 AM and 4:
00 PM. DBS were also collected for all individuals who
were FTS positive during night blood sample collection
as described above.
Detection of filarial DNA in DBS by qPCR
DNA was extracted from the DBS, using the QIAGEN
DNeasy kit (QIAGEN, Valencia, CA) following the man-
ufacturer’s instructions. Briefly, one DBS of a participant
was cut out and placed in a 2 ml microtube, covered
with 270 μL of ATL buffer, incubated at 85 °C for 10 mi-
nutes, then at 56 °C for 1 hour after addition of 30 μL of
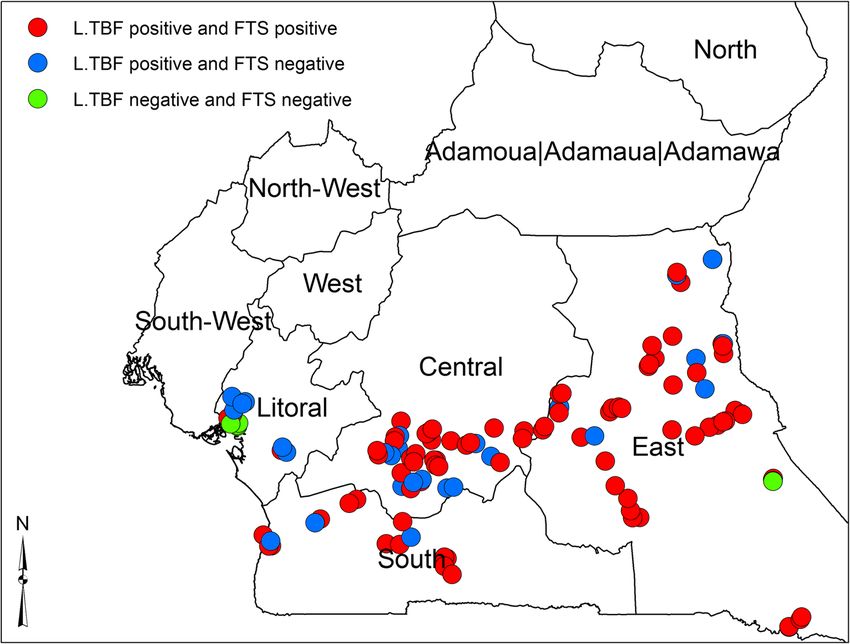
Fig. 1 Map of the study area proteinase K. Addition of 300 μL of Al buffer to the
digested suspension brought up the lysate volume to a
total of 600 μL. From this step, the lysates were heat-
Modulohm A/S Herlev, Denmark) was tested using FTS treated (100 °C), prior to the DNA purification, to de-
and the test was allowed to run for 10 min before being nature the genomic DNA to make the DNA target se-
read. The result was recorded on the data record sheet. In- quence more accessible to the primers. A volume of
dividuals who tested either negative or positive on the FTS ethanol equivalent to half the volume of lysate sample
were informed of the result and those who were positive was added before loading the mixture onto a DNeasy
asked to return at night between 10:00 PM – 12:30 AM to spin column. Depending on the volume loaded, add-
have additional blood taken for microscopic evaluation of itional centrifugations were performed to pass all the so-
W. bancrofti mf. It was necessary to have the blood taken at lution through the column. After washing, (twice with
night due to the nocturnal periodicity of W. bancrofti mf in AW1 buffer, once with AW2 buffer), purified DNA was
the blood. Quality controls for the FTS strip were con- eluted in 200 μL of AE buffer. The qPCR assays for W.
ducted daily before the exercise, using positive and negative bancrofti were performed using 2 μL of DNA and the W.
controls from the manufacturer, to ascertain standards and bancrofti-specific long DNA repeat (LDR) primers as de-
kits performance throughout the study. scribed by Rao et al. in 2006 [18]. For the detection of
W. bancrofti the “long DNA repeat” (LDR) was used as a
TBF for microscopy target. The nucleotide sequences for the forward and re-
Standardized 50 μL of blood was collected with a non- verse primers were LDR 1, 5′ ATTTTGATCATCTGGG
heparinized microcapillary tube to identify mf of W. AAGGTTAATA 3′ and LDR 2, CGACTGTCTAATCC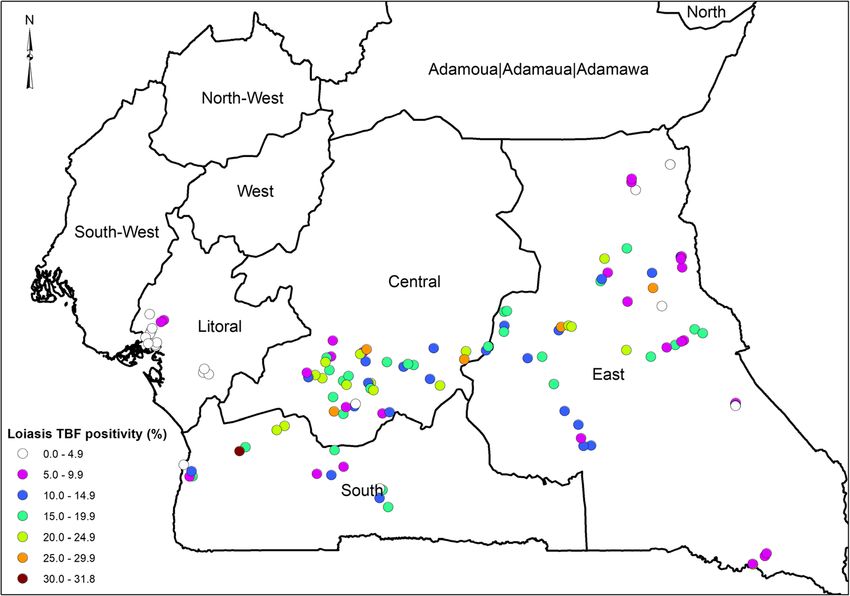
Beng et al. BMC Infectious Diseases    (2020) 20:284                                                            Page 4 of 11

 Fig. 2 The algorithm of the study design

ATTCAGAGTGA3 and the sequence for the probe was                 5’CGGAAGACTCAACGTCAGAAATCA3’                           and
/56FAM/ATCTGCCCA/ZEN/TAGAAATAAC-                                5’AGGAACGCTGATGGTGATGT3 and for the probe
TACGGTGGAT CTCTG/3IABkFQ. All assays were                       was /56FAM/CCAACAGCC/Zen/TGCTTT/31ABkFQ.
performed in duplicate using kappa probes master mix            qPCR were performed to identify DNA from L.loa mf as
kit (Kappa Biosystems, Wilmington, MA) with 20 pmol             described by Fink et al. [19]. These entire tests were per-
of each primer (LDR1 and LDR2) and 6 pmol of LDR                formed with 1 μL of extracted DNA (representing
probe per well in the final volume of 20 μL and the fast        0.1427 μL of whole blood).
PCR programmed automatically (95 °C temperature 40
cycles for 20 s, 60 °C for 1 s and 72 °C for 20 s) in a Step-   Data management
One-Plus PCR system (Applied Biosystems, Foster City).          Data generated either in the field or laboratory were col-
The primers for L. loa PCR were LLMF72,                         lected using smart phones and uploaded to a center
Beng et al. BMC Infectious Diseases   (2020) 20:284                                                              Page 5 of 11

server coded with a password at the end of each day, to          2015/09/640/CE/CNERSH/SP of 16th September 2015.
prevent accidents or the phones getting bad. The data            The Administrative approval number D112-244NS/
were compiled and managed using Epi Info version 7.2             MINSANTE/SG/DLMEP/SDL/PMDTN/PNLO of 11th
(Center for Disease Control and Prevention, Atlanta,             august 2016, was granted by the Ministry of Public
GA) and Microsoft Excel 2013. It was checked for miss-           Health of Cameroon. The investigators ensured that this
ing values and redundancy. All missing values were reg-          study was carried out according to the current revision
istered as missing.                                              of the Helsinki Declaration and Good Clinical Practices
   After cleaning, the data was re- uploaded to the main         regulations and guidelines from the International Con-
server and hard copies in DVDs were also made. All               ference of Harmonization (ICH-GCP). Moreover, the in-
hardware and software carrying the research data can             vestigators ensured that all protocol activities were
only be accessed by the research team. Security pass-            guided by the ethical principles of the Belmont Report,
word and server cupboard had been set up to protect              45 CFR 46, and all its subsections (A, B, C and D). All
the data at the University of Buea/REFOTDE, Buea,                ethical issues like; handling of withdrawals, benefits and
Cameroon.                                                        risks, community participant risk with finger prick, bio-
                                                                 hazard risk to field technicians, risk associated partici-
Data analysis                                                    pant confidentiality and test results, reporting adverse
Data were analyzed using the IBM SPSS Statistics (version        events and unanticipated problems, confidentiality, etc.,
20.0, IBM, Armonk, NY, US). Some descriptive graphs              as stipulated in the study protocol were strictly observed.
were drawn with MS Excel 2010 and Thematic analysis              The purpose of the study was explained to the commu-
were performed using the ArcGIS software (version 10.2,          nity leaders and the study participants in their local lan-
ESRI Inc. Redlands, CA, US), to draw the LF map in the           guages at the time of recruitment. Individual informed
31 health districts and other maps in the analysis (Using        written consent was obtained from each participant. If a
GPS coordinates from each study community). The differ-          participant was less than 21 years old (the age of major-
ences across age and gender were tested using fishers sta-       ity in Cameroon), written assent and permission were
tistics and the 95% confidence interval (CI) computed.           obtained from the study participant and a legal guardian
Chi-square, Mann-Whitney and Kruskal-Wallis tests were           respectively. The data was analyzed and reported to ex-
also used to compare LF and L. Loa prevalence level, the         clude any directly identifiable information in order to
Geometric mean index of infection between regions and            maintain the anonymity of the participants.
HDs, sex and age groups respectively. To assess the rela-
tionship between FTS positivity and L. loa Mf loads, the         Clinical examination
geometric mean intensity (GMI) of Mf counts was calcu-           Trained medical personnel recruited for this study, ex-
lated as follows: GMI = (∑log(x + 1)/n),Where X = the            amined all the participants for lymphedema. All males
number of Mf per ml of blood in Mf positive individuals,         were examined for signs of the limb lymphedema and
n = the number of mf positive individuals. Spearman rho          hydrocele and female for limb lymphedema. The lymph-
correlation analysis was carried out between FTS positivity      edema cases also underwent night blood collection for
rate and TBF data (L.loa Mf load) at the regional level to       circulatory filarial antigen test and thick blood film
find out if there was any relationship. Odds ratios were         microscopy.
calculated to quantify the risk of an individual harboring
L. loa Mf and testing positive to FTS compared to the risk       Results
for an amicrofilaraemic individual. The value was used to        Study population characteristics
quantify the risk or the relation established by the correl-     In all, 14,446 participants took part in this survey and
ation statistics. Logistic regression analysis was used to de-   underwent the FTS test. Of these, 49.99% (7221/14446)
termine the predictors of FTS positivity. Gender, sex and        were males with a mean age of 31.8 ± 19.8 years and
quantity of L. loa Mf load were cross tabulated with FTS         50.01% (7225/14,446) were females, with a mean age of
positivity.                                                      32.1 ± 20.1 years. 4151 (28.7%) persons tested were less
   The base map of the global administrative areas was           than or equal to 15 years and 10,295 (71.3%) persons
downloaded from the Natural Earth (https://www.natur-            tested were > 15 years (Supplementary material Table S1,
alearthdata.com/) [20]. All maps were produced using             Supplementary material Fig. S3).
ArcGIS Desktop v10.5 (Environmental Systems Research
Institute Inc., Redlands CA, USA).                               Prevalence of positive FTS
                                                                 Out of a total of 14,446 individuals screened, 233 tested
Ethical consideration                                            positive with the FTS (Table 1). The overall prevalence
Ethical approval for this work was obtained from the             of positive FTS was 1.6% (233/14446), ranging from
Cameroon National ethics committee (CNEC) number                 0.0% in Abo and Bonassama HDs (Littoral Region) to
Beng et al. BMC Infectious Diseases (2020) 20:284 Page 6 of 11
Table 1 Prevalence and intensity (GMI mf/ml) of Loa loa microfilarial for FTS positive individuals during day and night
REGION Screened FTS DAY NIGHT
(N) Prev.
FTS + ve Participants L.loa Loiasis Prev GMI (mf/ FTS + ve Participants L. loa +ve Loiasis Prev GMI (mf/
(%)
(N) +ve (%) ml) (N) (N) (%) ml)
(N)
EAST 6444 1.4 87 61 (70.1%) 621.3 68 44 (64.70%) 61
CENTER 4475 2.4 109 65 (59.60%) 210 97 50 (51.50%) 18.9
LITTORAL 1789 0.3 5 1 (20.0%) 5.9 2 0 (0.0%) 0
SOUTH 1738 1.8 32 20 (62.5%) 344.3 21 15 (71.4%) 44.6
TOTAL 14,446 1.6 233 147 63.1% 311 188 109 58% 30.9
* + ve indicates positive, GMI geometric mean intensity, Prev prevalence, N number
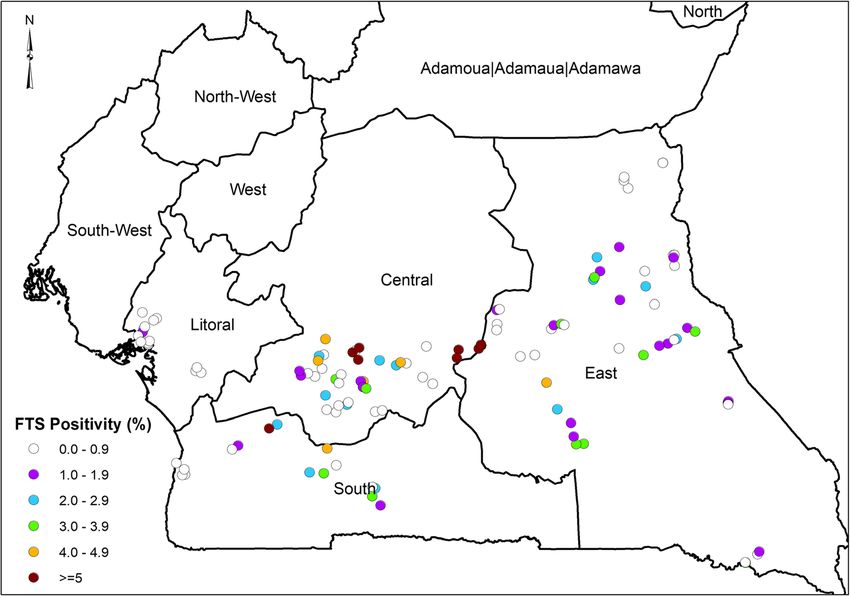
8.2% in Ayos HD (Center Region) (Fig. 3 and Supple- In the South Region, a total of 1738 took part in the
mentary material Table S1). Among the 31 HDs sur- study recording a prevalence of 1.80% (32/1738). FTS
veyed, 18 HDs had a prevalence of FTS positive rates positivity ranged from 0.60% (3/470) in Kribi to 2.7% (7/
equaled to or greater than 1% (Supplementary material 264) in Lolodorf. Males were more positive to FTS than
Table S3). The males had a significantly higher FTS females with 2.50% (23/913) and 1.10% (9/825) respect-
positivity rate of 2.0% (141/7221) compared to the fe- ively (p < 0.031). Children were significantly less positive
males 1.3% (92/7225) (Fischer’s statistics, p < 0.05). The 0.20% (1/455) compared to adults 2.40% (31/1283) (p <
FTS positivity between the age groups was also statisti- 0.001) (Supplementary material Table S3).
cally significant, higher in adults (15 years and above)
with 2.1% (218/10295) compared to 0.4% (15/4151) in Prevalence of lymphedema
children (< 15 years) (Supplementary material Table S2). A total of one hundred and sixty three (163) lymph-
In the Center Region, out of the 4475 participants that edema cases were diagnosed in the entire study popula-
took part in the study, 2.4% (109/4475) were FTS posi- tion, giving a prevalence rate of 1.14% (Supplementary
tive (Fig. 3, Supplementary material Table S7). The material Table S1 and Figure S4). None of them tested
prevalence in this region ranged from 0.5% (2/422) in positive with FTS for W. bancrofti antigen. Mbang
Ngog Mapubi HD to 8.2% (37/452) in Ayos HD. The health district in the East region had the highest number
prevalence was higher in males 2.9% (62/2158), than in of lymphedema cases 36/503 (7.2%) followed by Ayos in
females 2.0% (47/2317), but the difference was not sig- the Center region 20/452 (4.4%). Both males 1,1% (82/
nificant (p < 0.066). There was a significantly more posi- 7221) and females 1.1% (81/7225) were affected almost
tive FTS strips in adults 3.0% (101/3312) compared to equally with lymphedema.
children 0.7% (8/1163) (p < 0.001). (Supplementary ma-
terial Table S3). L. loa mf load in day thick blood films (TBF)
In the East region, a total of 6444 participants took part L loa mf prevalence for the 31 health districts is shown
in the study with an overall prevalence of 1.4% (87/6444). on Supplementary material Tables 1 & 8. The overall
The prevalence ranged from 0.2% (1/534) in Garoua Bou- prevalence of L loa mf from diurnal blood was 12.5%
laye to 2.5% (12/481) in Lomie (Supplementary material (1805/14442). The prevalence ranged from 2.7% (50/
Table S3). The 1.8% (12/481) prevalence among adults was 1789) in the Littoral to 16.6% (745/4475) in the Center
significantly higher when compared to 0.3% (6/2005) in region (Supplementary material Table S8). A high mf
Children (p < 0.001). The distribution in females was lower prevalence was also recorded in the East region 12.3%
than that of males, 1.1% (34/3147) and 1.6% (53/3297) re- (793/6442). The prevalence among the males of 14.8%
spectively (p < 0.067) but not statistically significant. (1071/7221) was significantly higher than that in females
A total of 1789 participated in the Littoral, with a of 10.2% (734/7225) (p < 0.001) (Supplementary material
general prevalence of 0.30% (5/1789), the FTS positiv- Table S2). Between the two age groups, adults with
ity ranged from 0.00% in Abo and Bonassama to 0.8% 15.8% (1624/10295) were significantly more infected
(3/397) in Dibombari. Here adults (> 15 years) were than children with 4.4% (181/4151) (p < 0.001). The the-
more FTS positive than children (< 15 years), with matic map showing L loa mf distribution across the 31
0.40% (5/1261) and 0.00% (0/528) respectively but the health districts is shown on Fig. 4.
difference was not significant (p < 0.334). Though not
significant, males were more positive 0.40% (3/853) Microfilaremia in FTS-positive individuals
than females 0.20% (2/936) (p < 0.674) (Supplementary We had 233 participants that were FTS positive. Micro-
material Table S3). scopic results were available for all 233 for day time TBFBeng et al. BMC Infectious Diseases (2020) 20:284 Page 7 of 11 Fig. 3 FTS Positivity across the different communities and just 188 for night time TBF (Table 1). No W. ban- Correlation between positivity of FTS and prevalence of L. crofti mf was found on any of these slides (day or night loa TBF). But, L. loa mf were present in 147/233 (63.1%) There was a positive correlation between the propor- day blood TBF and in 109/188 (58%) night blood TBF tion of positive FTS and the prevalence of L. loa mf (Supplementary material Table S9). The total mean mf (Supplementary material Figure S5 and S7). In FTS load of L. loa (mf/ml) was 11,343 during the day and positive individuals across the four regions, FTS posi- 2402 at night. The average L. loa mf GMI was 311 mf/ tivity was significantly related to L loa mf load (p < ml during the day and 30.9 mf/ml during the night. 0.001) (Supplementary material Table S6), as the Fig. 4 Distribution of positivity of Loa loa Mf load from TBF
Beng et al. BMC Infectious Diseases    (2020) 20:284                                                                   Page 8 of 11

amount of L loa mf load increased, the probability of                    Molecular analysis by qPCR
being FTS positive also increased, indicating that har-                  The detection of W. bancrofti DNA by qPCR was done
boring L loa in the blood was a good predictor for                       for 182 of the 229 night blood DBS collected from the
having a positive FTS results.                                           FTS positive individuals. All tested negative for LDR
   The odd ratios of a person in any of the four regions                 DNA sequence, specific to W. bancrofti. However, 104
with high L loa mf load of 8001–20,000 mf/ml being de-                   of the 182 samples (57.1%) were positive for L. loa spe-
tected CFA positive by FTS was 53.2 times (OR = 53.2;                    cific LLMF72 DNA sequence (Table 2 and Supplemen-
95% CI: 35.2–80.4; p < 0.001), compared to an individual                 tary material Table S11).
in these regions with lower L loa mf load of 1–8000 mf/                    There was no significant difference between the qPCR
ml whose odds ratio to be detected CFA positive by FTS                   results and those obtained from microscopy (Wilcoxon
is just 6.1 (OR = 6.1; 95% CI: 4.4–8.6; p < 0.001). The OR               p value p < 0.999). The qPCR and microscopy results
becomes extremely high when mf load was > 30,000 mf/                     were plotted to depict how these tests performed in each
ml (OR = 151.9; 95% CI: 85.4–270.2; p < 0.001) (Supple-                  HD with Supplementary material Figure S8.
mentary material Table S4).
   The logistic model also showed that gender is not                     Discussion
associated with FTS positivity and L. loa prevalence                     The FTS is the current generation filarial antigen test
(p < 0.076) but there was a contrast across age groups,                  that was developed to improve on the ICT Card test for
adults had a significant risk of being FTS positive                      mapping of LF. Laboratory and field evaluation of the
with high L. loa loads within these four regions with                    FTS carried out in areas with high residual LF endem-
an OR of 3.395 times more than children (OR =                            icity after multiple MDA rounds, showed that FTS had
3.395; 95% CI: 1.942–5.935; p < 0.0001) (Supplemen-                      significant technical and practical advantages over the
tary material Table S10).                                                ICT [21].
   In Supplementary material Figure S6 a plot of                            The prevalence of FTS positivity in the study area was
positive FTS and L loa, showed that every increase                       1.6%. This value is lower compared to 2.9 and 3.3%, ob-
in L loa Mf prevalence is followed by an increased                       tained in other surveys in Cameroon using the ICT in
in FTS positivity. The concordance between FTS                           the mapping of W. bancrofti [11, 13]. However, FTS
positivity and that of Thick blood film (TBF) preva-                     positivity was much higher than the prevalence obtained
lence of L. loa in the surveyed Communities is in                        by other previous works 1.1 and 0.4% [14, 22, 23]. There
shown in Fig. 5.                                                         is concordance between FTS positivity and L. loa density

 Fig. 5 Concordance between the positivity Of FTS and positivity of TBF Loa loa in the surveyed Communities
Beng et al. BMC Infectious Diseases   (2020) 20:284                                                                 Page 9 of 11

Table 2 Comparing Molecular (qPCR) with Thick blood film (TBF) microscopy of FTS positive individuals
Region              FTS + ve            qPCR                                            TBF (Microscopy)
                    participants
                                        W. bancrofti N(%)      Loa loa + ve N(%)        W. bancrofti N(%)      Loa loa + ve N(%)
                    (*N)
EAST                64                  0                      44 (68)                  0                      43 (67.2)
CENTER              92                  0                      48 (52.2)                0                      46 (50)
SOUTH               23                  0                      12 (52.2)                0                      14 (60.9)
LITTORAL            3                   0                      0 (0)                    0                      0
TOTAL               182                 0                      104 (57.1)               0                      103 (56.6)
Mc Nemar test: p- value = 0.999
*N number

and prevalence, which may indicates that FTS positivity               Discrepancies were noticed between FTS results with
is a result of L. loa endemicity in the study area. This           those obtained from microscopy and qPCR respectively.
may also reflect the geographical variations in the distri-        However, previous works [15] reported high L loa mf to
bution of L. loa.                                                  be associated with false positivity of the ICT test. Due to
   The FTS positivity in males 2.0% (141/7221) was                 suspicion that FTS positivity could be caused by a pos-
higher than that for females 1.3% (92/7225) (p < 0.05),            sible cross-reaction between L. loa and W. bancrofti in-
and this trend was previously observed in similar studies          fection, two methods (Microscopy and qPCR),
in Sri Lanka and Indonesia [21]. The results also showed           confirmed the absence of W. bancrofti and demonstrated
that age was significantly associated with FTS positivity          the presence of L. loa. As a consequence, there was need
as adults turned to be more positive than children, but            to assess the intensity of L loa in FTS positive
there was no significant association between gender and            individuals.
FTS positivity (p < 0.075). The difference in FTS positiv-            The overall L. loa Mf prevalence was 12.5% and the
ity within age groups, 2.1% (218/10295) above 15 years             prevalence in males was higher than in females which
(adults) compared to 0.4% (15/4151) less than 15 years,            are in agreement with previous works [13] but lower
showed that circulating filarial antigens (CFA) was in-            than recent reports [17]. This variation can be explained
creasing with age.                                                 by the difference in study design and also the difference
   FTS positivity status at the district level showed              in geographical distribution of the disease. The preva-
that all but 2 of the 31 HDs had FTS non-reactive                  lence in adults (> 15 years), was higher than that in chil-
results, and 18 HDs had FTS positivity proportions                 dren (< 15 years) which is in agreement with studies by
≥1%. Similar to other results observed with the ICT                Thompson et al. [24]. This can be explained by the type
[13]. It was also observed that the level of mf/ml in              of activities people in the different age groups carry out
blood for L loa also increased with an increase in                 that exposes them to the vectors of the parasite, like
age which further indicates an association between                 farming and hunting.
FTS positivity and L loa mf load. The results re-                     The FTS identified 1.6% (233/14446) persons as posi-
vealed that the prevalence of positive FTS falls                   tive, implying that these individuals had CFA for W.
within other reported ranges using ICT. The main                   bancrofti, however, further investigation of these FTS
predictor of this positivity, included high L.loa mf               positive individuals by microscopy, using their night
load in blood and to a lesser extend the age group,                blood TBF, revealed that they had no mf of W. bancrofti,
which was higher in adults > 15 years. Gender was                  but those of L. loa, which is known to be endemic in the
not associated with FTS positivity but there was a                 rain forest of Africa. This finding suggested a relation-
strong association with high L. loa mf load > 8000                 ship between FTS positivity and L. loa, rather than LF
mf/ml of blood with high odds ratio of being FTS                   infection in these districts. Results of the molecular ana-
positives [11, 13]. Analysis with microscopy using                 lysis by qPCR confirmed the presence of L. loa and the
night blood TBF and qPCR, indicated zero presence                  absence of W. bancofti.
of W. bancrofti but a high L loa density. The ab-                     Logistic regression analyses indicated an association
sence of W. bancrofti in night blood smears and                    between FTS positivity and L. Loa mf loads. There was a
qPCR, confirm previous findings [15, 17], that high                linear relationship between FTS positivity and L loa mf
L loa mf was probably the cause of FTS positivity,                 load in agreement with previous reports and later dem-
as earlier observed with ICT due to cross-reaction,                onstrated with the ICT [13, 17, 23]. FTS uses the same
since FTS was developed with the same reagents as                  principal reagents as the ICT to detect W. bancrofti CFA
ICT [16].                                                          and hence have the same specificity [16]. A possible
Beng et al. BMC Infectious Diseases (2020) 20:284 Page 10 of 11
explanation could be that the CFA detected by the FTS Abbreviations
may be produced by L. loa and other pathogenic filariae CFA: Circulating filarial antigen; DBS: Dry blood spot; FTS: Filariasis test strip;
GMI: Geometric mean intensity; HDs: Health districts;
parasites like Onchocerca volvulus, M. perstans [25], B. ICT: Immunochromatographic test; LF: Lymphatic filariasis; MDA: Mass drug
malayi. Also, the ICT components are similar with those administration; Mf: Microfilaria; PC: Preventive chemotherapy; qPCR: Real time
of FTS and include monoclonal antibodies (AD12), ori- polymerase chain reaction; SAE: Severe adverse events; TBF: Thick blood film
ginally produced by immunizing mice with antigens
from the dog heartworm Dirofilaria immitis. The ability Acknowledgements
of this antigen to bind to other filaria species have been We like to thank all study participants in the 124 communities for providing
samples for this mapping project. We are also grateful to the Ministry of
reported [7, 26]. Again, all levels of L loa are capable of Public Health of Cameroon for the support and assistance during this study.
inducing ICT positivity [13].
Comparative analyses between the different levels of
Authors’ contributions
endemicity with L. loa mf load, showed a higher risk of SW had taken a principal role in the conception of ideas. AAB, MEE, AJN,
being detected FTS positive in individuals with very high PWCN, RAA, JF, FFF, GTN, GA, NTVG, PIE and SW contributed in writing the
protocol, developing methodologies, data collection and supervision. AAB,
loads of L loa mf. The Odds ratio in individuals with
KD and SW contributed to analyses. AAB, KD, BB, GN, PM, JA, PIE, SDR, JJT
8001–20,000 mf/ml of blood was 53.2 but as the mf load and YZ contributed in write up of the article. All authors read and approved
increased the odds ratio tripled in individuals with mf the final manuscript.
load greater than 30,000, to 151.9. This trend had earlier
been reported [14, 27], which could serve as proof of as- Funding
sociation between FTS positivity and L. loa mf load. The study was funded by the United States Agency for International
Development (USAID) ENVISION Project through Helen Keller International.
ENVISION is a global project led by RTI International in partnership with CBM
Conclusion International, The Carter Center, Helen Keller International, IMA World Health,
Our findings showed that the FTS test cross reacted Light for the World, Sightsavers, and World Vision. ENVISION is funded by
USAID under cooperative agreement number AID-OAA-A− 11-00048. The
with L. loa and its positivity was not associated to the period of performance for ENVISION is September 30, 2011 through Septem-
presence of W. bancrofti in this area of Cameroon. A ber 30, 2019. KD is supported by a grant from the Wellcome Trust [grant
strong relationship was established between FTS positiv- number 201900/Z/16/Z] as part of his International Intermediate Fellowship.
The funders had no role in study design, data collection and analysis, deci-
ity and L. loa TBF positivity. It could be concluded that sion to publish, or preparation of the manuscript. The author’s views
W. bancrofti is absent from the 31 health districts situ- expressed in this publication do not necessarily reflect the views of USAID,
ated in areas endemic for L. loa in the forest zones of the United States Government, or the institutions with which they are
affiliated.
Cameroon and LF MDA is therefore not necessary in
these districts.
Availability of data and materials
All data used for this manuscript are either available in this published article
and its supplementary information files.
Supplementary information
Supplementary information accompanies this paper at https://doi.org/10.
1186/s12879-020-05009-3. Ethics approval and consent to participate
Ethical approval for this work was obtained from the Cameroon National
Additional file 1: Figure S1. Selection of the study sites. Figure S2. ethics committee (CNEC) number 2015/09/640/CE/CNERSH/SP of 16th
Map of the study area. Figure S3. Distribution of participants according September 2015. The Administrative approval number D112-244NS/MIN-
to age and gender. Figure S4. Overall prevalence of lymphedema in the SANTE/SG/DLMEP/SDL/PMDTN/PNLO of 11th August 2016, was granted by
study area. Figure S5. Relationship between the proportion of positive the Ministry of Public Health of Cameroon. Individual informed written con-
FTS and the prevalence of Loa loa microfilaremia in 31 HDs of Cameroon. sent was obtained from each participant.
Figure S6. FTS positivity and Loa loa prevalence. Table S1. Infection
profile for FTS, lymphedema and loa loa mf, in the 31 health districts.
Table S2. Gender and age related prevalence of FTS, lymphedema and Consent for publication
diurnal microfilaramia. Table S3. Distribution of FTS positivity across Not applicable.
health districts, gender and age groups. Table S4. Logistic regression
analysis of FTS results according to L loa load among MF carriers. Table
S5. Comparison of day and night parasitological indices in lymphedema Competing interests
cases. Table S6. The relationship between FTS positivity and Loa loa The authors declare that they have no competing interests.
infection intensity. Figure S7. Plot of log GMI (Mf/ml) of loasis night
against day. Figure S8. Relationship between the proportion of positive Author details
1
FTS and the GMI of L loa mf densities (mf/ml) in 31 HDs of Cameroon. Department of Microbiology and Parasitology, Parasites and Vector Biology
Figure S9. Prevalence of Loa loa microscopy at night and qPCR. Table Research Unit (PAVBRU), University of Buea, Buea, Cameroon. 2Research
S7. FTS positivity (%) in the 31 Health Districts. Table S8. Prevalence of Foundation in Tropical Diseases and the Environment (REFOTDE), Buea,
Loa loa among age groups and across gender. Table S9. prevalence of Cameroon. 3Centre for Global Health Research, Brighton and Sussex Medical
Loa loa microfilaria loads (GMI mf/ml) for FTS positive individuals during School, Brighton BN1 9PS, UK. 4School of Public Health, College of Health
the day and at Night. Table S10. Logistic regression analysis of FTS Sciences, Addis Ababa University, P.O. Box 9086, Addis Ababa, Ethiopia.
5
results according L loa load among MF carriers. Table S11. Comparing Ministry of Public Health, Yaoundé, Cameroon. 6Helen Keller International,
molecular (qPCR) with parasitological (Microscopy) of FTS positive Yaoundé, Cameroon. 7Helen Keller International, New York, NY, USA. 8RTI
individuals in the 31 health districts. International, Washington, DC, USA. 9Helen Keller International, Regional
Office for Africa, Dakar, Senegal.Beng et al. BMC Infectious Diseases (2020) 20:284 Page 11 of 11
Received: 26 January 2020 Accepted: 1 April 2020 19. Fink DL, Kamgno J, Nutman TB. Rapid molecular assays for specific
detection and quantitation of Loa loa microfilaremia. PLoS Negl Trop Dis.
2011;5(8):e1299.
20. Natural Earth: Natural Earth. Available at https://www.naturalearthdata.com/.
References Accessed 02 Novemebr ,2019..
1. Bakajika DK, Nigo MM, Lotsima JP, Masikini GA, Fischer K, Lloyd MM, Weil GJ, 21. Yahathugoda TC, Supali T, Rao RU, Djuardi Y, Stefani D, Pical F, Fischer PU,
Fischer PU. Filarial antigenemia and Loa loa night blood microfilaremia in Lloyd MM, Premaratne PH, Weerasooriya MV, et al. A comparison of two
an area without bancroftian filariasis in the Democratic Republic of Congo. tests for filarial antigenemia in areas in Sri Lanka and Indonesia with low-
Am J Trop Med Hyg. 2014;91(6):1142–8. level persistence of lymphatic filariasis following mass drug administration.
2. Boussinesq M. La filariose lymphatique au Cameroun: état des Parasit Vectors. 2015;8:369.
connaissances. , . In., vol. 32. Bulletin de Liaison et de Documentation- 22. More SJ, Copeman DB. A highly specific and sensitive monoclonal
OCEAC; 1999: 7–12. antibody-based ELISA for the detection of circulating antigen in bancroftian
3. Boussinesq M, Kamgno J, S. P. Treatment of Loa patients: pre- and post- filariasis. Trop Med Parasitol. 1990;41(4):403–6.
treatment loamicrofilarial levels and SAEs—experience in Cameroon. In., vol. 23. Pion SD, Montavon C, Chesnais CJ, Kamgno J, Wanji. S ea. Correlation
63rd annual meeting. Sheraton New Orleans Hotel, New Orleans, LA USA: between high Loa loa microfilaremia and levels of circulating filarial
ASTMH; 2014. antigens used to detect Wuchereriabancrofti infection. In: 63rd Annual
4. WHO: Lymphatic filariasis. World Health Organization Fact Sheet 102. 2014. Meeting, TropMed14. Sheraton New Hotel NewOrleans LAUSA: ASTMH; 2014:
5. WHO: Lymphatic filariasis. World Health Organization Fact Sheet of 2nd pp. 377.
March 2020. In.; 2020. 24. Thomson MC, Obsomer V, Kamgno J, Gardon J, Wanji S, Takougang I,
6. Michael E, Malecela-Lazaro MN, Kabali C, Snow LC, Kazura JW. Mathematical Enyong P, Remme JH, Molyneux DH, Boussinesq M. Mapping the
models and lymphatic filariasis control: endpoints and optimal distribution of Loa loa in Cameroon in support of the African Programme
interventions. Trends Parasitol. 2006;22(5):226–33. for Onchocerciasis control. Filaria J. 2004;3(1):7.
7. WHO: World Health Organization: Global programme to eliminate lymphatic 25. Deribe K, Beng AA, Cano J, Njouendo AJ, Fru-Cho J, Awah AR, Eyong ME,
filariasis: progress report, 2011. In., vol. 87. Weekly Epidemiol Rec, ; 2012: Chounna Ndongmo PW, Giorgi E, Pigott DM, et al. Mapping the
346–356. geographical distribution of podoconiosis in Cameroon using
parasitological, serological, and clinical evidence to exclude other causes of
8. Nana-Djeunga HC, Tchatchueng-Mbougua JB, Bopda J, Mbickmen-Tchana S,
lymphedema. PLoS Negl Trop Dis. 2018;12(1):e0006126.
Elong-Kana N, Nnomzo'o E, Akame J, Tarini A, Zhang Y, Njiokou F, et al.
Mapping of Bancroftian Filariasis in Cameroon: prospects for elimination. 26. Weil GJ, Ramzy RM. Diagnostic tools for filariasis elimination programs.
PLoS Negl Trop Dis. 2015;9(9):e0004001. Trends Parasitol. 2007;23(2):78–82.
27. Ottesen EA, Duke BO, Karam M, Behbehani K. Strategies and tools for the
9. Nana-Djeunga HC, Tchouakui M, Njitchouang GR, Tchatchueng-Mbougua
control/elimination of lymphatic filariasis. Bull World Health Organ. 1997;
JB, Nwane P, Domche A, Bopda J, Mbickmen-Tchana S, Akame J, Tarini A,
75(6):491–503.
et al. First evidence of lymphatic filariasis transmission interruption in
Cameroon: Progress towards elimination. PLoS Negl Trop Dis. 2017;11(6):
e0005633. Publisher’s Note
10. Esum M, Wanji S, Tendongfor N, Enyong P. Co-endemicity of loiasis and Springer Nature remains neutral with regard to jurisdictional claims in
onchocerciasis in the South West Province of Cameroon: implications published maps and institutional affiliations.
for mass treatment with ivermectin. Trans R Soc Trop Med Hyg. 2001;
95(6):673–6.
11. Molyneux DH, Hopkins A, Bradley MH, Kelly-Hope LA. Multidimensional
complexities of filariasis control in an era of large-scale mass drug
administration programmes: a can of worms. Parasit Vectors. 2014;7:363.
12. Kelly-Hope LA, Hemingway J, Taylor MJ, Molyneux DH. Increasing evidence
of low lymphatic filariasis prevalence in high risk Loa loa areas in central
and West Africa: a literature review. Parasit Vectors. 2018;11(1):349.
13. Wanji S, Kengne-Ouafo JA, Esum ME, Chounna PW, Tendongfor N, Adzemye
BF, Eyong JE, Jato I, Datchoua-Poutcheu FR, Kah E, et al. Situation analysis of
parasitological and entomological indices of onchocerciasis transmission in
three drainage basins of the rain forest of South West Cameroon after a
decade of ivermectin treatment. Parasit Vectors. 2015;8:202.
14. Wanji S, Amvongo-Adjia N, Njouendou AJ, Kengne-Ouafo JA, Ndongmo WP,
Fombad FF, Koudou B, Enyong PA, Bockarie M. Further evidence of the
cross-reactivity of the Binax NOW(R) Filariasis ICT cards to non-Wuchereria
bancrofti filariae: experimental studies with Loa loa and Onchocerca
ochengi. Parasit Vectors. 2016;9:267.
15. Pion SD, Montavon C, Chesnais CB, Kamgno J, Wanji S, Klion AD, Nutman
TB, Boussinesq M. Positivity of antigen tests used for diagnosis of lymphatic
Filariasis in individuals without Wuchereria bancrofti infection but with high
Loa loa Microfilaremia. Am J Trop Med Hyg. 2016;95(6):1417–23.
16. Weil GJ, Curtis KC, Fakoli L, Fischer K, Gankpala L, Lammie PJ, Majewski AC,
Pelletreau S, Won KY, Bolay FK, et al. Laboratory and field evaluation of a
new rapid test for detecting Wuchereria bancrofti antigen in human blood.
Am J Trop Med Hyg. 2013;89(1):11–5.
17. Wanji S, Esum ME, Njouendou AJ, Mbeng AA, Chounna Ndongmo PW,
Abong RA, Fru J, Fombad FF, Nchanji GT, Ngongeh G, et al. Mapping of
lymphatic filariasis in loiasis areas: a new strategy shows no evidence for
Wuchereria bancrofti endemicity in Cameroon. PLoS Negl Trop Dis. 2019;
13(3):e0007192.
18. Rao RU, Atkinson LJ, Ramzy RM, Helmy H, Farid HA, Bockarie MJ, Susapu M,
Laney SJ, Williams SA, Weil GJ. A real-time PCR-based assay for detection of
Wuchereria bancrofti DNA in blood and mosquitoes. Am J Trop Med Hyg.
2006;74(5):826–32.You can also read