What does the power outage on 9 August 2019 tell us about GB power system
←
→
Page content transcription
If your browser does not render page correctly, please read the page content below
What does the power outage on 9 August 2019
       tell us about GB power system
EPRG Working Paper                   2006

Cambridge Working Paper in Economics                             2018

Janusz Bialek
Professor of Power and Energy Systems, Newcastle University, UK
Full Professor, Skolkovo Institute of Science and Technology (Skoltech),
Russia

Abstract
The power outage on 9th August 2019 affected over 1 million customers in England and Wales
and caused a major disruption to other critical infrastructures. While the power system
responded exactly how it was designed to in response to an unsecured (N-2) event, it has
uncovered important fault lines which may significantly affect reliability of the system in a
near future.
Over the last 10 years or so the GB power system has changed quite rapidly due to the
decarbonisation drive and penetration of smart grids technologies. Hence it is increasingly
difficult for the ESO to fully monitor, model and control the whole system and therefore the
probability of hidden common modes of failures has increased. This would suggest that it
might be prudent to strengthen the old (N-1) security standard by providing extra security
margin.
There were also other issues highlighted by the outage. Embedded generation reached such a
high penetration level that it cannot be treated any longer as negative demand. Traditional
under-frequency load shedding disconnects indiscriminately all customers on the disconnected
feeders, including embedded generation and frequency response units, hence reducing its
effectiveness. The ability of critical infrastructures and services to ride through the disturbances
has to be closely monitored and tested.
Finally, we have concluded that, in GB at least, power outages matter only if they affect critical
infrastructures, especially transport, in London and the surrounding areas.

Keywords               power blackouts, UK electricity, security of supply

JEL Classification     L94

   Contact                 janusz.bialek@newcastle.ac.uk
   Publication             March 2020, updated 10 May 2020
   Financial Support       N/A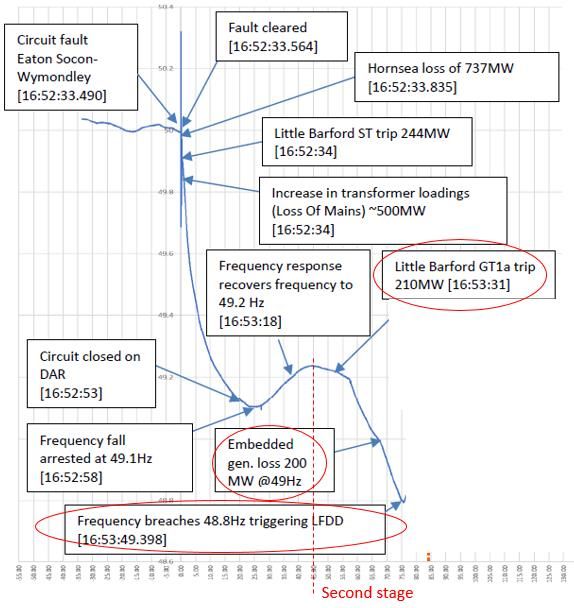
What does the power outage on 9 August 2019 tell us
                       about GB power system

                                                                        Janusz Bialek
                           Professor of Power and Energy Systems, Newcastle University, UK
                 Full Professor, Skolkovo Institute of Science and Technology (Skoltech), Russia

                                                                Amended 10 May, 2020

Contents
1     Introduction .................................................................................................................................................... 2
2     How to maintain a reliable supply of electricity in presence of generation failures ....................................... 2
    2.1        Power-frequency mechanism and the role of inertia ............................................................................. 2
    2.2        SQSS ..................................................................................................................................................... 5
    2.3        Taking into account the reaction of embedded generation .................................................................... 5
    2.4        Load shedding ....................................................................................................................................... 6
3     Description of events ...................................................................................................................................... 6
    3.1        First Stage (45 secs): lightning strike, infeed losses and frequency response ....................................... 6
      3.1.1        Deloading of Hornsea off-shore wind farm ...................................................................................... 9
      3.1.2        Loss of steam turbine at Little Barford combined-cycle gas turbine power station .......................... 9
      3.1.3        Embedded generation losses on Loss of Mains protection ............................................................... 9
      3.1.4        Frequency response........................................................................................................................... 9
    3.2        Second stage: next 11 seconds – further infeed losses ........................................................................ 10
      3.2.1        Loss of first gas turbine at Little Barford ........................................................................................ 10
      3.2.2        Embedded generation losses when frequency dropped below 49 Hz ............................................. 10
    3.3        Third stage: load shedding and restoration of 50 Hz .......................................................................... 11
      3.3.1        Performance of load shedding ........................................................................................................ 11
4     Impact on other critical infrastructures ......................................................................................................... 12
    4.1        Rail ...................................................................................................................................................... 12
    4.2        Health .................................................................................................................................................. 13
    4.3        Water ................................................................................................................................................... 13
    4.4        Other Energy ....................................................................................................................................... 13
    4.5        Airports ............................................................................................................................................... 13
5     Do outages matter? ....................................................................................................................................... 13
    5.1        May 2008 outage ................................................................................................................................. 13
    5.2        Outages in 2003 .................................................................................................................................. 14
    5.3        When do outages matter? .................................................................................................................... 14
6     What does the outage tell us about the state of GB power system? .............................................................. 15
    6.1        Does (N-1) rule need to be reviewed? ................................................................................................. 15
      6.1.1        Option 1: Business As Usual .......................................................................................................... 16
      6.1.2        Option 2: Provide additional security margin ................................................................................. 17

                                                                                 Page 1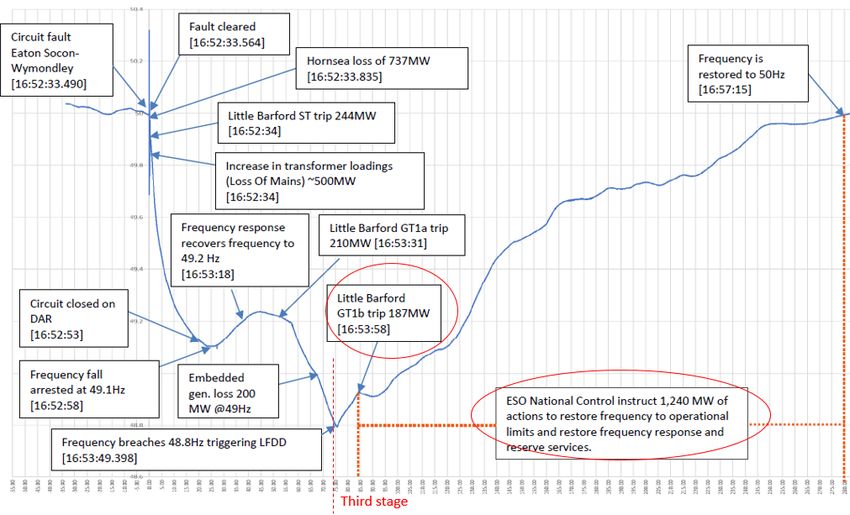
6.1.3        Option 3: Enhance reliability via emergency controls .................................................................... 17
    6.2        Load shedding ..................................................................................................................................... 18
    6.3        Microgrids ........................................................................................................................................... 18
    6.4        Interactions between critical infrastructures ........................................................................................ 18
7     Conclusions .................................................................................................................................................. 18
8     References .................................................................................................................................................... 19

1     INTRODUCTION

Reliable supply of electricity is of fundamental importance for any modern society and economy, so it is no
surprise that the power outage on 9th August 2019 that affected over 1 million customers in England and Wales
and caused a major disruption to other critical infrastructures (especially rail services in the South of England
including London) was a major news item and sparked wide-spread discussions about who is to blame. Power
outages are like stress tests exposing strengths and weaknesses of the power system as the whole and its constituent
elements and other critical infrastructures connected to it so our main aim is to consider the title question: what
does the power outage tell us about the state of GB power system.
In this paper, we will make extensive use of the following reports: (Ofgem, 2020), (ESO, 2019b), (E3C, 2020)
but our main intention is not to repeat the findings contained in those reports but rather draw more general
conclusions about the current state of GB power system and what are the problems that need to be addressed. This
is especially important in view of the goal of net-zero greenhouse gas emissions by 2050. To achieve that target,
the power system will have to change even more rapidly than it has over the last 10 years so any weaknesses
exposed by the outage will have to be urgently addressed.
In Section 2 we will provide an overview of the mechanisms by which power systems are kept secure when power
stations trip. Then we will describe the event itself in section 3, and in section 4 we will describe the impact the
outage had on connected critical infrastructures and services. Some of the power outages that happened in GB
over the last 20 years have attracted a wide media coverage and public attention while others have not. Hence in
section 5 we will address the question when do power outages matter. In section 6 we will try to answer the title
question of what does the outage tell us about the state of power system and we will conclude in section 7.

2     HOW TO MAINTAIN A RELIABLE SUPPLY OF ELECTRICITY IN PRESENCE OF
      GENERATION FAILURES

Whenever a blackout/outage happens, the first reaction of media and people is: it should have never happened.
However it is important to appreciate that it is never possible to have 100% reliable power system and outages
will always happen. As reliability is expensive, the main question is what is the cost-effective level of system
reliability we require. Most media and public attention is devoted to transmission-level outages, like the one on
9th August, as they affect hundreds of thousands or even millions of people. But actually, by far the most common
outages are at the distribution level, e.g. caused by a digger hitting an underground cable. As distribution networks
are usually radial, i.e. tree-like, a cable failure at a certain point is local, i.e. it will disconnect only the customers
connected to the affected feeder below that point. By comparison, outages at the transmission level, caused by
failures of the transmission network or transmission-connected power stations, are quite rare but disconnect more
customers as they affect large areas of a country. It is only human to be more concerned about very rare but big
events rather than more frequent but small ones.
In this section, we will outline the main principles of maintaining the reliability of a power system and means of
achieving it. We will concentrate on maintaining the balance of power, i.e. continuity of supply when a power
station suddenly trips. We will not consider the effects of transmission network failures.

2.1       Power-frequency mechanism and the role of inertia
Due to a lack of large scale energy storage, the power balance in a system must be held at all times, i.e. the amount
of power produced must be equal to the amount of power consumed. If there is any imbalance, it will show itself
by changes in power system frequency, and in this subsection, we will explain this mechanism.
Frequency in a power system (50 Hz in GB) is determined by the speed of synchronous generators which convert
mechanical power providing by turbines (steam, gas, hydro) into electrical power in traditional power stations.

                                                                               Page 2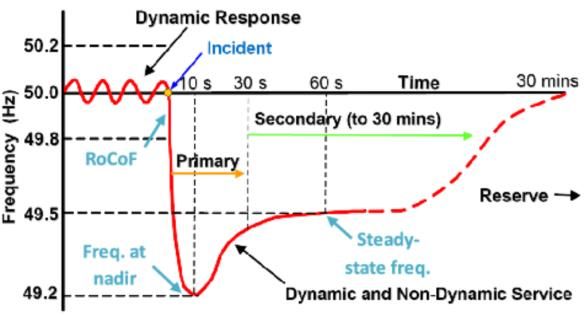
Synchronous generators are kept in synchronism by electromagnetic forces, i.e. they rotate at the same speed1.
This mechanism can be visualised in a cartoon form in Figure 1. A number of parallel cars (representing
generators) pull up a hill a big wheel (representing the combined power system load). The strings linking the cars
to the wheel represent electromagnetic forces. The links ensure that the cars run at the same speed (frequency) in
the steady-state, which means that the power system frequency is the same everywhere2. If there are some bumps
on the road, which represent small changes in power system demand or generation, the balance of forces is
disturbed and frequency will change. System inertia stores kinetic energy, so it provides a buffer to any
disturbances, releasing additional energy by slowing down when there is a deficit of power or storing extra energy
by speeding up when there is a surplus of power. The bigger the system inertia, the lower frequency changes
resulting from power balance disturbances. As demand changes all the time, frequency undergoes continuous
fluctuations around 50 Hz. The task of Electricity System Operator (ESO) is to make sure that frequency is kept
within the statutory limits set out by National Electricity Transmission System Security and Quality of Supply
Standard (SQSS, 2019).

                                  Figure 1 Cartoon visualisation of power-frequency mechanism3.

Let us now consider what happens when a power station suddenly trips which in Figure 1 could be represented
by a sudden snapping of one of the car links. In the first few seconds, before generator controls start to react, the
resulting deficit of power will be covered from kinetic energy of all the rotating masses in the system (generator
rotors and turbines) so their speed (and therefore system frequency) will drop – similarly in Figure 1 all the cars
will slow down.
Each turbine is equipped with a turbine governor which controls its main valve4. Any drop of frequency is
therefore picked up by turbine governors which will automatically open more the turbine valves and hence
increase the power output of generators. This will continue until the frequency stops falling and therefore, power
balance is restored. This is a fully automatic process, generally referred to as primary frequency response, and all
synchronous generators synchronised to the grid must participate in it. Note that when the power balance is
restored following a disturbance, the frequency is again constant but lower than 50 Hz. The task of returning back
to 50 Hz is generally referred to as secondary frequency response, and it is initiated and controlled centrally by
System Operator. Usually, only selected generators contribute to it.
Figure 2 shows a typical frequency response of the system to a loss of a large power station indicating the primary
and secondary frequency response and the minimum value of frequency referred to as the frequency nadir. The
ESO has its own definitions of primary and secondary frequency which are based on how quickly they can be
deployed and sustained:
     •     Primary –starts within 10 secs after an event, sustained for further 20 secs.
     •     Secondary – starts within 30 secs and continues for 30 minutes.

1
  To be more precise they rotate at the same electrical speed which determines the frequency. The mechanical speed of rotors will depend on
the number of poles of a generator. A two-pole rotor will rotate at 3000 revolutions per minute (rpm) to produce 50 Hz power, a four-pole
rotor will rotate at 1500 rpm etc.
2
  Frequency is the same everywhere only on average. The strings linking the cars represent electromagnetic forces which exhibit an elastic
spring-like behaviour. Hence, if there is a disturbance (e.g. a bump on the road), the balance of forces is disturbed and the speed (frequency)
of individual cars (generators) will oscillate around the average speed (frequency).
3
  This cartoon has been taken by the author a long time ago from a National Grid presentation but unfortunately the exact source of it has been
lost in the mist of time, for which the author apologises and expresses a gratitude to the anonymous author for the excellent cartoon.
4
  The simplest speed governor is the famous centrifugal Watt regulator which opens more the main turbine valve when frequency drops.

                                                                    Page 3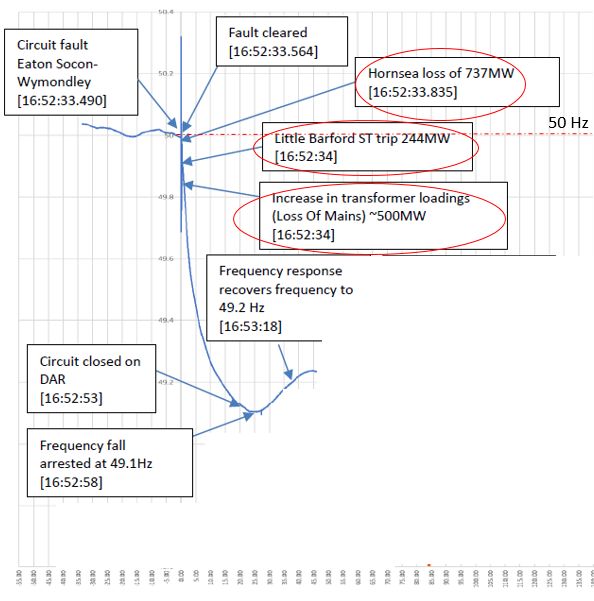
•

                                       •    Figure 2 Illustration of frequency response (Teng, 2015).

It is important to consider the impact of renewable generators on the system frequency response. The speed with
which frequency is dropping during the first few seconds after a disturbance is referred to as the Rate of Change
of Frequency (RoCoF), see Figure 2, and it depends on the combined inertia of all the synchronous generators and
turbines connected to the system. As traditional synchronous generator-based power stations are being replaced
by non-synchronously connected power sources such as wind, PV and DC interconnectors5 which contribute little
to the inertia, the system inertia has been dropping for years in GB and other countries. Lower inertia means that
a loss of a power plant will result in a higher RoCoF and also a lower nadir. This is a matter of serious concern to
the System Operator which has to take steps to limit RoCoF and frequency nadir by, e.g. limiting the amount of
non-synchronous generation (wind or PV) or reducing the imports via DC interconnectors. The latter is cheaper
than the former as the marginal cost of renewables is close to zero while the power imported has a price associated
with it.
Ensuring an adequate provision of frequency response so that frequency stays within the statutory limits for any
reasonably-expected contingency (so-called Secure Event) is one of the main tasks of the ESO. In doing so the
ESO has to take into account the influence of changing system inertia which may change quite radically
throughout the day – see Figure 3– and which is not easily measured. Mandatory Frequency Response is provided
from synchronised Balancing Mechanism6 (BM) units under Grid Code obligations. The ESO also has a large
variety of commercial frequency response contracts provided by generation, demand and storage, both
participating and non-participating in Balancing Mechanism. The cost of providing frequency response in 2019/20
was £152M (ESO, 2020b).

                                               Figure 3 Daily inertia profile (ESO, 2020)

Table 1 shows the amount of frequency reserve at the time of power outage on 9 August 2019. Dynamic frequency
response is a continuously provided service used to manage the normal second by second changes on the system.
Static response is usually a discrete service triggered at a defined frequency deviation.

5
    The connection to the main AC transmission network is by means of power electronics, i.e. inverters.
6
    The Balancing Mechanism is one of the tools used by the ESO to balance electricity supply and demand close to real time.

                                                                  Page 4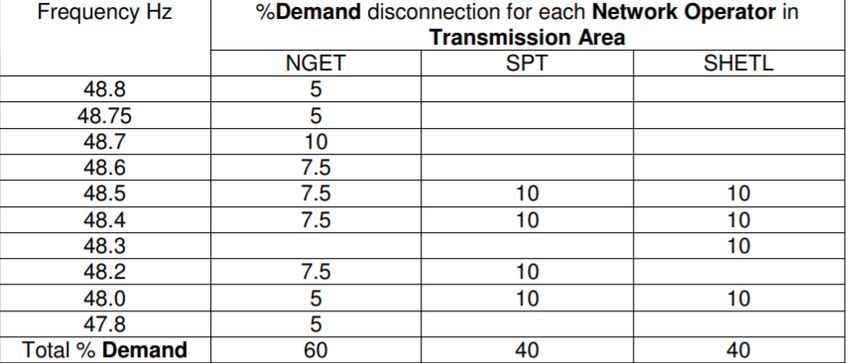
Table 1 - Frequency reserve held on 9 August 2019 (ESO, 2019b)

2.2        SQSS
In GB, reliability standards are formalised in National Electricity Transmission System Security and Quality of
Supply Standard (SQSS, 2019) and the task to enforce them falls to the Electricity System Operator (ESO) and
other network operators. The SQSS requires the operation of the national electricity transmission system such that
it remains secure following the occurrence of any one of a set of potential faults / contingencies (Secured Events)
under prevailing system conditions.
To simplify the industry jargon used in SQSS, the system should remain secure following any (N-1) event, i.e. a
loss of a largest single infeed which is either a single large generator, with a single mode of failure such as a single
connection to the transmission system, or could be two or more smaller generators that are separate but are
connected to the rest of the system through an asset treated as a single Secured Event (for example a double circuit
overhead line or busbar). Normally it is Sizewell nuclear station at 1,260 MW but, if it is not operating as it was
the case on 9 August, it is an interconnector at 1,000 MW. The SQSS anticipates that only one Secured Event
would happen at any one time and does not assume multiple Secured Events occurring simultaneously, i.e. (N-2)
or more events. The (N-1) standard is a common-sense engineering rule, which is universally accepted around the
world, and follows from a consideration that the probability of two power stations failing independently and at
the same time is very low and securing against it would be prohibitively expensive.
For the system to remain secure after a contingency, the amount of fast primary reserve held must be higher than
the highest anticipated single infeed loss. Table 1 shows that the primary frequency reserve on 9 August 2019 was
1022 MW, i.e. just 2.2% above the 1000 MW of maximum infeed loss anticipated.

2.3        Taking into account the reaction of embedded generation
When identifying the largest infeed loss, the ESO must also take into account the effect of any consequent infeed
losses in embedded generation7. The reason for that is that any embedded generation must be equipped with Loss
of Mains protection which disconnects a generation plant from distribution network in the event of a loss of supply
to the network (islanding) to prevent operation and safety-related problems. However, when there are large
disturbances at the transmission level causing fast frequency and voltage changes, they could be wrongly
interpreted as Loss of Mains by the protection of embedded plants which would disconnect them. Hence the ESO
must make sure that a Secured Event would not activate Loss of Mains protection.
There are two main types of Loss of Mains protection: Rate of Change of Frequency (RoCoF) and Vector Shift.
RoCoF works on the principle that if a part of a distribution network is islanded, frequency will change rapidly
due to low inertia of that part of the network and a large imbalance of power. The RoCoF settings of embedded
generators are specified by ENA Engineering Recommendations and are not uniform but depend on the size, point
of connection, and date of commissioning (WPD, 2018). However the ESO assumes that the RoCoF limit is set
at a historical value of 0.125 Hz/s and seeks to ensure that the system is configured in real-time in such a way that
the limit is not breached for a Secured Event. This is achieved by dispatching traditional generation (and thereby
increasing inertia) while reducing imports or renewable generation (with the former being more economic than
the latter), management of response or reduction in the size of the potential largest infeed loss. The cost of
managing RoCoF in 2019/2020 was £210m (ESO, 2020b). There is an ongoing Accelerated Loss of Mains Change

7
    We will use interchangeably the terms embedded or distributed generation to denote generation connected at the distribution level.

                                                                     Page 5
Programme to replace the protection settings of embedded generation to make them less sensitive to transmission
system disturbances, and increase RoCoF to 1 Hz/s, but the program is due to be completed only in 2022.
Vector Shift protection detects sudden changes in the mains voltage angle and it reacts quickly to changes in
network impedance which often occur during islanding. However Vector Shift protection has been also found
sensitive to short-circuits such as those accompanying lightning strikes. The ESO must therefore assesses the risk
and probability of a Secured Event, the cost to secure and the likely level of Vector Shift. Based on this assessment
the ESO will secure for the potential cumulative effect of vector shift (e.g. following a transmission fault) and
infeed loss where it considers it appropriate to do so.
2.4 Load shedding
While a failure of two or more power stations is a rare event (the previous time it happened in GB was in 2008 –
see section 5.1), it nevertheless may happen so the power system must have further defence lines. If frequency
keeps dropping below the statutory limts indicating a large power deficit, automatic under-frequency load
shedding is activated to disconnect demand and restore power balance. In GB, this is referred to Low Frequency
Demand Disconnection (LFDD) and is activated in blocks as indicated in Table 2. LFDD is first activated when
frequency drops to 48.8 Hz when 5% of demand in NGET area (England and Wales) is supposed to be
disconnected. The percentage is based on the annual peak demand so the actual load shed at any other season may
generally be different as the percentage of the actual demand.
Table 2 - Low Frequency Demand Disconnection (LFDD) blocks in GB (NGET, 2019).
It is important to appreciate that load shedding is pre-planned and executed by DNOs by opening circuit breakers
at 33 kV level and therefore disconnecting indiscriminately all the customers connected to the disconnected
feeders. This may also include embedded generation hence weakening the effectiveness of load shedding, as
indeed happened on 9 August.
Certain sites which are deemed to be of “major” or “national importance” may apply for Protected Site status and
be exempted from load shedding but only if the site does not have, and has demonstrated that it is not possible to
install, standby generation. It also must be connected to a discrete feeder so that it can be disconnected separately
(DBEIS, 2019a).
3 DESCRIPTION OF EVENTS
Prior to the initial fault, there was approximately 32GW of transmission-connected generation capacity available
on the system. Over 30% of this capacity was being provided by wind generation, and 50% was being provided
by conventional units. The overall demand was forecast to reach 29GW, which was similar to the outturn demand
experienced on the previous Friday. Generation margins for the day were comfortable.
Weather conditions on the day were also not unusual, with a number of yellow warnings of high winds and
lightning strike alerts issued by the Met Office.
3.1 First Stage (45 secs): lightning strike, infeed losses and frequency response
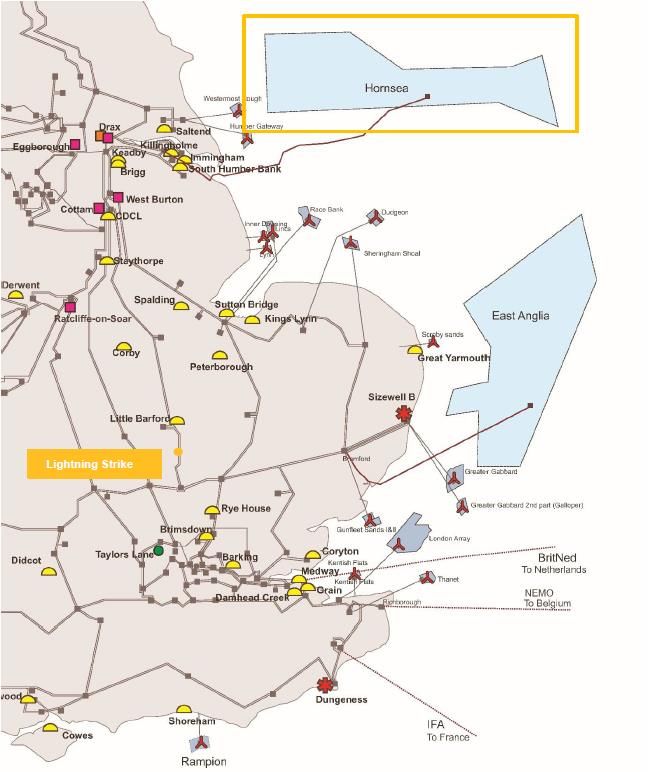
At 16:52:33 there was a lightning strike on the Eaton Socon – Wymondley 400kV line –see Figure 4. A lightning
strike is nothing unusual, and the protection systems on the transmission system operated correctly to clear it. A
lightning strike is effectively a short-circuit causing the voltage to drop, as shown in Figure 5. The associated
voltage disturbance was in line with what was expected and should not have caused any significant disturbances.
However, the lightning strike on 9 August caused three types of infeed losses discussed in detail below: about 150
MW of embedded generation lost on Vector Shift protection, deloading of 737 MW at Hornsea off-shore wind
Page 6farm and a loss of 244 MW steam turbine at Little Barford gas-fired power station. While the first loss was to be
expected, the two power station losses were unexpected. The total infeed loss was 1131 MW which was above
the level required to be secured by the security standards (1000 MW at the time) and therefore higher than 1022
MW of primary frequency response held.
Figure 4 – Map of the affected area (ESO, 2019b)
Page 7Figure 5 – Single-phase voltage profiles at various locations following the lightning strike (ESO, 2019b).
Figure 6 shows the resulting frequency drop following such a large infeed loss. Rate of change of frequency was
higher than the limit of 0.125 Hz/s, and this caused a further 350 MW embedded generation loss on RoCoF
protection. Hence the total embedded generation loss on Loss of Mains protection was about 500 MW making the
total infeed loss equal to about 1480 MW, i.e. nearly 50% more than the maximum secured infeed loss. The
resulting fall in frequency has released two counter-actions: the primary frequency response (see section 3.1.4
below) that released about 850 MW, i.e. about 83% of 1022 MW reserve held (Ofgem 2020), and the demand
frequency response that reduces electrical demand of rotating machinery. (ESO, 2019a) states that the reduction
in demand due to falling frequency is approximately about 350 MW at 49.5 Hz. In the first phase, the frequency
dropped to 49.1 Hz, so the demand frequency response can be approximated as about 630 MW. Hence the total
combined effect of the primary and the demand frequency response was about 1480 MW which is approximately
equal to the total infeed loss8. Consequently, the frequency fall was arrested at 16:52:58 and started to recover.
Hence, if it was not for further infeed losses, the system could have possibly withstood such a severe disturbance.
Figure 6 – Frequency trace at the first 45 seconds after the lightning strike (ESO, 2019b).
8
The author would like to thank Dr. Callum MacIver of Strathclyde University for his help in explaining the demand frequency response.
Page 83.1.1 Deloading of Hornsea off-shore wind farm
Hornsea off-shore wind farm is owned by Orsted and was connected to the grid in February 2019. At the time of
the outage, it was progressing through the Grid Compliance process and had fulfilled the necessary requirements
to export on an interim basis only. Shutting down of two units generating 737 MW was triggered by a voltage
drop following the lightning strike, see the light blue trace in Figure 5, and was caused by discrepancies between
its on-shore control systems and individual wind turbines. Orsted identified this stability issue with its voltage
control systems about 10 mins before the deloading but at that time, it did not cause any problems.
There were more problems with Hornsea which came to light after the incident. It transpired that there were
performance issues with voltage control when the plant operated at full capacity of 1200 MW but the issue was
not communicated to ESO. A software update to mitigate the problem was scheduled for 13 August but was
implemented on 10 August following the event.
3.1.2 Loss of steam turbine at Little Barford combined-cycle gas turbine power station
Little Barford power station is owned by RWE Generation, and it was commissioned in 1995 and went through a
major upgrade in 2011/12. One second after the lightning strike, the steam turbine tripped because of a discrepancy
in the three independent speed sensors on the turbine. This discrepancy exceeded the tolerance of the control
system, causing the generator to automatically shut down. The root cause of the discrepancy in the speed sensors
has not been established.
3.1.3 Embedded generation losses on Loss of Mains protection
The lightning strike caused sudden voltage changes which were interpreted as islanding by Vector Shift protection.
A fast drop in frequency exceeding 0.125 Hz/s was also interpreted as islanding by RoCoF protection on some of
the units. The problems of the sensitivity of Loss of Mans protection are well known and documented. There is
an on-going Accelerated Loss of Mains Change Programme which addresses the issue but it is due to conclude in
2022. Ofgem recommended reviewing the timescales for the delivery of the programme and consider widening
its scope to include distributed generation that unexpectedly disconnected or deloaded on 9 August
3.1.4 Frequency response
Table 3 shows the validated frequency response performance (ESO, 2019b). (ESO, 2019b) stated that while the
overall performance was broadly in line with expectations, there was also some under-performance identified.
(Ofgem, 2020) provided a harsher assessment of the performance of frequency reserve performance stating that
it was inadequate. Primary response providers under-delivered by 17% (i.e. more than 11 % indicated in Table 3)
and secondary response providers under-delivered by 14% (vs. 12% indicated in Table 3). Mandatory response
providers and commercial Fast Frequency Response providers of dynamic primary response (required to provide
a continuous, proportional response to the change in frequency) performed particularly poorly, under-delivering
by approximately 25% respectively. Some of the reserve and frequency responses could not deliver as they were
disconnected by LFDD – see discussion in section 6.2.
Table 3 – Validated frequency response performance (ESO, 2019b)
Page 93.2 Second stage: next 11 seconds – further infeed losses
As discussed earlier, the primary and demand frequency responses released by the falling frequency have covered
the initial infeed losses, so that frequency fall was arrested and started to recover. However, there were further
infeed losses: 210 MW due to a trip of one gas turbine unit at Little Barford and 200 MW of embedded generation
when frequency dropped below 49 Hz. Consequently, frequency started to fall again, as shown in Figure 7 until
it reached 48.8 Hz triggering the first stage of load shedding (LFDD).
3.2.1 Loss of first gas turbine at Little Barford
When the steam turbine tripped in the first stage of the event, steam pressure started to rise, and the normal course
of action would have been to feed steam directly into the condenser in a steam bypass mode of operation. For
reasons presently unknown, this did not work, and steam pressure continued to rise until after approximately 1
minute the first (GT1a) gas turbine tripped with a loss of further 210 MW.
3.2.2 Embedded generation losses when frequency dropped below 49 Hz
When wind turbines started to be connected to the power system in large numbers in the early 2000s, they were
usually equipped with relays that tripped them when frequency dropped to 49 Hz. The reason was that with low
penetration of wind turbines, their role in power balancing was limited and DNOs wanted embedded wind
generators to disconnect from the system in case of any large disturbances for operational and safety reasons.
However with large penetration of wind, the picture has changed, and this is was recognised as one of the
contributing factors to GB power outage in May 2008, see section 5.1, and also to 2006 Europe-wide disturbance.
Consequently, changes were made to Distribution Code in August 2010 reducing the under-frequency protection
level to 47 Hz for distributed generators with capacities larger than 5 MW. Hence it is likely that protection settings
on some generators were not changed in line with the new regulations and they tripped when frequency reached
49 Hz.
Another possible reason for the embedded generation losses may have been due to internal control systems that
cause these generators to deload in response to frequency drops. Some power electronic interfaced generators may
have settings within their internal systems which have been configured by the manufacturer, and as a result, are
hidden from the DNO or generators themselves. These settings could also explain the loss of further distributed
generators when the system frequency dropped below 49 Hz (Ofgem, 2020).
Figure 7 – Frequency trace: the second stage - next 11 seconds (ESO, 2019).
Page 103.3 Third stage: load shedding and restoration of 50 Hz
When frequency dropped to 48.8 Hz, automatic load shedding (LFDD) was activated, and frequency started to
recover quickly – see Figure 8. In total 931 MW of demand was disconnected in England and Wales9, i.e. 3.2%
of the total10, affecting about 1.1 million people. The power balance deteriorated again when the second gas turbine
unit (GT1b) was tripped manually after 30 seconds by staff at Little Barford power plant due to continuing build-
up of steam pressure, losing a further 187 MW, but this did not affect the events materially. After a small dip due
to the loss GT1b, frequency continued to recover as the control room instructed generators to increase generation
and stabilise the system. In total, about 1240 MW of additional power was delivered (on top of about 1000 MW
of frequency response), and 50 Hz was restored nearly 5 minutes after the lightning strike. The ESO started to
instruct DNOs to restore supply to their customers. Full supply was restored within about 40 minutes
Figure 8 – Frequency trace: third stage - load shedding and restoration of 50 Hz (ESO, 2019)
3.3.1 Performance of load shedding
The first stage of LFDD should have resulted in disconnecting the equivalent of 5% of winter peak demand.
However, in fact, DNOs disconnected only 3.2 % of demand prior to the disturbance - see Table 1. This has not
adversely affected the frequency recovery; however, it is a cause of concern.
There are several explanations provided for the lower levels of demand disconnection. The principal cause appears
to be the technical specification of some LFDD relays which prevented them from activating. These relays would
have activated if the frequency had dropped marginally lower and the Grid Code permits this margin of error.
Another cause may have been the disconnection of significant volumes of distributed generation as part of the
LFDD operation which lowered the net demand reduction. Currently, it is not possible to discriminate between
sites affected by load shedding on the same feeder – both demand and generation is disconnected. The lower
bound for the total estimated distributed generation lost across the event is 1,300MW, and the loss could be as
high as 1,500MW (Ofgem, 2020), i.e. even higher than the transmission connected generation lost during the
event. As more and more generation is connected at the distribution level, the current practice of non-
discriminative load shedding is becoming increasingly unsustainable. More generally, there is an increasing need
for ESO and DNOs to monitor and understand the role of distributed generation in the energy mix and the control
of the electricity system – see section 6.
9
SP Distribution disconnected 22 MW in Scotland, due to incorrect settings in LFDD equipment, and reconnected the customers without
informing the ESO.
10
(Ofgem, 2020) report states that the amount of load shed amounted to about 4% of the demand.
Page 11Table 4 – DNO customers affected by LFDD relays (ESO, 2019b)
4 IMPACT ON OTHER CRITICAL INFRASTRUCTURES
The main direct impact of the event was that about 1.1 million customers lost supply for up to 40 minutes.
However, it was the serious impact of the disturbance on other infrastructures and services, rather than the power
loss itself, which made the outage headline news.
4.1 Rail
There is some discrepancy between the reports regarding whether or not traction supplies were affected by LFDD.
(ESO, 2019b) states: “the DNOs confirmed that no track supplies were lost due to the DNO’s LFDD protection
operation” while (Ofgem, 2020) states that “the traction supplies to the Wirral line on Merseyrail were
disconnected as a result of SP Energy Networks’ LFDD operations. Three Transport for London stations and eight
signalling sites at rural locations across England and Wales were also thought to have been affected by LFDD
operations, although traction supplies were unaffected”. However, that discrepancy in reporting is not that
important as all the reports agree that the main effect on rail services was due to the wide frequency excursions.
Most importantly, a certain class of trains (Desiro City Class 700 and 717 manufactured by Siemens and operated
by Govia Thameslink Railway (GTR)) suffered a protective shutdown when frequency reached 49 Hz. GTR
maintains that the technical specifications for the trains stipulated that they should have operated for a short time
when supply frequency drops down to 48.5 Hz, but subsequent investigation discovered that it was not followed.
To make things worse, out of 60 trains affected only about half could be restarted by the drivers. The remaining
half, which had new software installed, had to wait for a technician to arrive with a laptop to restart it manually,
which introduced significant delays.
The impact on the rail network was severe: there were 23 train evacuations, and thousands of passengers had their
journeys delayed with 371 trains cancelled, 220 part cancelled, and 873 trains delayed. London St Pancras and
King’s Cross stations had to close for several hours due to overcrowding, and London Euston went exit only for
a period of time. It all happened on Friday around 5 pm, i.e. at the worst possible time, and it was this rail chaos
that was the main source of public anger and made news headlines.
London Underground have confirmed there were impacts on the London Underground Victoria Line, which was
suspended as a result of the event and service was restored at 17:35hrs. UKPN have confirmed that LFDD did not
impact the Victoria line, but they had an internal traction issue.
Page 124.2 Health
Two hospitals were affected by LFDD with their back-up generation working as designed. Another hospital was
affected by the fall in frequency/voltage excursion, despite not being disconnected as part of LFDD. This was due
to incorrect protection settings on the hospital’s own network, which resulted in the site switching over to back-
up generation and one of its 11 generators failing to operate.
4.3 Water
Approximately 3,000 people experienced water supply disruptions due to booster water pumping stations failing
to automatically switch over to back-up power supplies. Some of these customers would have experienced a
temporary loss of running water in their homes, but others would have remained unaffected due to water storage
in the system, allowing running water to continue. The majority of customers were restored within 30 minutes.
4.4 Other Energy
An oil refinery was disconnected as a result of the site’s system, which detected a drop in frequency and
disconnected the plant to protect on-site equipment. The refinery operations team utilised the site’s emergency
procedures and automated systems to safely shut down portions of the plant, however, due to the complexity of
restarting large process units it took a few weeks to restore normal operations.
4.5 Airports
Newcastle Airport has lost supplies for 17 minutes. However, the back-up supplies for safety-critical systems
operated smoothly to, and there were no serious consequences.
There was also another unnamed airport affected in Midlands (E3C, 2020). While it was unaffected directly by
LFDD, it switched to-back up power supplies without issue and was restored within a few minutes. A fault with
its on site internal network meant that power to some services was delayed for up to 50 minutes.
5 DO OUTAGES MATTER?
The question posed in the title of this section may seem to be rather rhetorical with the obvious answer: yes. It is
obvious and hardly needs repeating that a secure supply of electricity is of fundamental importance for a modern
society and economy. Without it, life as we know stops. All the major blackouts throughout the worlds have been
major disturbances causing significant economic losses, and sparking wide media coverage and heated discussions
about who to blame. However, the evidence from GB outages over the last two decades would suggest that in this
country at least, this has not always been the case and in this section, we will analyse this phenomenon by
considering the previous transmission-level outages.
5.1 May 2008 outage
The GB outage that happened in May 2008 (National Grid 2009) was quite similar to the one on 9th August 2019.
Yet it did not result in a wide media coverage so it is worth considering it in detail.
On the morning of 27th May 2008 two large power stations tripped within two minutes independently of each
other: 345 MW Longannet coal power station in Scotland (Generator A) and 1237 MW nuclear power plant
Sizewell B (Generator B). The annotated frequency trace is shown in Figure 9. The total loss was 1582 MW which
was more than the maximum secured infeed loss of 1260 MW. Similarly, as on 9th August, the frequency dropped
rapidly causing loss of some embedded generation so that the total infeed loss was 1714 MW. Fast frequency
reserve was activated that managed to restore the power balance and stop the frequency drop at 49.15 Hz. Then
frequency started to recover but, similarly as n 9 August 2019, there were further infeed losses due to 279 MW
of embedded wind farms tripping, and frequency started to fall further-reaching 48.8Hz and activating load
shedding11. 546 MW of demand was shed affecting approximately 550,000 customers, i.e. about half of the
affected by 9th August event. The supply was restored within 20-40 minutes. Despite such a similarity to 9th August
event, the May 2008 outage did not generate headlines or much media interest.
11
At that time load shedding was referred to National Low Frequency Demand Disconnection Scheme.
Page 13Figure 9 – Frequency trace of May 2008 outage (National Grid, 2009).
5.2 Outages in 2003
It is also interesting to look at other outages which occurred in England in 2003. In the early evening of 28 August
2003, electricity supplies to 476,000 consumers in South London were interrupted (Ofgem, 2003). Just over a
week later, electricity supplies to 220,000 consumers to the East of Birmingham were also interrupted (Ofgem,
2003). In both of these events, power supplies were restored to all customers within an hour. In both cases the loss
of supply arose from the incorrect operation of protection equipment.
However, while both outages were quite similar in terms of the causes and the effect on the power system and its
customers, the knock-on effects on other infrastructures were different. The London outage significantly disrupted
London Underground and the rail system around London at peak time, causing a very significant public outrage
and attracting widespread media attention – similarly as the 9 August event. The Birmingham outage also affected
a number of major consumers including Network Rail, Birmingham International Airport, the National Exhibition
Centre (NEC), two major car plants, Solihull and Sutton Coldfield town centres, shopping centres and a hospital
but it did not attract a large national media coverage.
There was also a third transmission outage in 2003 in the Cheltenham and Gloucester area on 22 October when
165 MW was lost and about 100,000 people affected (Ofgem, 2004) but it was almost completely ignored not
only by the media but also the industry – no comprehensive report was published.
5.3 When do outages matter?
Hence a question arises, based on the evidence of five large-scale transmission-level outages affecting hundreds
of thousands of customers over the last two decades, why some outages attract public attention and others do not.
To understand that, let us look at the similarities and differences between them. The two outages that did attract a
large media and public attention were the 9 th August 2019 and 28th August 2003 events that caused a large
disruption to transport services around London. The 2003 Birmingham outage also affected critical infrastructures
including transport, but it was Birmingham, not London. On the other hand, the May 2008 GB-wide load shedding,
which was quite similar to the 9 August 2019 event, and the 2003 Cheltenham and Gloucester outage did not
affect critical infrastructures. Hence the conclusion seems to be that, in GB at least, outages matter only if they
satisfy two conditions: (i) the affect critical infrastructures, especially transport, and (ii) they affect London and
the surrounding areas. Unless those two conditions are satisfied, none really cares12.
Let us now consider why the disconnection of hundreds of thousands of customers, but without affecting critical
infrastructures, does not attract public attention as it happened, e.g. during May 2008 event. The main reason
seems to be that supply to customers was restored within about half an hour. Outages of that duration happen all
the time due to faults at the distribution level due to e.g. a digger hitting a cable, although without affecting that
large number of customers. What really matters to the public is not the number of people affected but how a
12
This may be a biased view of the author who lives in the north of England but the evidence of five outages is quite conclusive
Page 14disturbance affects their life. Hence if a disturbance is of a relatively short-duration and does not disrupt
significantly critical infrastructures, it does not attract much attention.
It is also useful to compare the GB outages to large blackouts that happened around the world and attracted
significant public attention. Those big blackouts tend to happen either due to significant faults on transmission
networks which spread quickly or due to natural disasters, like hurricanes, earthquakes or forest fires. GB has a
well-designed and maintained transmission network which means that the probability of large transmission faults
quickly spreading is low13. Also, GB is an island which means it is unlikely to be affected by faults in neighbouring
networks, causing cascading failures14. Natural disasters are unlikely as GB is blessed with a moderate climate –
although some areas may be affected by floods. And finally, there are no forests in GB to speak of so forest fires
are not an issue.
6 WHAT DOES THE OUTAGE TELL US ABOUT THE STATE OF GB POWER SYSTEM?
Power outages are like stress tests exposing strengths and weaknesses of the power system as the whole and its
constituent elements and other critical infrastructures connected to it, so it is important to consider what does the
power outage tell us about the state of GB power system.
On the face of it, everything was fine as the power system responded exactly how it was designed to. The system
is designed to withstand a (N-1) event but the outage was caused by simultaneous failures of two power stations.
Hence the infeed loss was higher than the secured one, and the frequency dropped below the statutory limits to
48.8 Hz, which triggered load shedding (LFDD). Despite the amount of load shed being less than designed, and
further infeed losses totalling nearly 1900 MW, the frequency was returned to 50 Hz in nearly 5 mins and power
supplies restored within 40 mins. Consequently, Ofgem gave the ESO a clean bill of health. Ofgem was less happy
with the owners of the two power stations which failed and two of the DNOs who were in a technical breach of
their requirements15. They were not fined but agreed to pay voluntary payments to Energy Industry Voluntary
Redress Scheme: Hornsea1 Ltd and RWE Generation UK plc paid £4.5M each while Eastern Power Networks
and South Eastern Power Networks paid £1.5M each.
Should we then be happy about the state of the GB power system? The answer is: not really. The blackout has
uncovered important fault lines which may significantly affect the reliability of the system in the near future.
6.1 Does (N-1) rule need to be reviewed?
While the system reacted according to the book, i.e. SQSS, the question is if the book is still adequate to the needs.
This was recognised by (Ofgem, 2020) which recommended examining if SQSS is fit for purpose with respect to
the impact of distributed generation, requirements for holding reserve, response and system inertia. In particular
they recommend assessing whether it is appropriate to provide flexibility in requirements for securing risks events
with a very low likelihood, for example on cost/risk basis, and costs and benefits of requiring availability of
additional reserves to secure against the risk of simultaneous loss events. In this section, we will look in particular
at the latter point, i.e. we will examine whether or not the well-established and universally accepted (N-1)
reliability rule should be revised. As there was only one other serious (N-2) incident in GB over the last 30 years
(in 2008 – see section 5.1) so perhaps the (N-1) principle still holds as one outage per 10 years is quite reasonable
from the reliability point of view?
To answer the above question, it is important to realise that the (N-1) standard is a common-sense engineering
principle that was accepted decades ago when the power industry evolved very slowly. Obviously, new
technologies were developed, but they were introduced slowly and did not change the main technical
characteristics of the power system:
• The main sources of generation were synchronous generators that provided inertia necessary to contain any
frequency excursions.
• Power stations were almost exclusively connected to the transmission system and were directly controllable
by the System Operator.
• Power stations were also fully dispatchable as they were fed by fossil fuels (coal, gas), water or nuclear
energy.
• Distribution networks were passive and did not contain much-embedded generation
13
National Grid maintains that, at 99.99995%, the transmission system for England and Wales is the most reliable network in Europe (STC,
2015)
14
GB has a significant amount of interconnections with other countries but they are DC, rather than AC, which isolates GB network from
disturbances in neighbouring networks cascading to GB.
15
The two DNOs reconnected demand without instruction from the ESO
Page 15• System Operators had detailed models of all main power system elements16: generators, their control systems,
the transmission system.
Consequently, a System Operator (or whatever they were called at the time) was like an omnipresent and
omnipotent god who saw everything and could do almost anything. As the system was evolving slowly, the System
Operator had time to commission all new equipment properly and consider any interactions. As they knew the
system and its elements very well, they could predict (and eliminate) any common modes of failure and reasonably
expect that the probability of two large power stations failing simultaneously and independently was very low.
However over the past 10 years or so the situation has changed quite dramatically due to the decarbonisation drive
so we believe that the (N-1) should be reconsidered. The main changes were the following:
• There has been a continuous and accelerating replacement of traditional fossil fuel generation by renewables.
In 2018 renewable generation provided one-third of electricity (DBEIS, 2019). Usually, renewables are
connected to the system by inverters which means they do not provide inertia and frequency stability is an
increasingly important issue.
• Smaller renewable power stations are increasingly embedded in distribution networks and therefore are not
visible to the ESO17 , which means that effectively embedded generation is treated as negative demand by the
ESO. This approach is increasingly non-viable as the amount of distributed generation capacity has increased
from about 7 GW in 2009 to over 25 GW in 2018 (Ofgem, 2020). The amount of embedded generation that
tripped on 9 August was of a similar range as the transmission-connected generation, by some estimates even
higher. Some power electronic interfaced distributed generators may have settings within their internal
systems which have been configured by the manufacturer and as a result are hidden from the DNO or
generators themselves. As (Ofgem, 2020) states: “The event showed that whilst each distributed generator
that de-loaded or tripped may have been small, large volumes of distributed generation behaving in unison
can have major impacts on the system. Understanding the behaviour of these generators is critically important
for managing the risks to consumers of demand disconnection in a cost-effective manner, and this requires
detailed knowledge of their operation and design”.
• Wind and solar generation generally is not dispatchable up (unless it operates part-loaded) creating problems
for balancing the system
• Inverter-connected transmission-level power stations, such as wind, are often equipped with proprietary
control systems. This means that ESO cannot model the system response to disturbances as it does not know
models of some of the system elements. There could be some possible unstable interactions between control
systems which ESO is not aware of. This was exemplified on 9 August when proprietary voltage control
systems of Hornsea wind farm malfunctioned.
• There has been a significant amount of batteries, active demand and generally smart grids technologies added
on to the system. To put in simple terms, it means that a lot of new gear and controls were added to the system
in a very short time and not all of it was properly stress-tested and their interactions considered (indeed,
Hornsea 1 offshore power station was progressing through the Grid Code compliance process at the time).
All that new gear has its own sophisticated control systems (which are often proprietary and therefore not
known to the System Operator) with possibly some unknown interactions.
• With all the new gear and controls added very quickly on to the system, there is little operational experience
which creates uncertainties
We can only expect that the rate of power system changes will accelerate in view of the goal of net-zero
greenhouse gas emissions by 2050. To summarise the issues outlined above, we can say that in the good old days
System Operator had to deal with “known unknowns” – they knew the system, they knew what could fail and
how but they did not know when. Now we have a lot of “unknown unknowns”, i.e. hidden common modes of
failures we do not know about, as demonstrated by the outage on 9 th August. A routine lightning strike caused
two power stations to trip. It should have not, but it did. Hence it is no longer reasonable to assume that failures
of power stations are independent events and therefore a probability of two failures at the same time is very low.
This would suggest that in the presence of such uncertainties regarding the new gear, controls and common modes
of failure, we have three options discussed below.
6.1.1 Option 1: Business As Usual
The first option would be to try to recreate the old world with an omnipresent and omnipotent System Operator.
That would require System Operator to have full visibility of all generation in the system, both transmission- and
distribution-connected. As it might be technically impossible for SO to manage both transmission and distribution,
one could imagine a hierarchical structure with SO managing the transmission level and Distribution System
16
Admittedly, load modelling has been a perennial problem.
17
In other countries System Operators have a better visibility of embedded generation
Page 16You can also read


