NEURAL NETWORK CROW SEARCH MODEL FOR THE PREDICTION OF FUNCTIONAL PROPERTIES OF NANO TIO2 COATED COTTON COMPOSITES
←
→
Page content transcription
If your browser does not render page correctly, please read the page content below
www.nature.com/scientificreports
OPEN Neural network‑crow search model
for the prediction of functional
properties of nano TiO2 coated
cotton composites
Nesrine Amor1, Muhammad Tayyab Noman1*, Michal Petru1, Aamir Mahmood2 &
Adla Ismail3
This paper presents a new hybrid approach for the prediction of functional properties i.e., self-
cleaning efficiency, antimicrobial efficiency and ultraviolet protection factor (UPF), of titanium dioxide
nanoparticles (TiO2 NPs) coated cotton fabric. The proposed approach is based on feedforward
artificial neural network (ANN) model called a multilayer perceptron (MLP), trained by an optimized
algorithm known as crow search algorithm (CSA). ANN is an effective and widely used approach for
the prediction of extremely complex problems. Various studies have been proposed to improve the
weight training of ANN using metaheuristic algorithms. CSA is a latest and an effective metaheuristic
method relies on the intelligent behavior of crows. CSA has been never proposed to improve the
weight training of ANN. Therefore, CSA is adopted to optimize the initial weights and thresholds of
the ANN model, in order to improve the training accuracy and prediction performance of functional
properties of TiO2 NPs coated cotton composites. Furthermore, our proposed algorithm i.e.,
multilayer perceptron with crow search algorithm (MLP-CSA) was applied to map out the complex
input–output conditions to predict the optimal results. The amount of chemicals and reaction time
were selected as input variables and the amount of titanium dioxide coated on cotton, self-cleaning
efficiency, antimicrobial efficiency and UPF were evaluated as output results. A sensitivity analysis was
carried out to assess the performance of CSA in prediction process. MLP-CSA provided excellent result
that were statistically significant and highly accurate as compared to standard MLP model and other
metaheuristic algorithms used in the training of ANN reported in the literature.
Titanium dioxide (TiO2) in different nano dimensions i.e., nanoparticles1, nanorods2, nanobelts3, nanowires4,
nanosheets5 and n anoflowers6 have shown prestigious trend as a photocatalyst and a multifunctional coating
material in many fields of life especially in textiles. Nano T iO2 is significantly utilised in photocatalytic self-
cleaning7, antimicrobial coatings8, superhydrophilic s urfaces9 and waste water t reatment10. TiO2 is an intrinsic
n type metal oxide semiconductor material that closely resembles with zinc oxide in photocatalytic proper-
ties. The prominent features that enables T iO2 as a functional material in many applications are photocatalytic
activity, chemical stability and non-toxicity11. Researchers have synthesized and coated nano T iO2 on textile
substrates in order to achieve various properties based on photocatalytic activity12. In an experimental study,
Noman et al. successfully synthesized and coated T iO2 nanoparticles on cotton fabric under sonication method.
The developed composites were evaluated for self cleaning and antimicrobial characteristics against methylene
blue (MB) dye and bacteria culture i.e., Staphylococcus aureus and Escherichia coli respectively. The developed
composites showed excellent results for self-cleaning and antimicrobial properties. The experimental design
and the obtained results were tested under regression model for statistical evaluation through Design Expert
(DE) software13. Here, in this current study, an attempt has been made to develop a prediction model by using
machine learning tools that can work in two ways i.e., correlates the actual response of coated fabric with process
variables, analyse the predicted response of DE and indicate which approach is better as a prediction model in
1
Department of Machinery Construction, Institute for Nanomaterials, Advanced Technologies and Innovation
(CXI), Technical University of Liberec, Studentská 1402/2, 461 17 Liberec 1, Czech Republic. 2Department of
Material Engineering, Faculty of Textile Engineering, Technical University of Liberec, Studentská 1402/2, 461
17 Liberec 1, Czech Republic. 3Electrical Engineering Department, Laboratory of Signal Image and Energy Mastery
(SIME, LR 13ES03), University of Tunis, ENSIT, 1008 Tunis, Tunisia. *email: tayyab_noman411@yahoo.com
Scientific Reports | (2021) 11:13649 | https://doi.org/10.1038/s41598-021-93108-9 1
Vol.:(0123456789)
www.nature.com/scientificreports/
reality. Nowadays, artificial neural network (ANN) exhibits a strong advantage in capturing any type of existing
relationship from given data as it does not include a physical mechanism and a mathematical m odel14. Thanks
to the training process, ANN can learn, understand and recognize the information treatment rules, adapt and
predict the wanted output variables from database considered as input variables15,16.
In general, textile processes are mostly non-linear in nature and a lot of efforts are applied to obtain optimal
solutions17–20. ANN is an excellent approach that has been widely used for the prediction of various properties of
textile materials where it has proven its effectiveness and potential, such as: prediction of the tensile properties
of even and uneven yarns extracted from polyester-cotton blend21; prediction of the warp and weft yarns crimp
in woven barrier f abrics22; prediction of antimicrobial performance of chitosan/AgCl-TiO2 coated fabrics23;
prediction of core spun yarn strength, elongation and r upture24; prediction of cotton fi bre25; prediction the
change of shade of dyed knitted f abrics ; prediction of coatings process on textile fabrics27; and prediction of
26
thermal resistance of wet knitted f abrics28. These mentioned work reveal that the most common type of ANN
algorithm used in textile industry is multilayer perceptron MLP29,30. MLP is a class of feedforward ANN that
has the advantages of self-learning, high nonlinearity resolution and the ability of mapping between input and
output variables without introducing a mathematical model between nonlinear data and precisely predict the best
function. However, the main drawbacks of MLP model are slow convergence rate, hard understanding problem
and stuck in the local minimum values.
The use of metaheuristic algorithms has gained attention of scientists and researchers in order to improve
the performance of ANN during training process. Gao et al. proposed a dendritic neuron model (DNM) by tak-
ing into account the nonlinearity of synapses31. They used six algorithms to train the DNM that include genetic
algorithm, biogeography-based optimization, particle swarm optimization, ant colony optimization, population-
based incremental learning and evolutionary strategy. Here, simulations results showed that DNM trained by
biogeography-based optimization is the most effective for enhancing DNM performances. Wang et al. proposed a
modified version of the gravitational search algorithm (GSA) based on the hierarchy and distributed f ramework32.
Then, they tested GSA to train the MLP, where they showed promising results. Xiao et al. used a hybrid approach
that combined ANN and genetic algorithm (GA) in order to predict cotton-polyester fabric pilling33. The pro-
posed hybrid approach showed good results compared to the standard ANN. Hussain et al. compared ANN with
adaptive neuro-fuzzy inference system (ANFIS) in the evaluation of fabrics wrinkle r ecovery34. The simulation
results demonstrated that ANN performed a slightly better than ANFIS with significant accuracy percentage.
However, ANFIS process was more useful while drawing surface plots among input and output variables. Dashti
et al. predicted the yarn tenacity using ANN trained by genetic algorithm. The performance of this approach was
useful to achieve desired tenacity with minimum production cost. However, it is a time-consuming p rocess35.
Abhijit et al. applied a combination of GA and ANN as a hybrid algorithm to predict comfort performance and
the range of ultraviolet protection factor (UPF)36. ANN was applied as a prediction tool and GA was utilized
as an optimization tool and for experimental purpose, a set of four samples were selected for the evaluation of
functional properties. The proposed ANN–GA method was carried out for an iterative set of variables until the
required fabric properties achieved. Ni et al. proposed a novel online algorithm that detects and predicts the
coating thickness on textiles by hyperspectral images37. The proposed algorithm was based on two different
optimization modules i.e., the first module is called extreme learning machine (ELM) classifier whereas, the
later is called a group of stacked autoencoders.The ELM module optimized by a new optimizer known as grey
wolf optimizer (GWO), to determine the number of neurons and weights to get more accuracy while detection
and classification. The results explained that online detection performance significantly improved with a com-
bination of VW-SAET with GWO-ELM that provide 95.58% efficiency. Lazzús et al. used the combined ANN
with particle swarm optimization (PSO) to predict the thermal p roperties38. The results demonstrated that the
proposed model ANN-PSO provided better results than feedforward ANN.
Recently, a new meta-heuristic method based on the behaviors of crows has been emerged to solve complex
optimization problems, known as Crow Search Algorithm (CSA)39. CSA include less setting parameters than
the other algorithms such as GA and PSO, which make it more efficient in solving complex problems compared
ethods39. The simple structure, easy implementation, and faster convergence motivate the
to other state-of-art m
use of CSA in the improvement of training process of ANN. Therefore, the main contributions of this paper are:
(1) Proposing the use of CSA to train the MLP; (2) Investigating the accuracy of the propose MLP-CSA for the
prediction of various properties of nano TiO2 coated cotton. The amount of titanium precursor, amount of solvent
and process time were selected as input variables whereas the amount of nano T iO2 coated on cotton fabric, and
some related functional properties i.e., self-cleaning efficiency, antimicrobial efficiency and UPF were considered
as outputs variables. The achieved results were compared with the classical MLP, PSO and GA using a sensitivity
analysis. Consequently, significant technical merits are satisfied which prove the effectiveness of the proposed
MLP-CSA approach, thus providing an alternative solution for prediction in textiles materials applications.
The paper is organized as follows: “Material and methods” section describes the details of the materials and
experimental design, as well as reviews the classical artificial neural network framework and introduces the
optimized ANN model with crow search algorithm. In “Results and discussion” section, simulation, comparison
and discussion results of prediction of functional properties of nano TiO2 coated cotton fabric are presented.
Finally, “Conclusions” section summarizes the main findings and concludes the paper.
Material and methods
Material and experimental. Bleached cotton fabric with GSM (fabric mass) 110 g m−2 was used. Titanium
tetrachloride, isopropanol and MB dye were taken from sigma aldrich. The selected variables were the amount
of titanium precursor (titanium tetrachloride); the amount of solvent (isopropanol) and sonication time. The
combination of variables is illustrated in Table 1.
Scientific Reports | (2021) 11:13649 | https://doi.org/10.1038/s41598-021-93108-9 2
Vol:.(1234567890)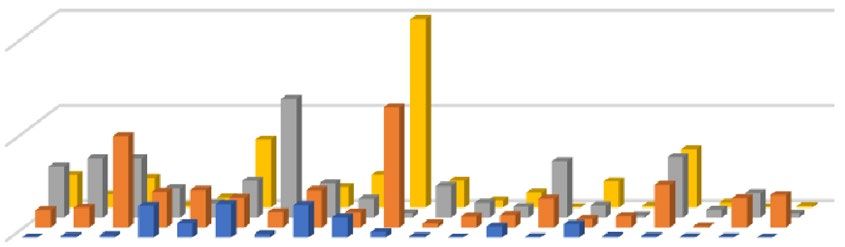
www.nature.com/scientificreports/
Sample TiCl4 (ml) C3H7OH (ml) Sonication time (h)
1 10 6 0.5
2 6 2 3
3 10 6 2
4 6 4 3
5 6 4 2
6 6 4 3
7 10 2 4
8 6 4 1
9 6 4 1
10 10 4 3
11 2 2 0.5
12 2 6 4
13 6 4 2
14 2 6 0.5
15 6 4 1
16 6 4 4
17 6 6 2
18 2 4 1
19 2 2 4
20 10 2 0.5
Table 1. The input variables and experimental design.
Artificial neural network. ANN are mathematical models inspired from biological nerve systems that are
responsible for the functionality of human brain. A very special feature of ANN is the automatically creation,
derivation and exploration of new information using previous learning that is called as training p rocess40.
Multilayer perceptron (MLP) is one of the most common and typical learning algorithm in ANN that deals
with non-linear models by reducing the wanted target error in a gradient descent pattern though tailoring the
weight factors and b iases33,41. In this algorithm, training occurs in three steps: 1) Forward propagation step: an
experimental data is introduced to ANN as input and its effect is propagated in different stages through differ-
ent layers of the network. Then, as a result, the outputs are generated. 2) Computation of the error: the error
vector is computed from the difference between predicted and actual outputs. 3) Backward propagation step:
The computed error vector is propagated backwards to the ANN and the synaptic weights are adjusted in such
a way that the error vector reduces with every iterative step. Furthermore, the ANN model is getting closer and
closer to generating the desired output.
Technically, ANN are used to model non-linear problems in order to predict output dependent variables
y = [y1 , . . . , yn ] for given independent input variables x = [x1 , . . . , xk ] from their training values. The obtained
results mainly depend on weights w = [w1 , . . . , wk ]. The following equation represents the relationship between
input and output of the network42,43:
�
y = ϕ wj ∗ xj + b (1)
j
where, y is the output. xj is the jth input. wj is the jth weight and b represents the bias. ϕ is the activation function.
The biases and weights comprise the information that the neuron recovers during the training phase. A detail
theoretical discussion of ANN architecture and training algorithms are presented by different researchers in
their studies15,44,45. Theoretically, by increasing number of network layers, ANN generates significantly accurate
results. However, increasing number of network layers is a time consuming process and makes the training
process difficult to fit. Therefore, we adopted the standard structure of feedforward ANN, i.e., MLP model that
includes three-layers, one input layer; one hidden layer, and one output layer for the prediction of functional
properties (see Fig. 1).
There were training and testing parts in the proposed MLP model and 75% of the data from Table 1 was used
for the training of the proposed model whereas 25% of the data was used for testing purpose respectively. Three
physical factors shown in Table 1 were considered as training inputs vectors. Therefore, the number of input
nodes for training was 3 and the number of nodes for output layer was 4. The random selection of a number of
hidden neurons might cause either overfitting or underfitting problems. To avoid these problems, the number
of nodes for hidden layer was calculated according to the following e quation33:
√
N = m+n+a (2)
Scientific Reports | (2021) 11:13649 | https://doi.org/10.1038/s41598-021-93108-9 3
Vol.:(0123456789)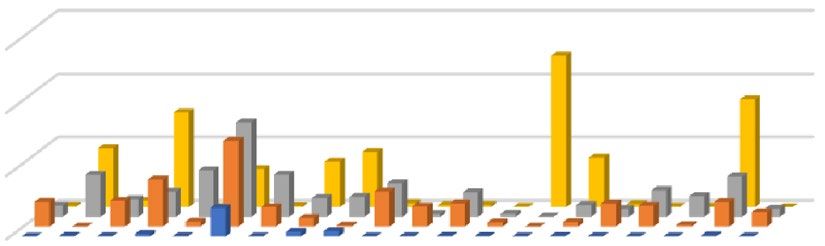
www.nature.com/scientificreports/
Hidden Layers
Input Layer Output Layer
Synthesized and coated TiO2
TiCl4 [ml]
Self-cleaning Efficiency
C3H7OH [ml]
Antimicrobial Efficiency
Time [h]
UPF Efficiency
Figure 1. MLP model for the prediction of functional properties of nano T
iO2 coated cotton.
where N is the number of hidden layer nodes. m and n represent the number of input and output nodes, respec-
tively. a is a constant with a value range [1, 10].
Optimized ANN model with crow search algorithm.
• Crow search algorithm
Crow search algorithm (CSA) is a recent meta-heuristic method proposed in39 to solve constrained engineering
problems. The structure of this algorithm is modeled in mathematical expressions inspired from the intelligent
behavior of the crows while saving their excess food in hiding places and retrieves it when the food is needed.
The basic principle of crows is to observe food spots for other birds, and steal them when the birds leave their
place. Furthermore, if the crow commits the theft, it will take additional precautions such as moving to new
hiding places to avoid becoming a victim in the future again.
The position of crows x is given by:
x i,k = [x1i,k , x2i,k , . . . , xdi,k ]. (3)
where i = 1, 2, ..., N is the indices of crow i and N is the number of crows. k = 1, 2, . . . , kmax is the indices of
iterations, kmax is the maximum number of iterations and d is a dimensional environment.
The crows move through their habitats and seek better hiding places to keep their food safe from thieves.
Every crow has an intelligent memory that allows it to memorize all its previous food hiding places. One of the
important activities of the crow i is following crow j by getting close to where the food is hiding and stealing it.
Therefore, two main events may occur in CSA:
• Case 1: Crow j has no idea that crow i is following it. Here, crow i will get close to the hiding place and changes
its position to a new position as follows:
x i,k+1 = x i,k + ri .fl i,k .(mj,k − x i,k ) (4)
where ri represents a random value range [1, 10]. fl i,k represents the flight length of crow i at iteration k. mj,k
is the best position visited by crow j at iteration k.
• Case 2: Crow j discovers that crow i is followed it. Here, to protect its hideout from theft, crow j will change
the flight pass to mislead followers by moving to another position in its environment.
Therefore, the position of each crow can be described using the following expression:
x i,k + ri .fl i,k .(mj,k − x i,k ) rj ≥ AP j,k
x i,k+1 = (5)
a random position otherwise
where AP j,k represents the awareness probability of crow i at iteration i.
• Optimized ANN model with crow search algorithm
Scientific Reports | (2021) 11:13649 | https://doi.org/10.1038/s41598-021-93108-9 4
Vol:.(1234567890)www.nature.com/scientificreports/
The MLP has many drawbacks such as slow convergence rate and stuck into the local minima. The training pro-
cess and the convergence rate of MLP become more accurate when it is trained using a metaheuristic approaches
like PSO38,46–48 and G
A33,49. However, CSA has been never investigated in training ANN. Training process com-
prises determining the collection of corresponding influences that depreciate the training error. Therefore, we
proposed a new model based on combination between the CSA approach and MLP model to predict functional
properties of nano TiO2 coated cotton. The main objective is to find the optimal prediction of the wanted outputs
while minimizing the error results in training process of MLP. In this proposed model, MLP model optimized
by CSA where CSA is used to optimize the weight and threshold values of MLP, which can more accurately
predict the output results.
In this context, at every iteration k, the crow position x i,k+1 is considered as the collection of weights in MLP-
CSA. The mean square error (MSE) between the predicted and actual outputs is considered as fitness value for
the proposed algorithm MLP-CSA, and the CSA attempts to minimize it during the training of MLP:
1 N n
Minimize{F} = min{ � � (yij − ŷij )2 } where i = 1, . . . , N j = 1, . . . , n. (6)
N i=1 j=1
where N and n are the number of training samples and the number of output nodes, respectively.
In main steps in this proposed MLP-CSA: (1) Initialize the parameters of algorithm: Each crow contains all
the weights and thresholds of the neural network i.e., the connection weight of the input and the hidden layers,
the threshold of the hidden layer, the connection weight of the hidden and the output layers, and the thresh-
old of the output layer. (2) Initialization of the position and memory of every crow: MLP-CSA is started with
random initialization of crow positions (bias and weights). Here, every crow is moved into the weighted search
space striving for propagating the error. (3) Evaluate fitness function: The initial bias and weights used in the
learning process to compute the initial training error. (4) Generate new position: random selection and follow-
ing another crow to find its position of the hidden food. The new positions of crows are given using Eq. (5). (5)
Evaluate fitness function of the new obtained positions and update the memory of each crow: computing the
fitness function value for every crow according to the new position. Then, update the memory of each crow if
the evaluation of the fitness function value of each crow is better than the previous memorized fitness function
value. Figure 2 presents the flowchart of the proposed algorithm MLP-CSA for the prediction of functional
properties of nano TiO2 coated cotton.
Robustness analysis. The performance of the proposed MLP-CSA model was evaluated using various
statistical indicators i.e., root mean squared error (RMSE), mean absolute error (MAE) and coefficient of deter-
mination ( R2), defined respectively by the following equations:
1 n
RMSE = � (yi − ŷi )2 (7)
n i=1
1 n
(8)
MAE = � (yi − ŷi )
n i=1
2
�n
− ȳ)(yˆ − ¯
ŷ)
2 i=1 (yi i
R = �� �� (9)
n
(yi − ȳ)2 n
(yˆi − ¯ 2
ŷ)
i=1 i=1
where yi and ŷ represent the actual and network outputs, respectively. n is the number of samples. ȳ represents
the mean of the actual variables and ŷ¯ is the mean of the predicted variables.
Sensitivity analysis. Sensitivity analysis (SA) is a statistical method that provides an idea of how sensitive
is the best solution chosen to any changes in input values from one or more p arameters50. ANOVA is an inde-
pendent SA method that assesses if there is any statistically significant association between one or more inputs
and output51–54. ANOVA utilizes the statistic ratio F to define if there is a significant difference exists between
the average responses to main interactions or interactions between factors. The higher F value indicates higher
rankings. The p value represents the differences between column means if they are significant or not. In this
paper, one-way ANOVA is used to assess the correlation between obtained results of coated fabric with process
variables using the proposed MLP-CSA, MLP-PSO, MLP-GA, standard MLP model and experimental values.
A repeated measures ANOVA test followed by a post-hoc Bonferroni multiple comparisons test (with an
alpha level significance value of 0.05) is a technique used to evaluate whether there is any statistically significant
difference between two or more independent g roups55. Therefore, these tests were used to compare the differ-
ences in the prediction errors between the results obtained by all algorithms and to determine which algorithm
would be different from the others.
Results and discussion
We predicted the functional properties of nano TiO2 coated cotton fabric using the optimized MLP model with
crow search algorithm (MLP-CSA). The results obtained with the proposed MLP-CSA were compared with the
standard MLP model, optimized MLP model with genetic algorithm (MLP-GA) and optimized MLP model with
particle swarm optimization (MLP-PSO).
Scientific Reports | (2021) 11:13649 | https://doi.org/10.1038/s41598-021-93108-9 5
Vol.:(0123456789)www.nature.com/scientificreports/
MLP-CSA
MLP Begin
CSA
Ini
alize Determine neural
parameters of CSA network structure
Ini
alize posi
ons and Ini
alize the weights
memories of crows and thresholds
Get the error of MLP Op
mal ini
al weights
as fing value and thresholds
Evaluate fitness
Compute error
func
on
Generate new Update the weights
posi
ons of crows and thresholds
No Check feasibility No
Check
of new termina
on
posi
ons criterion
Yes
Evaluate fitness func
on Yes
of new posi
ons
Simula
on
Update memories
Check Yes
No
termina
on
criterion
Figure 2. MLP-CSA model for the prediction of functional properties of nano T
iO2 coated cotton.
Parameters setting of the proposed MLP‑CSA model. The selected MLP model with three-layers
(i.e., an input, a hidden, and an output layers) was adjusted in a way that the number of hidden layer nodes could
not exceed the range of values [4, 13] according to Eq. (2). We found that the best number of hidden layer nodes
are 11, where the network provides highly accurate results. Therefore, we adopted 11 hidden layer nodes to be
used in this work. The parameters and settings of the MLP training network, optimized models with CSA, PSO
and GA are presented in Table 2.
Comparison of MLP‑CSA with currently used MLP‑metaheuristics. The predicted values of func-
tional properties of nano TiO2 coated cotton fabric are presented in Fig. 3. To confirm a fair comparison between
all used algorithms, we performed many trials with different number of populations in each algorithm. Then,
we considered the best results that include the lower MSE and high prediction performance for the functional
properties of nano TiO2 coated cotton in each algorithm. The first sub-figure shows the predicted results of
synthesized and coated TiO2; the second sub-figure represents the results of self-cleaning efficiency; the third
sub-figure represents the results of antimicrobial efficiency whereas the last sub-figure illustrates the results of
UPF efficiency.
The value of absolute prediction error given by the difference between predicted and actual values for all
four functional properties using MLP-CSA, MLP-PSO, MLP-GA, and standard MLP are shown in Fig. 4. We
observed that the values of prediction error were significantly lower for the proposed MLP-CSA as compared to
MLP-PSO, MLP-GA, and standard MLP for all four functional properties.
Figure 5 illustrates the performance MSE convergence characteristics for all used optimized models: MLP-
CSA is in red, MLP-GA is in yellow, and MLP-PSO is in green. We noticed that the lower MSE values were
Scientific Reports | (2021) 11:13649 | https://doi.org/10.1038/s41598-021-93108-9 6
Vol:.(1234567890)www.nature.com/scientificreports/
Methods Parameters Settings
Training function Trainlm
Transfer function of hidden layer Tansig(x) = 2/(1 + exp(−2 ∗ x)) − 1
Transfer function of output layer Purelin(x) = x
Learning rate 0.02
MLP
Performance goal 0.00001
Input node 3
Hidden node 11
Output node 4
Population size 55
Awareness probability 0.1
CSA
Flight length 2
Number of iterations 300
Population size 50
Inertia weight 1
Cognitive factor C1 1.5
PSO
Social factor C2 2
Random values: r1, r2 [0,1]
Number of iterations 300
Population size 20
Variation probability 0.5
Crossover probability 0.4
GA Selection method Roulette method
Mutation method Float
Crossover method Float
Number of iterations 300
Table 2. Parameters and settings of the MLP training network, optimized models with CSA, PSO, and GA.
obtained by the proposed MLP-CSA model compared to MLP-PSO and MLP-GA for all of four functional
properties.
Table 3 represents the computed RMSE, MAE and R 2 for all used models to predict the functional proper-
ties of nano TiO2 coated cotton fabric. We observed that the proposed MLP-CSA model provides lower errors
according to RMSE and MAE, and high accuracy according to R2 compared to MLP-PSO, MLP-GA and standard
MLP for all of the four functional properties. It is clear from the obtained results that the proposed MLP-CSA
model verifies its accuracy and effectiveness in the prediction process.
Robustness assessment by statistical analysis. A one-way ANOVA test was applied to assess the
robustness of the predicted results using MLP-CSA, MLP-PSO, MLP-GA, standard MLP as well as the experi-
ment data. ANOVA test helps to knows how it is the correlations between the predicted responses of coated
fabric with process variables. Table 4 shows the results of one-way ANOVA test of each functional properties
obtained by MLP-CSA, MLP-PSO, MLP-GA, MLP and experimental. It is observed that the proposed MLP-CSA
model was more statistically significant as compared to other models and experimental, as it provides the lowest
p value for all functional properties.
In addition, we performed a repeated measure ANOVA test followed by a post hoc Bonferroni multiple com-
parison test for all predicted error results of synthesized and coated T
iO2, self-cleaning efficiency, antimicrobial
efficiency, and UPF efficiency as shown in Tables 5, 6, 7 and 8, respectively. These tests were used to compare
the differences in the prediction errors between the results obtained by all models as well as to determine which
model would be different from the others. Paired sample t-tests with Bonferroni correction shows that the MLP-
CSA was statistically significant and comparatively different from MLP and MLP-GA. We also noted that the
MLP-CSA and MLP-PSO were statistically similar (P = 1). However, we observed that there is a minor difference
in the mean error between MLP-CSA and MLP-PSO for the four functional properties as shown in Tables 5, 6,
7 and 8, which confirms that MLP-CSA provides the best results for the prediction of functional properties of
nano TiO2 coated cotton fabric.
Conclusions
In this paper, we proposed a novel approach based on combination between artificial neural network and crow
search algorithm (MLP-CSA), where CSA has been used for the first time to improve the training process of MLP.
The proposed approach has been applied to predict the functional properties of nano TiO2 coated cotton. The
obtained results showed a higher prediction accuracy for the proposed MLP-CSA model compared to standard
MLP, MLP-PSO and MLP-GA. The computed values of RMSE and MAE from all predicted results confirm
Scientific Reports | (2021) 11:13649 | https://doi.org/10.1038/s41598-021-93108-9 7
Vol.:(0123456789)www.nature.com/scientificreports/
Results of synthesized and coated TiO2
1800
Nano TiO2 coated amount
1600
1400
1200
1000
800
600
400
200
0 5 10 15 20
Actual MLP-CSA MLP-PSO MLP-GA MLP
Results of self-cleaning efficiency
Self-Cleaning Efficiency (ΔE)
100
95
90
85
80
75
70
65
60
0 5 10 15 20
Actual MLP-CSA MLP-PSO MLP-GA MLP
Results of antimicrobial efficiency
Antimicrobial Efficiency (%)
110
100
90
80
70
60
50
0 5 10 15 20
Actual MLP-CSA MLP-PSO MLP-GA MLP
Results of UPF efficiency
70
60
UPF Efficiency
50
40
30
20
10
0 5 10 15 20
Actual MLP-CSA MLP-PSO MLP-GA MLP
Figure 3. Simulation results for the prediction of synthesized and coated T
iO2, self-cleaning efficiency,
antimicrobial efficiency, and UPF efficiency using MLP-CSA, MLP-PSO, and MLP-GA.
Scientific Reports | (2021) 11:13649 | https://doi.org/10.1038/s41598-021-93108-9 8
Vol:.(1234567890)www.nature.com/scientificreports/
Synthesized and coated TiO2 Self-Cleaning efficiency (ΔE)
Absolute prediction error
Absolute prediction error
400 6
4
200
2
0
0
1 2 3 4 5 6 7 8 9 10 11 12 13 14 15 16 17 18 19 20
1 2 3 4 5 6 7 8 9 10 11 12 13 14 15 16 17 18 19 20
MLP-CSA MLP-PSO MLP-GA MLP MLP-CSA MLP-PSO MLP-GA MLP
Antimicrobial efficiency (%) UPF efficiency
Absolute prediction error
Absolute prediction error
15 30
10 20
5 10
0 0
1 2 3 4 5 6 7 8 9 10 11 12 13 14 15 16 17 18 19 20 1 2 3 4 5 6 7 8 9 10 11 12 13 14 15 16 17 18 19 20
MLP-CSA MLP-PSO MLP-GA MLP MLP-CSA MLP-PSO MLP-GA MLP
Figure 4. Absolute errors between predicted and actual values using MLP, MLP-CSA, MLP-PSO and MLP-GA.
MSE of synthesized and coated TiO2 MSE of self-cleaning efficiency
25
45
MLP-CSA MLP-GA MLP-PSO
40 MLP-CSA MLP-GA MLP-PSO
20
35
30
15
MSE
MSE
25
20 10
15
10 5
5
0
0
0 50 100 150 200 250 300 0 50 100 150 200 250 300
Iteration Iteration
MSE of antimicrobial efficiency MSE of UPF efficiency
30 70
MLP-CSA MLP-GA MLP-PSO
MLP-CSA MLP-GA MLP-PSO 60
25
50
20
MSE
MSE
40
15
30
10
20
5
10
0 0
0 50 100 150 200 250 300 0 50 100 150 200 250 300
Iteration Iteration
Figure 5. Performance MSE convergence characteristics for MLP-CSA, MLP-PSO and MLP-GA.
that the proposed MLP-CSA model has lower error and more statistically significant as compared to all three
other models. The successful utilization of the developed model reveals a non-linear relationship between the
selected parameters for the prediction of functional properties. The findings of this work highlight that MLP-CSA
approach can be effectively used for the prediction of other properties of nano coated fabrics.
Scientific Reports | (2021) 11:13649 | https://doi.org/10.1038/s41598-021-93108-9 9
Vol.:(0123456789)www.nature.com/scientificreports/
Training Testing
Functional properties Methods RMSE MAE R2 RMSE MAE R2
MLP-CSA 29.78 17.89 0.9913 30.41 18.47 0.9896
MLP-PSO 85.92 62.68 0.9334 86.78 63.40 0.9156
Synthesized and coated TiO2
MLP-GA 89.11 67.54 91.173 89.86 68.20 0.9020
MLP 101.47 80.49 0.8781 103.82 82.73 0.8732
MLP-CSA 0.78 0.49 0.9891 0.82 0.55 0.9876
MLP-PSO 2.42 1.56 0.8972 2.55 1.64 0.8810
Self-cleaning efficiency
MLP-GA 2.61 2.18 0.8683 2.80 2.30 0.8563
MLP 2.78 2.26 0.8622 2.85 2.35 0.8517
MLP-CSA 0.86 0.49 0.9582 0.95 0.54 0.95
MLP-PSO 3.29 2.58 0.8872 3.46 2.71 0.8853
Antimicrobial efficiency
MLP-GA 3.66 3.11 0.8634 3.87 3.25 0.8560
MLP 5.79 5.27 0.6703 5.90 5.34 0.6658
MLP-CSA 0.95 0.29 0.9959 1.04 0.36 0.9949
MLP-PSO 4.20 2.95 0.9173 4.38 3.08 0.9112
UPF efficiency
MLP-GA 4.87 3.72 0.8806 5.14 3.93 0.8775
MLP 7.82 4.41 0.6847 8.36 4.92 0.6766
Table 3. Errors of different approaches.
Functional properties Methods p value F value
MLP-CSA 2.05e−9 69.92
MLP-PSO 1.77e−8 52.06
Synthesized and coated TiO2 MLP-GA 4.15e−7 33.26
MLP 8.38e−7 29.99
Experimental 8.04e−6 21.20
MLP-CSA 4.76e−6 15.96
MLP-PSO 0.000074 14.67
Self-cleaning efficiency MLP-GA 0.0004 10.38
MLP 0.0011 8.79
Experimental 0.001 8.92
MLP-CSA 7.70e−8 42.39
MLP-PSO 2.85e−6 24.93
Antimicrobial efficiency MLP-GA 7.74e−6 21.33
MLP 6.82e−6 21.76
Experimental 2.65e−5 17.47
MLP-CSA 3.06e−6 24.65
MLP-PSO 7.07e−6 21.64
UPF efficiency MLP-GA 2.33e−5 17.86
MLP 0.000084 14.35
Experimental 0.00001 19.86
Table 4. Analysis report of the experimental values and the predicted values using MLP, MLP-CSA, MLP-PSO
and MLP-GA for functional properties of nano TiO2 coated cotton.
Algorithms Mean difference Std. error Sig.b Lower bound Upper bound
MLP-CSA & MLP-PSO 4.795 13.828 1.000 − 24.038 37.381
MLP-CSA & MLP-GA 8.671 15.509 .152 − 50.833 61.243
MLP-CSA & MLP 44.929* 19.035 .036 2.215 87.643
Table 5. Pairwise comparisons of all algorithms prediction error for the synthesized and coated T iO2. *The
mean difference is significant at the .05 level. b Adjustment for multiple comparisons: Bonferroni.
Scientific Reports | (2021) 11:13649 | https://doi.org/10.1038/s41598-021-93108-9 10
Vol:.(1234567890)www.nature.com/scientificreports/
Algorithms Mean difference Std. error Sig.b Lower bound Upper bound
MLP-CSA & MLP-PSO − .650 .362 .992 − 1.377 .676
MLP-CSA & MLP-GA − .706 .391 .398 − 1.773 .361
MLP-CSA & MLP 1.091 .451 .070 − .061 2.243
Table 6. Pairwise comparisons of all algorithms prediction error for the self-cleaning efficiency. *The mean
difference is significant at the .05 level. b Adjustment for multiple comparisons: Bonferroni.
Algorithms Mean difference Std. error Sig.b Lower bound Upper bound
MLP-CSA & MLP-PSO − .532 .375 1.000 − 1.732 .667
MLP-CSA & MLP-GA 2.179* .407 .018 1.076 3.281
MLP-CSA & MLP − 2.628* .773 .000 − 4.903 − .353
Table 7. Pairwise comparisons of all algorithms prediction error for the antimicrobial efficiency. *The mean
difference is significant at the .05 level. b Adjustment for multiple comparisons: Bonferroni.
Algorithms Mean difference Std. error Sig.b Lower bound Upper bound
MLP-CSA & MLP-PSO − .846 .568 1.000 − 2.679 .987
MLP-CSA & MLP-GA 2.728* .823 0.036 1.056 4.400
MLP-CSA & MLP − 1.831 1.729 .001 − 6.922 3.260
Table 8. Pairwise comparisons of all algorithms prediction error for the UPF efficiency. *The mean difference
is significant at the .05 level. b Adjustment for multiple comparisons: Bonferroni.
Received: 21 April 2021; Accepted: 21 June 2021
References
1. Singh, J., Juneja, S., Soni, R. & Bhattacharya, J. Sunlight mediated enhanced photocatalytic activity of TiO2 nanoparticles func-
tionalized CuO–Cu2O nanorods for removal of methylene blue and oxytetracycline hydrochloride. J. Colloid Interface Sci. 590,
60–71. https://doi.org/10.1016/j.jcis.2021.01.022 (2021).
2. Yu, H. et al. Thermal radiation shielded, high strength, fire resistant fiber/nanorod/aerogel composites fabricated by in-situ growth
of TiO2 nanorods for thermal insulation. Chem. Eng. J. 418, 129342. https://doi.org/10.1016/j.cej.2021.129342 (2021).
3. Shao, L., Cheng, S., Yang, Z., Xia, X. & Liu, Y. Nickel aluminum layered double hydroxide nanosheets grown on oxygen vacancy-
rich TiO2 nanobelts for enhanced photodegradation of an antibiotic. J. Photochem. Photobiol. A 411, 113209. https://doi.org/10.
1016/j.jphotochem.2021.113209 (2021).
4. Song, X. et al. Oxygen vacancies enable the visible light photoactivity of chromium-implanted T iO2 nanowires. J. Energy Chem.
55, 154–161. https://doi.org/10.1016/j.jechem.2020.07.013 (2021).
5. Zhang, W. et al. Black single-crystal T iO2 nanosheet array films with oxygen vacancy on 001 facets for boosting photocatalytic
CO2 reduction. J. Alloys Compd. 870, 159400. https://doi.org/10.1016/j.jallcom.2021.159400 (2021).
6. Ismail, N. J. et al. Hydrothermal synthesis of T iO2 nanoflower deposited on bauxite hollow fibre membrane for boosting photo-
catalysis of bisphenol a. J. Water Process Eng. 37, 101504. https://doi.org/10.1016/j.jwpe.2020.101504 (2020).
7. Noman, M. T. et al. Sonochemical synthesis of highly crystalline photocatalyst for industrial applications. Ultrasonics 83, 203–213.
https://doi.org/10.1016/j.ultras.2017.06.012 (2018).
8. Noman, M. T., Ashraf, M. A., Jamshaid, H. & Ali, A. A novel green stabilization of T iO2 nanoparticles onto cotton. Fibers Polym.
19, 2268–2277 (2018).
9. Noman, M. T., Ashraf, M. A. & Ali, A. Synthesis and applications of nano-TiO2: A review. Environ. Sci. Pollut. Res. 26, 3262–3291
(2018).
10. Ashraf, M., Wiener, J., Farooq, A., Šašková, J. & Noman, M. Development of maghemite glass fibre nanocomposite for adsorptive
removal of methylene blue. Fibers Polym. 19, 1735–1746 (2018).
11. Noman, M. T. & Petru, M. Effect of sonication and nano TiO2 on thermophysiological comfort properties of woven fabrics. ACS
Omega 5, 11481–11490. https://doi.org/10.1021/acsomega.0c00572 (2020).
12. Noman, M. T., Petru, M., Amor, N., Yang, T. & Mansoor, T. Thermophysiological comfort of sonochemically synthesized nano
TiO2 coated woven fabrics. Sci. Rep. 10, 1–12 (2020).
13. Noman, M. T. et al. In-situ development of highly photocatalytic multifunctional nanocomposites by ultrasonic acoustic method.
Ultrason. Sonochem. 40, 41–56. https://doi.org/10.1016/j.ultsonch.2017.06.026 (2018).
14. Amor, N., Noman, M. T. & Petru, M. Prediction of functional properties of nano T iO2 coated cotton composites by artificial neural
network. Sci. Rep.https://doi.org/10.1038/s41598-021-91733-y (2021).
15. Daniel, G. G. Artificial Neural Network 143 (Springer, Dordrecht, 2013).
16. Wang, Y., Yu, Y., Cao, S., Zhang, X. & Gao, S. A review of applications of artificial intelligent algorithms in wind farms. Artif. Intell.
Rev. 53, 3447–3500 (2019).
17. Behera, P., Noman, M. T. & Petru, M. Enhanced mechanical properties of eucalyptus-basalt-based hybrid-reinforced cement
composites. Polymershttps://doi.org/10.3390/polym12122837 (2020).
Scientific Reports | (2021) 11:13649 | https://doi.org/10.1038/s41598-021-93108-9 11
Vol.:(0123456789)www.nature.com/scientificreports/
18. Azeem, M., Noman, M. T., Wiener, J., Petru, M. & Louda, P. Structural design of efficient fog collectors: A review. Environ. Technol.
Innov. 20, 101169. https://doi.org/10.1016/j.eti.2020.101169 (2020).
19. Noman, M. T., Amor, N., Petru, M., Mahmood, A. & Kejzlar, P. Photocatalytic behaviour of zinc oxide nanostructures on surface
activation of polymeric fibres. Polymershttps://doi.org/10.3390/polym13081227 (2021).
20. Noman, M. T., Petru, M., Militký, J., Azeem, M. & Ashraf, M. A. One-pot sonochemical synthesis of ZnO nanoparticles for pho-
tocatalytic applications, modelling and optimization. Materials.https://doi.org/10.3390/ma13010014 (2020).
21. Malik, S. A., Farooq, A., Gereke, T. & Cherif, C. Prediction of blended yarn evenness and tensile properties by using artificial neural
network and multiple linear regression. Autex Res. J. 16, 43–50. https://doi.org/10.1515/aut-2015-0018 (2016).
22. Malik, S. A., Gereke, T., Farooq, A., Aibibu, D. & Cherif, C. Prediction of yarn crimp in PES multifilament woven barrier fabrics
using artificial neural network. J. Text. Inst. 109, 942–951 (2018).
23. Malik, S. A., Arain, R. A., Khatri, Z., Saleemi, S. & Cherif, C. Neural network modeling and principal component analysis of
antibacterial activity of chitosan/AgCl-TiO2 colloid treated cotton fabric. Fibers Polym. 16, 1142–1149. https://doi.org/10.1016/j.
expthermflusci.2013.06.006 (2015).
24. Almetwally, A. A., Idrees, H. M. & Hebeish, A. Predicting the tensile properties of cotton/spandex core-spun yarns using artificial
neural network and linear regression models. J. Text. Inst. 105, 1221–1229. https://doi.org/10.1080/00405000.2014.882043 (2014).
25. Farooq, A. et al. Predicting cotton fibre maturity by using artificial neural network. Autex Res. J. 18, 429–433 (2018).
26. Farooq, A., Irshad, F., Azeemi, R. & Iqbal, N. Prognosticating the shade change after softener application using artificial neural
networks. Autex Res. J.https://doi.org/10.2478/aut-2020-0019 (2020).
27. Furferi, R., Governi, L. & Volpe, Y. Modelling and simulation of an innovative fabric coating process using artificial neural networks.
Text. Res. J. 82, 1282–1294. https://doi.org/10.1177/0040517512436828 (2012).
28. Kanat, Z. E. & Özdil, N. Application of artificial neural network (ANN) for the prediction of thermal resistance of knitted fabrics
at different moisture content. J. Text. Inst. 109, 1247–1253. https://doi.org/10.1080/00405000.2017.1423003 (2018).
29. Erbil, Y., Babaarslan, O. & Ilhan, I. A comparative prediction for tensile properties of ternary blended open-end rotor yarns using
regression and neural network models. J. Text. Inst. 109, 560–568. https://doi.org/10.1080/00405000.2017.1361164 (2018).
30. Malik, S. A. et al. Analysis and prediction of air permeability of woven barrier fabrics with respect to material, fabric construction
and process parameters. Fibers Polym. 18, 2005–2017 (2017).
31. Gao, S. et al. Dendritic neuron model with effective learning algorithms for classification, approximation, and prediction. IEEE
Trans. Neural Netw. Learn. Syst. 30, 601–614. https://doi.org/10.1109/TNNLS.2018.2846646 (2019).
32. Wang, Y., Gao, S., Yu, Y., Cai, Z. & Wang, Z. A gravitational search algorithm with hierarchy and distributed framework. Knowl.-
Based Syst. 218, 106877. https://doi.org/10.1016/j.knosys.2021.106877 (2021).
33. Xiao, Q. et al. Prediction of pilling of polyester-cotton blended woven fabric using artificial neural network models. J. Eng. Fibers
Fabr.https://doi.org/10.1177/1558925019900152 (2020).
34. Hussain, T., Malik, Z. A., Arshad, Z. & Nazir, A. Comparison of artificial neural network and adaptive neuro-fuzzy inference system
for predicting the wrinkle recovery of woven fabrics. J. Text. Inst. 106, 934–938. https://doi.org/10.1080/00405000.2014.953790
(2015).
35. Dashti, M., Derhami, V. & Ekhtiyari, E. Yarn tenacity modeling using artificial neural networks and development of a decision
support system based on genetic algorithms. J. AI Data Min. 2, 73–78. https://doi.org/10.22044/jadm.2014.187 (2014).
36. Majumdar, A., Das, A., Hatua, P. & Ghosh, A. Optimization of woven fabric parameters for ultraviolet radiation protection and
comfort using artificial neural network and genetic algorithm. Neural Comput. Appl. 27, 2567–2576. https://doi.org/10.1007/
s00521-015-2025-6 (2016).
37. Ni, C. et al. Online sorting of the film on cotton based on deep learning and hyperspectral imaging. IEEE Access 8, 93028–93038
(2020).
38. Lazzús, J. A. Neural network-particle swarm modeling to predict thermal properties. Math. Comput. Model. 57, 2408–2418. https://
doi.o
rg/1 0.1 016/j.m
cm.2 012.0 1.0 03 (2013) (System Dynamics in Project Management & Applied Mathematics and Computational
Science and Engineering—Selected Papers of the Seventh PanAmerican Workshop—June 6–11 2010, Venezuela).
39. Askarzadeh, A. A novel metaheuristic method for solving constrained engineering optimization problems: Crow search algorithm.
Comput. Struct. 169, 1–12 (2016).
40. Wang, Z., Di Massimo, C., Tham, M. T. & Julian Morris, A. A procedure for determining the topology of multilayer feedforward
neural networks. Neural Netw. 7, 291–300. https://doi.org/10.1016/0893-6080(94)90023-X (1994).
41. Kalantary, S., Jahani, A. & Jahani, R. MLR and ANN approaches for prediction of synthetic/natural nanofibers diameter in the
environmental and medical applications. Sci. Rep. 10, 1–10 (2020).
42. Jeon, J. H., Yang, S. S. & Kang, Y. J. Estimation of sound absorption coefficient of layered fibrous material using artificial neural
networks. Appl. Acoust. 169, 107476. https://doi.org/10.1016/j.apacoust.2020.107476 (2020).
43. Doran, E. C. & Sahin, C. The prediction of quality characteristics of cotton/elastane core yarn using artificial neural networks and
support vector machines. Text. Res. J. 90, 1558–1580. https://doi.org/10.1177/0040517519896761 (2020).
44. Jain, A. . K., Jianchang, Mao & Mohiuddin, K. . M. Artificial neural networks: A tutorial. Computer 29, 31–44. https://doi.org/10.
1109/2.485891 (1996).
45. Golnaraghi, S., Zangenehmadar, Z., Moselhi, O. & Alkass, S. Application of artificial neural network(s) in predicting formwork
labour productivity. Adv. Civ. Eng. 2019, 1–11 (2019).
46. Ecer, F., Ardabili, S., Band, S. S. & Mosavi, A. Training multilayer perceptron with genetic algorithms and particle swarm optimiza-
tion for modeling stock price index prediction. Entropy.https://doi.org/10.3390/e22111239 (2020).
47. Ansari, A., Ahmad, I. S., Bakar, A. A. & Yaakub, M. R. A hybrid metaheuristic method in training artificial neural network for
bankruptcy prediction. IEEE Access 8, 176640–176650. https://doi.org/10.1109/ACCESS.2020.3026529 (2020).
48. Ram Jethmalani, C. H., Simon, S. P., Sundareswaran, K., Nayak, P. S. R. & Padhy, N. P. Auxiliary hybrid PSO-BPNN-based trans-
mission system loss estimation in generation scheduling. IEEE Trans. Ind. Inf. 13, 1692–1703. https://doi.org/10.1109/TII.2016.
2614659 (2017).
49. Das, S., Ghosh, A., Majumdar, A. & Banerjee, D. Yarn engineering using hybrid artificial neural network-genetic algorithm model.
Fibers Polym. 14, 1220–1226 (2013).
50. Meddeb, A., Amor, N., Abbes, M. & Chebbi, S. A novel approach based on crow search algorithm for solving reactive power
dispatch problem. Energies.https://doi.org/10.3390/en11123321 (2018).
51. Pianosi, F. et al. Sensitivity analysis of environmental models: A systematic review with practical workflow. Environ. Model. Softw.
79, 214–232 (2016).
52. Noman, M. T. & Petru, M. Functional properties of sonochemically synthesized zinc oxide nanoparticles and cotton composites.
Nanomaterials.https://doi.org/10.3390/nano10091661 (2020).
53. Noman, M. T., Amor, N. & Petru, M. Synthesis and applications of ZnO nanostructures (ZONSs): A review. Crit. Rev. Solid State
Mater. Sci. 2, 1–44. https://doi.org/10.1080/10408436.2021.1886041 (2021).
54. Noman, M. T., Petru, M., Amor, N. & Louda, P. Thermophysiological comfort of zinc oxide nanoparticles coated woven fabrics.
Sci. Rep. 10, 1–12 (2020).
55. Stevens, J. P. & Pituch, K. A. Applied Multivariate Statistics for the Social Sciences: Analyses with SAS and IBM’s SPSS 6th edn.
(Routledge, 2015).
Scientific Reports | (2021) 11:13649 | https://doi.org/10.1038/s41598-021-93108-9 12
Vol:.(1234567890)www.nature.com/scientificreports/
Author contributions
N.A. and M.T.N. conceived, designed and performed experiments; analysed the results and wrote manuscript.
A.M. and A.I. performed experiments and analysed the results. M.P. analyzed the results, supervised and acquired
funding. All of the authors participated in critical analysis and preparation of the manuscript.
Funding
This work was supported by the Ministry of Education, Youth and Sports of the Czech Republic and the Euro-
pean Union (European Structural and Investment Funds—Operational Programme Research, Development and
Education) in the frames of the project “Modular platform for autonomous chassis of specialized electric vehicles
for freight and equipment transportation”, Reg. No. CZ.02.1.01/0.0/0.0/16_025/0007293.
Competing interests
The authors declare no competing interests.
Additional information
Correspondence and requests for materials should be addressed to M.T.N.
Reprints and permissions information is available at www.nature.com/reprints.
Publisher’s note Springer Nature remains neutral with regard to jurisdictional claims in published maps and
institutional affiliations.
Open Access This article is licensed under a Creative Commons Attribution 4.0 International
License, which permits use, sharing, adaptation, distribution and reproduction in any medium or
format, as long as you give appropriate credit to the original author(s) and the source, provide a link to the
Creative Commons licence, and indicate if changes were made. The images or other third party material in this
article are included in the article’s Creative Commons licence, unless indicated otherwise in a credit line to the
material. If material is not included in the article’s Creative Commons licence and your intended use is not
permitted by statutory regulation or exceeds the permitted use, you will need to obtain permission directly from
the copyright holder. To view a copy of this licence, visit http://creativecommons.org/licenses/by/4.0/.
© The Author(s) 2021
Scientific Reports | (2021) 11:13649 | https://doi.org/10.1038/s41598-021-93108-9 13
Vol.:(0123456789)You can also read