Understanding E-Scooter Incidents Patterns in Street Network Perspective: A Case Study of Travis County, Texas
←
→
Page content transcription
If your browser does not render page correctly, please read the page content below
sustainability

Article
Understanding E-Scooter Incidents Patterns in Street Network
Perspective: A Case Study of Travis County, Texas
Junfeng Jiao             , Shunhua Bai        and Seung Jun Choi *

                                          Urban Information Lab., The School of Architecture, The University of Texas at Austin, Austin, TX 78705, USA;
                                          jjiao@austin.utexas.edu (J.J.); shunhua@utexas.edu (S.B.)
                                          * Correspondence: jun.choi@utexas.edu

                                          Abstract: Dockless electric scooter (E-scooters) services have emerged in the United States as an
                                          alternative form of micro transit in the past few years. With the increasing popularity of E-scooters,
                                          it is important for cities to manage their usage to create and maintain safe urban environments.
                                          However, E-scooter safety in U.S. urban environments remains unexplored due to the lack of traffic
                                          and crash data related to E-scooters. Our study objective is to better understand E-scooter crashes
                                          from a street network perspective. New parcel level street network data are obtained from Zillow
                                          and curated in Geographic Information System (GIS). We conducted local Moran’s I and independent
                                          Z-test to compare where and how the street network that involves E-scooter crash differs spatially
                                          with traffic incidents. The analysis results show that there is a spatial correlation between E-scooter
                                          crashes and traffic incidents. Nevertheless, E-scooter crashes do not fully replicate characteristics of
                                          traffic incidents. Compared to traffic incidents, E-scooter incidents tend to occur adjacent to traffic
                                          signals and on primary roads.


                                          Keywords: e-scooter safety; micro-mobility; street network
Citation: Jiao, J.; Bai, S.; Choi, S.J.
Understanding E-Scooter Incidents
Patterns in Street Network
Perspective: A Case Study of Travis
                                          1. Introduction
County, Texas. Sustainability 2021, 13,
10583. https://doi.org/10.3390/
                                                Shared micro-mobility has rapidly increased in popularity as an alternative trans-
su131910583                               portation mode in the United States [1–3]. Shared micro-mobility is a user-oriented trans-
                                          portation mode that is easily accessible [4]. Types of shared micro-mobility services include
Academic Editor: Susan Shaheen            station-based bike-sharing, dockless bike-sharing, and E-scooter sharing. E-scooter services
                                          have emerged as a commonly used micro-mobility mode in cities [2,5–7]. The first E-scooter
Received: 15 August 2021                  sharing program was launched in the U.S. in September 2017 [8]. E-scooter services have
Accepted: 22 September 2021               become one of the most popular non-automotive alternatives for people to travel short
Published: 24 September 2021              distances in urban downtowns and universities [3,9].
                                                COVID-19 has brought new safety concerns and challenges that impact traditional
Publisher’s Note: MDPI stays neutral      travel safety measures and practices. For instance, drastic increases of reported COVID-
with regard to jurisdictional claims in   19 cases caused people to avoid public transportation to prevent viral transmission [10].
published maps and institutional affil-   The unprecedented threat of COVID-19 stimulated favorable opinion of micro-mobility
iations.                                  usage for traveling during the pandemic [11]. Similarly, Teixeira and Lopes found public
                                          transportation users utilized micro-mobility options to reduce their health risks [12]. Micro-
                                          mobility allows users to access their desired destinations while maintaining social distance
                                          from other users and people. As more users are willing to use micro-mobility, micro-
Copyright: © 2021 by the authors.         mobility will gain greater public attention as an alternative transportation mode post-
Licensee MDPI, Basel, Switzerland.        pandemic. It is imperative for transportation planners and researchers to continuously
This article is an open access article    and actively scrutinize different aspects of shared micro-mobility programs such as travel
distributed under the terms and           behaviors and public safety.
conditions of the Creative Commons              In contrast to the amount of shared micro-mobility research on travel behaviors, there
Attribution (CC BY) license (https://     is scarce literature on E-scooter safety due to the lack of data. Although researchers have
creativecommons.org/licenses/by/          used survey-based methods [13] and data mining techniques [2] to identify scooter-related
4.0/).

Sustainability 2021, 13, 10583. https://doi.org/10.3390/su131910583                                    https://www.mdpi.com/journal/sustainability
Sustainability 2021, 13, 10583                                                                                              2 of 13

                                 injuries and crashes, it is difficult for planners to contextualize the safety issues without
                                 sufficient empirical evidence.
                                      Past research regarding E-scooters and dockless mobility has identified the usage and
                                 travel patterns of E-scooter users [5,9,14] and characteristics of E-scooter user injuries [6,15].
                                 Shah et al. proved that E-scooter crash characteristics do not fully replicate the features of
                                 other shared micro-mobility crashes [7]. E-scooter users experience more severe vibration
                                 events than bike riding in the event of a crash [6]. However, these studies did not incor-
                                 porate street networks in their analysis and instead focused on E-scooter ridership rather
                                 than E-scooter associated injuries. Street networks are the imperative urban component
                                 associated with transportation crashes and road safety in cities [16,17]. Understanding
                                 E-scooter associated injuries or crashes from a street network perspective remains a vital
                                 task in order to accurately apprehend the characteristics of E-scooter crashes.

                                 2. Literature Review
                                       Dockless electric scooter (E-scooters) services have emerged in the United States as an
                                 alternative form of micro transit in the past few years as they allow users to travel short
                                 distances quickly [3]. Due to the increasing prominence of micro-mobility in the United
                                 States, E-scooters have emerged as a new micro-mobility mode to fulfill increasing short
                                 distance and last mile travel demand [6]. E-scooter services are a single user-oriented
                                 micro-mobility option that can support and benefit other transportation modes, such as rail
                                 and bus [5]. Other benefits of riding E-scooters include reduced greenhouse gas emissions
                                 and automobile congestion [1]. Nevertheless, there is still no universal consensus on how
                                 to manage E-scooter services in urban environments.
                                       E-scooter services are primarily utilized for recreational purposes [13]. In Austin, TX,
                                 our spatial analysis showed that E-scooter usage is concentrated in the downtown and
                                 university campus areas [9]. In addition, greater accessibility, land-use composition, and
                                 proximity to the city center were positively correlated with higher E-scooter ridership [9].
                                       E-scooter associated injuries are believed to be more serious for users and increase the
                                 burden of emergency rooms and other ER related health services [13]. Another problem
                                 with E-scooter-associated injuries is that E-scooter crashes cause injuries to E-scooter riders
                                 and threaten adjacent street users. Due to the compact size of an E-scooter, E-scooter riders
                                 can freely utilize pedestrian streets, and pavements, which result in tensions with and
                                 risks to pedestrians [5]. When E-scooters were first introduced, the media did not give
                                 full attention to E-scooter-associated injuries. However, reports of E-scooter fatalities and
                                 crashes have increased [1].
                                       In 2018, Austin Public Health conducted research to identify the characteristics of
                                 E-scooter-related injuries. Among 190 surveyed users, nearly half (48%) had injuries. 70%
                                 of injured users had upper limb injuries, such as the shoulder, arm, wrist, and hands, and
                                 55% of injured users had injuries in the lower limbs. One-third of injured riders experienced
                                 bone fractures. The results are plausible because the rate of protective gear usage is low
                                 among E-scooter riders [13].
                                       E-scooter crashes do not equal other transportation mode crashes [7]. In addition,
                                 higher travel speed is likely associated with E-scooter injuries of greater severity [15].
                                 Injuries commonly occurred on the sidewalk or roads, and riders injured on roadways
                                 are twice as likely to sustain severe injury than those injured elsewhere [15]. In addition,
                                 E-scooter injuries in Austin suggest that E-scooter related injuries tend to occur more often
                                 on the weekend than on weekdays and during working hours, between 9 a.m. and 11 a.m.
                                 and from 1 p.m. to 4 p.m. [18].
                                       While there are extensive datasets on motor vehicle crashes in the U.S., there are
                                 no public E-scooter crash datasets as of this study, making it difficult to run in-depth
                                 analytics [2,6,13]. Therefore, the present study’s findings do not provide decisive findings
                                 concerning E-scooter crashes or injuries. However, it suggests a new research framework
                                 to better understand E-scooter injuries and crashes from a street network perspective.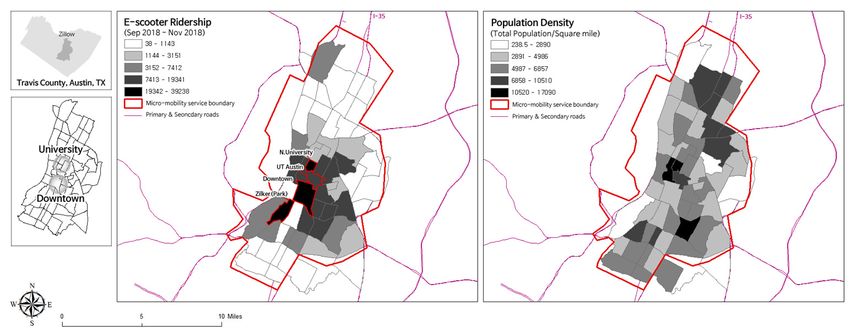
Sustainability 2021, 13, x FOR PEER REVIEW 3 of 13
Sustainability 2021, 13, 10583 3 of 13
The present study contributes to filling the research gap of past studies by identifying
The present study
the characteristics contributes
of E-scooter to filling
incidents in a the research
street networkgap of past studies
perspective, by identify-
confirming pre-
ing the
vious characteristics
E-scooter of E-scooter
travel patterns, andincidents in a street
understanding network perspective,
the difference confirming
between E-scooter inci-
previous
dents E-scooter
compared travel vehicle
to motor patterns, andincidents.
crash understanding the difference between E-scooter
incidents compared to motor vehicle crash incidents.
3. Materials and Methods
3. Materials and Methods
3.1. Study Area
3.1. Study Area
The study area is Travis County, Austin, TX, USA. Zillow neighborhood is the geo-
The study area is Travis County, Austin, TX, USA. Zillow neighborhood is the ge-
graphical unit used for the analysis. There are 61 Zillow neighborhoods. Zillow is a well-
ographical unit used for the analysis. There are 61 Zillow neighborhoods. Zillow is a
known real estate market platform in the U.S. that offers sales and listings of properties
well-known real estate market platform in the U.S. that offers sales and listings of prop-
with thorough comparisons. Contrary to census boundaries such as Census Tracts, Zillow
erties with thorough comparisons. Contrary to census boundaries such as Census Tracts,
publicized their neighborhood boundaries experienced by local housing markets, ena-
Zillow publicized their neighborhood boundaries experienced by local housing markets,
bling a new local perspective analysis. Therefore, Zillow neighborhood boundaries do not
enabling a new local perspective analysis. Therefore, Zillow neighborhood boundaries do
fully agree
not fully withwith
agree Census-based
Census-basedgeographies.
geographies.
By
By using Zillow-defined neighborhoods,
using Zillow-defined neighborhoods, we we can
can distinguish
distinguish areas with different
areas with different
characters by their neighborhood names. For instance, North University
characters by their neighborhood names. For instance, North University and UT-Austin and UT-Austin
in
in Figure
Figure 11 are two separated
are two separated neighborhoods
neighborhoods in in one
one Census
Census Tract, where the
Tract, where the former
former isis
mainly
mainly for
for student
student housing.
housing. The
The latter
latter is
is the
the main
main campus.
campus. Generally,
Generally, it goes within
it goes within the
the
micro-mobility service boundary in the City of Austin (COA). Based on
micro-mobility service boundary in the City of Austin (COA). Based on the record from the record from
COA
COA during
during the
the study
study period
period [19],
[19], compared
compared to to population
population density,
density, there
there is relatively
is relatively
greater
greater E-scooter ridership in downtown, park, and university neighborhoods than other
E-scooter ridership in downtown, park, and university neighborhoods than other
service
service areas.
areas.
Figure 1. Study
Study area.
area.
3.2. Data
3.2. Data
The present
The present study
study analyzed
analyzedAustin,
Austin,Texas,
Texas,USA.
USA.TheThestudy
studyperiod
period was
was from September
from Septem-
ber to November 2018, which consists of a total of 90 days. The research objective was
to November 2018, which consists of a total of 90 days. The research objective was to
to
understand the E-scooter incident from a street network perspective and its
understand the E-scooter incident from a street network perspective and its occurrence. occurrence.
E-scooter crash
E-scooter crashdata
datawere
wereobtained
obtainedfrom
fromPatch, an American
Patch, an American locallocal
newsnewsplatform with
platform
a spatial
with location
a spatial in Austin,
location TX, from
in Austin, September
TX, from to November
September to November2018 [20].
2018Patch obtained
[20]. Patch ob-
data from Austin–Travis County EMS data. They tracked a total of 166 E-scooter
tained data from Austin–Travis County EMS data. They tracked a total of 166 E-scooter crashes
and confirmed
crashes that 60 percent
and confirmed of scooter
that 60 percent accidents
of scooter occurred
accidents near downtown
occurred areas during
near downtown areas
the study period [20]. The dataset offers location information of an accident, including
during the study period [20]. The dataset offers location information of an accident, in-
longitude and latitude, and other information such as contact data, gender of the E-scooter
cluding longitude and latitude, and other information such as contact data, gender of the
user, injury description, and hospital information. We web scrawled the E-scooter crash
E-scooter user, injury description, and hospital information. We web scrawled the E-
map publicized by Patch each by each. The scrawled E-scooter crash with individual
scooter crash map publicized by Patch each by each. The scrawled E-scooter crash with
longitude and latitude were imported in GIS. We assumed the E-scooter crash outside the
individual longitude and latitude were imported in GIS. We assumed the E-scooter crash
E-scooter service boundary as outliers and removed them. As a result, from 166 E-scooter
outside the E-scooter service boundary as outliers and removed them. As a result, from
crash records from Patch, a total of 156 E-scooter crash records were used.
166 E-scooter crash records from Patch, a total of 156 E-scooter crash records were used.
Besides E-scooter accidents, we collected land use and built environment data, traffic
Besides E-scooter accidents, we collected land use and built environment data, traffic
incidents, and E-scooter ridership data during the same period from the COA website to
incidents, and E-scooter ridership data during the same period from the COA website to
examine if E-scooter accidents were observed where traffic accidents frequently happened.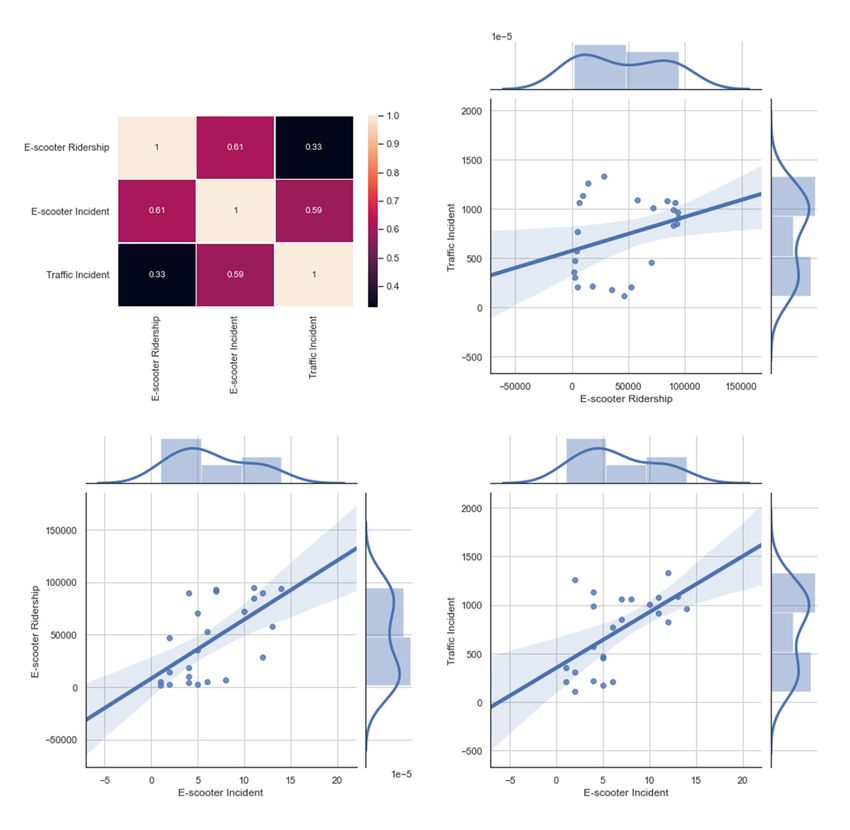
Sustainability 2021, 13, 10583                                                                                          4 of 13

                                 Land use and built environment are based on Land Use Inventory Map publicized by COA.
                                 It contains land use ratio of single-family, mobile homes, duplexes, apartments, commercial,
                                 mixed-use, office, manufacturing, warehousing, miscellaneous industrial, landfills, parks,
                                 cultural, transportation facilities, water, agricultural, undeveloped, and other zoning codes
                                 by each parcel. Using spatial join and overlay tools in GIS, we categorized the land use
                                 data into seven and summed up for each category per geographic unit of the study: resi-
                                 dential, commercial, office, industrial, public, open space, and transportation related land
                                 use. Residential land use includes single-family, mobile homes, sizeable lot-single family,
                                 three/fourplexes, and apartment/condo. Commercial land use includes commercial and
                                 mixed-use. Office land use only includes office. Industrial land use includes manufacturing,
                                 warehousing, and miscellaneous industrial land use. Public land use includes landfills,
                                 semi-institutional housing (housing for mentally and physically ill), government services,
                                 education, and cemetery. Open space land use includes parks/greenbelts and common
                                 acres. Lastly, transportation related land use includes railroad, aviation, transportation
                                 facilities, and streets and roads.
                                       Traffic incidents data offer address information with longitude and latitude. During
                                 the study period and within the study boundary, 7715 traffic incidents were reported.
                                 E-scooter ridership data is provided for each census tract that falls into the E-scooter
                                 service boundary in the City of Austin. It contains trip duration, distance, start time,
                                 and end time with a designated E-scooter ID. Due to the large set of datasets, we used
                                 Python Pandas to import the data and grouped them daily per tract and hourly per tract.
                                 During the study period, 1,067,298 E-scooter riderships were reported with an average trip
                                 duration of 12 min (11.60) for each E-scooter. An average of 191 traffic incidents and an
                                 average of 11,728 E-scooter riderships were reported daily. For spatial analysis, the tract
                                 was areal interpolated into the Zillow neighborhood boundary in GIS.
                                       Zillow, a real estate platform, provides geographic neighborhood boundary and
                                 street networks with nodes and edges. Zillow street network data include nodes and
                                 edges. There are 11,149 Street Nodes (SN) and 15,179 Street Edges (SE) within the study
                                 area. SN offers motorway junction, traffic signal, turning circle, and loop information.
                                 SE includes the type of street network, number of lanes, max-speed, name, length, and
                                 one-way information. However, several data had most of their information as N/A. For
                                 instance, only 1025 (7%) SE had max-speed information. Similarly, only 1579 SE (10%)
                                 includes several lanes. Therefore, this information was hardly included in the analysis.
                                       Figure 2 demonstrates the open-source data used in the present study. Kernel density
                                 results show that E-scooter incidents show similar greater density in downtown and near
                                 university neighborhoods as traffic incidents. Though kernel density of traffic incidents
                                 tends to follow the main road linked to downtown and university, it was most dense in the
                                 downtown neighborhood.
                                       Now with these data, we were able to fill the gaps of past research. Specifically, the
                                 present study explored E-scooter rider injuries from a street network perspective and
                                 identified characteristics of the street network associated with E-scooter injuries compared
                                 to motor crash ones. Moreover, we verified the past studies’ findings regarding E-scooter
                                 ridership and its travel patterns.
                                       Lastly, a two-sample independent Z-test was conducted to determine the statisti-
                                 cal difference between E-scooter incidents involving street networks and motor crashes
                                 involving ones.
                                       Table 1 summarizes variables used for independent Z-test and descriptive statistics of
                                 each variable. Land use and built environment, residential, commercial, office, industrial,
                                 public, open space, and transportation-related land use were collected. For street edges,
                                 length of the street, dummy of one-way, link, living street, motorway, primary, residential,
                                 secondary, territory, trunk, and unclassified road type were used. The type of street edge
                                 was provided in one single column as a nominal factor. Therefore, this information was
                                 assigned to individual dummies as a numeric variable. Regarding street nodes, a total
                                 number of nodes, such as motorway junction, traffic signal, turning circle, and stop sign,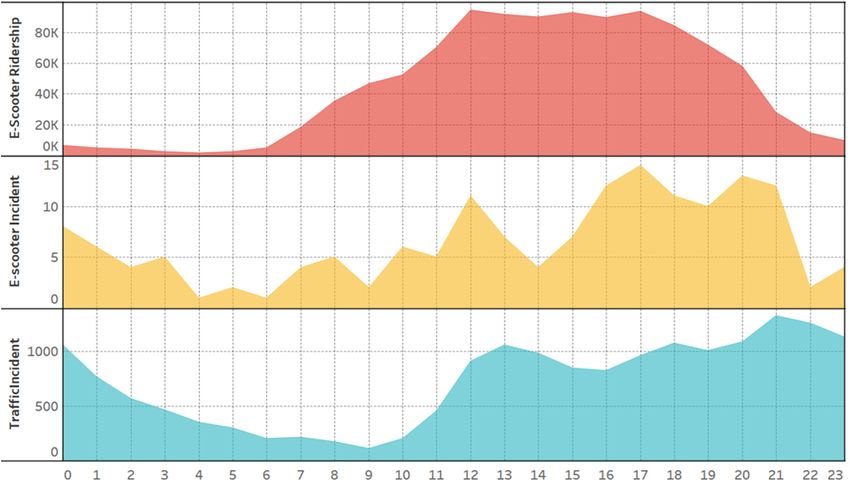
Sustainability 2021, 13, 10583                                                                                            5 of 13

                                     was used. Street nodes are a single dot that contains nominal factor which explains what
                                     the node refers to, such as motorway junction, traffic signal, tuning circle, and stop sign.
                                     Each node was reclassified by its types and encoded as numeric value one so that we could
                                     add up the number of motorway junctions, traffic signals, tuning circles, and stop signs
Sustainability 2021, 13, x FOR PEER REVIEW                                                                                5 of 13
                                     adjacent to crash data points. Therefore, the street nodes variables used in Z-test refer to
                                     the total number of nodes for each type inside the designated distance from the individual
                                     crash points.

                                              Figure 2. Collected open-source data.
                                              Figure 2. Collected open-source data.

                                       Lastly, a two-sample independent Z-test was conducted to determine the statistical
                                 difference between E-scooter incidents involving street networks and motor crashes in-
                                 volving ones.
                                       Table 1 summarizes variables used for independent Z-test and descriptive statistics
                                 of each variable. Land use and built environment, residential, commercial, office, indus-
                                 trial, public, open space, and transportation-related land use were collected. For street
                                 edges, length of the street, dummy of one-way, link, living street, motorway, primary,
                                 residential, secondary, territory, trunk, and unclassified road type were used. The type of
                                 street edge was provided in one single column as a nominal factor. Therefore, this infor-
                                 mation was assigned to individual dummies as a numeric variable. Regarding street
                                 nodes, a total number of nodes, such as motorway junction, traffic signal, turning circle,
                                 and stop sign, was used. Street nodes are a single dot that contains nominal factor which
                                 explains what the node refers to, such as motorway junction, traffic signal, tuning circle,
Sustainability 2021, 13, 10583 6 of 13
Table 1. Variables and descriptive statistics for Z-test.
Variable Unit Count Mean Std Min Max
Residential ratio 1566 0.432 0.286 0.000 0.916
Commercial ratio 1566 0.080 0.126 0.000 0.668
Office ratio 1566 0.041 0.094 0.000 1.000
Land Use and Built
Environment Industrial ratio 1566 0.033 0.101 0.000 0.807
(COA, 2012) Public ratio 1566 0.051 0.115 0.000 0.863
OpenSpace ratio 1566 0.033 0.087 0.000 0.827
Transportation
ratio 1566 0.011 0.040 0.000 0.443
Related
Length meter 1566 168.636 131.382 3.560 1015.575
One-way dummy * 1566 0.159 0.366 0.000 1.000
Link dummy * 1566 0.028 0.165 0.000 1.000
Living Street dummy * 1566 0.001 0.025 0.000 1.000
Motorway dummy * 1566 0.011 0.104 0.000 1.000
Street Edges
Primary dummy * 1566 0.050 0.218 0.000 1.000
(Zillow, 2017)
Residential dummy * 1566 0.538 0.499 0.000 1.000
Secondary dummy * 1566 0.205 0.404 0.000 1.000
Territory dummy * 1566 0.000 0.000 0.000 0.000
Trunk dummy * 1566 0.003 0.056 0.000 1.000
Unclassified dummy * 1566 0.010 0.101 0.000 1.000
Total Nodes count 1566 2.334 2.495 0.000 27.000
Motorway
count 1566 0.033 0.179 0.000 1.000
Street Nodes Junction
(Zillow, 2017) Traffic Signal count 1566 0.131 0.337 0.000 1.000
Turning Circle count 1566 0.050 0.219 0.000 1.000
Stop Sign count 1566 0.003 0.050 0.000 1.000
* Dummy compose 0 and 1.
3.3. Methods
The study phase goes through three stages. First, time series analysis has been
performed to reveal the travel pattern of E-scooter ridership, E-scooter incidents, and
traffic incidents throughout time. Here we also visualized correlation matrix using Python
libraries, including Matplotlib and Seaborn. Matplotlib and Seaborn are effective libraries
for visualizing data. Second, spatial autocorrelation (local Moran’s I) was used to identify
the spatial pattern of abovementioned three major variables.
Local Moran’s I is a tool that determines spatial cluster and outlier with statistical
significance, and it is only reliable when the input feature contains at least 30 features [21].
It is a useful tool to identify hotspots and relevant test statistics used for spatial data
analysis [21–23]. It calculates local Moran’s I value, a z-score, p-value, and a numeric
code refer to a type of cluster with statistical significance. The local Moran’s I follows the
equation below. The high positive local Moran’s I value implies the location has similar
values as its neighbors. On the other hand, high negative local Moran’s I value means the
location is containing distinct values and forms spatial outliers. In transportation accidentSustainability 2021, 13, 10583 7 of 13
research, local Moran’s I has been used to detect accident hot spots [24–27]. Table 2 discerns
a variable used in the analysis.
n
zi − z h i
Ii =
σ2 ∑ wij(z j −z)
j=1,j6=i
where zi : value of variable z at location i,
z: average value of z with the sample number of n,
z j : the value of the variable z with all the other location (where j 6= i),
σ2 : the variance of variable z,
wij : a weight which can be defined as the inverse of the distance between location i and j.
Weight can also be determined using a distance band: samples within a distance band
are given the same weight, while those outside the distance band are given the weight
of 0 [22].
Table 2. Variables used for time series analysis and spatial statistics.
Variable Unit Source Year
E-scooter Count Patch 2018
Crash
Traffic Incident Count COA 2018
Ridership E-scooter Count COA 2018
Study Period: September–November 2018
Third, a two-sample independent Z-test was conducted to determine the statistical
difference between E-scooter incidents involving street networks and motor crashes in-
volving ones. Street network refers to surrounding street edges, nodes, land use, and built
environment of each incident. Z-test statically tests means of samples and determines
significant differences between groups. It is best used when there are more than 30 sam-
ples, assuming that when there is a more significant number of samples the samples are
believed to be generally distributed under the central limit theorem. The Z-test equation is
described below.
XE − XT
Z= s (1)
2 2
SEXE SEXT
NE + NT
where XE : average of E-scooter injury associated street network,
XT : average of traffic incident associated street network,
SEXE : standard error E-scooter injury associated street network,
SEXT : standard error of traffic incident associated street network,
NE : number of E-scooter injury associated street network,
NT : number of traffic incident associated street network.
The unit of analysis for independent Z-test is a street network that only involves either
E-scooter incidents or motor crashes. To add incident information into the individual street
network, we had to use ArcGIS. Data curation goes through three steps: First, individual
crash records were geocoded using ArcMap 10.8. Second, crash records were spatially
merged to the overlapping street network. Third, around a 200 m buffer centered at
each traffic incident location was created to capture the number of adjacent street nodes’
information, built environment, and land use features and measure street edges. A round
buffer enables counting and measuring the density of built environment variables [28]. Two
hundred meters is a two-to-three-minute walking distance and best suited for preventing
the creation of outliers for our analysis.Sustainability 2021, 13, 10583 8 of 13
In total, 1566 street networks were used. A total of 149 street networks (10%) composed
E-scooter incidents and 1417 street networks (90%) were associated with traffic incidents.
For technological support, Stata 16, ArcMap 10.8, and Tableau Desktop were used.
ility 2021, 13, x FOR PEER REVIEW 4. Results 8 of 13
4.1. Time Series Analysis
The descriptive analysis of hourly patterns accumulated for the study period is shown
in Figure 3. It is the using
incidents, and traffic incidents result of hourlyPandas.
Python grouped E-scooter
and summed up E-scooter
ridership ridership,
gradually in- incidents,
and traffic incidents using Python Pandas. E-scooter ridership
creases from 6 a.m., hits its peak during the afternoon (12 p.m. to 5 p.m.), and incremen- gradually increases from
6 a.m., hits its peak during the afternoon (12 p.m. to 5 p.m.), and incrementally decreases
tally decreases at nighttime (after 5 p.m.). Traffic incidents gradually accumulated starting
at nighttime (after 5 p.m.). Traffic incidents gradually accumulated starting from 9 a.m.
from 9 a.m. and hit their peak at 9 p.m. However, contrary to E-scooter ridership, greater
and hit their peak at 9 p.m. However, contrary to E-scooter ridership, greater cases of
cases of traffictraffic
incidents were reported even in evening hours. E-scooter incidents tend to
incidents were reported even in evening hours. E-scooter incidents tend to take
take place more during the
place more during afternoon or night
the afternoon orhours than morning
night hours than morningor evening hours.
or evening TheThe lowest
hours.
lowest E-scooter ridership is reported at 4 a.m. (1482 E-scooter ridership) and at its
E-scooter ridership is reported at 4 a.m. (1482 E-scooter ridership) and at its highest at highest
at 12 p.m. (94,552 E-scooter
12 p.m. (94,552ridership). The ridership
E-scooter ridership). The at 12 p.m. at
ridership is 12
nearly
p.m.64 is times
nearlygreater
64 times greater
than 4 a.m. The highest
than 4 a.m.E-scooter
The highest incident wasincident
E-scooter reportedwas at 5reported
p.m. (14atE-scooter
5 p.m. (14incidents),
E-scooter incidents),
and lowest at 4and a.m. and 6ata.m.
lowest (1 and
4 a.m. E-scooter
6 a.m. incident).
(1 E-scooter Traffic incidents
incident). Trafficoccurred
incidentsthe most the most
occurred
at 9 p.m. (1329attraffic
9 p.m.incidents) andincidents)
(1329 traffic lowest atand9 a.m. (113attraffic
lowest 9 a.m.incidents).
(113 trafficTraffic incidents
incidents). Traffic incidents
at 9 p.m.
at 9 p.m. are nearly are nearly
12 times higher12 times
than 12higher than 12 h before.
h before.
Figure 3. Figure 3. Hourly
Hourly pattern pattern of E-scooter
of E-scooter ridership
ridership and incidents
and incidents in Austin,
in Austin, TX,TX, between
between 1 Septem- 2018 and
1 September
ber 2018
30 November 2018. and 30 November 2018.
Figure
Figure 4 describes the4 describes
correlationthematrix
correlation matrix
of hourly of hourly
grouped groupedridership,
E-scooter E-scooter inci-
ridership, inci-
dents, and traffic incidents. E-scooter incident shows a moderate positive
dents, and traffic incidents. E-scooter incident shows a moderate positive correlation with correlation with
E-scooter ridership and traffic incidents of correlation value of 0.61 and
E-scooter ridership and traffic incidents of correlation value of 0.61 and 0.59, respectively. 0.59, respectively.
Traffic
Traffic incidents incidents
showed a weakshowed a weak
positive positivewith
correlation correlation withridership
E-scooter E-scooterwith
ridership
a cor-with a cor-
relation value of 0.33. The slope of traffic incidents and E-scooter ridership is lower than
relation value of 0.33. The slope of traffic incidents and E-scooter ridership is lower than
the slope calculated by E-scooter incidents with its ridership and E-scooter incidents with
the slope calculated by E-scooter incidents with its ridership and E-scooter incidents with
traffic incidents.
traffic incidents.Sustainability 2021, 13, x FOR PEER REVIEW 9 of 13
Sustainability 2021, 13, 10583 9 of 13
Figure 4. Correlation matrix of E-scooter ridership, E-scooter incident, and traffic incident.
Figure 4. Correlation matrix of E-scooter ridership, E-scooter incident, and traffic incident.
4.2. Local Moran’s I Result
4.2. Local Moran’s
Figure I Resultthe result of the local Moran’s I analysis. Local Moran’s I determines
5 describes
where spatial
Figure clusters the
5 describes andresult
outliers are local
of the located, whether
Moran’s high orLocal
I analysis. low in values.I deter-
Moran’s Spatial
clusters
mines include
where high-high
spatial clustersclusters with are
and outliers high-value
located, neighborhoods
whether high orandlowlow-low clusters
in values. Spa-
with
tial
Sustainability 2021, 13, x FOR PEER REVIEW low-value
clusters neighborhoods.
include Similarly,
high-high clusters withspatial outliers
high-value include high-low
neighborhoods and low-high.
and low-low 10 clus-
of 13
Thewith
ters former refers to
low-value a low-value neighborhood
neighborhoods. with outliers
Similarly, spatial a high-value outlier.
include The latter
high-low type
and low-
indicates high-value neighborhoods with a low-value outlier [29].
high. The former refers to a low-value neighborhood with a high-value outlier. The latter
type indicates high-value neighborhoods with a low-value outlier [29].
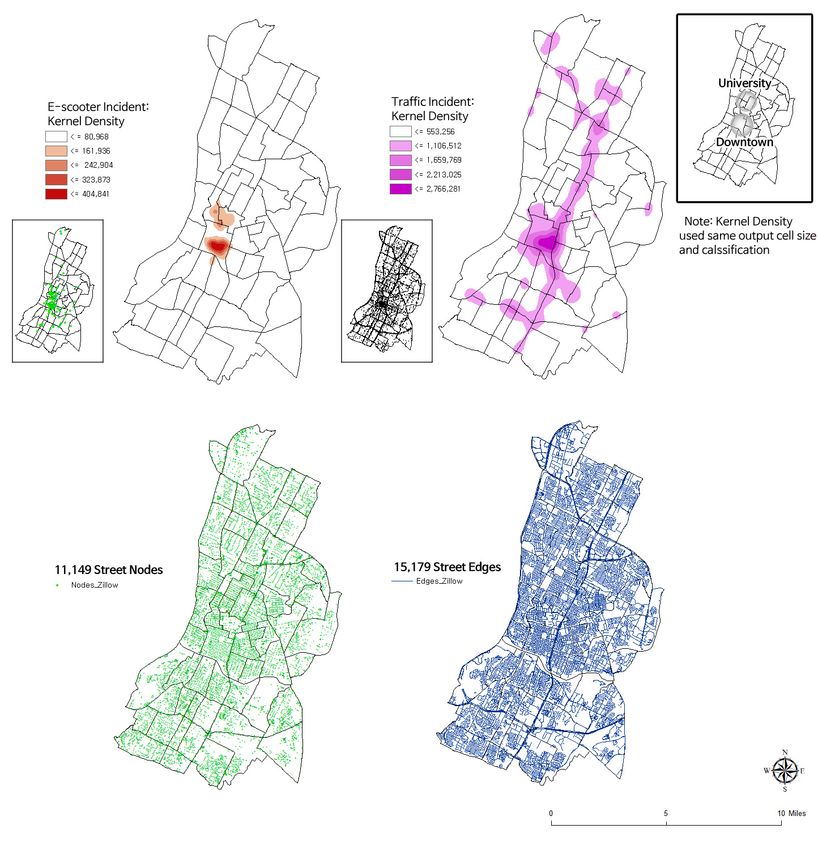
The result shows that spatial correlation exists between E-scooter ridership, E-scooter
incidents, and traffic incidents by forming high-high and low-low clusters with statistical
significance. Specifically, a high degree of clustering happens near the university neigh-
borhood (West University, North University, UT Austin, Hancock, Upper Boggy Creek)
and downtown areas (Central East Austin, East Cesar Chavez, Holly). Both northern and
southern neighborhoods show a lower degree of clusters. E-Scooter incidents show a
higher degree of clusters near downtown (Downtown, East Cesar Chavez, Bouldin) and
the university neighborhood (West University, UT Austin), and a lower degree of the clus-
ter was shown in the northern-central neighborhood. Traffic incidents show a high degree
of the cluster in the downtown neighborhood (East Cesar Chavez) and part of the north-
ern neighborhood (Gateway). East Cesar Chavez, a downtown neighborhood, has high
degrees of E-scooter ridership, E-scooter incidents, and traffic incidents, which explains
the spatial correlation between variables.
LocalMoran’s
Figure5.5.Local
Figure Moran’sI result
I resultofofE-scooter
E-scooterridership,
ridership,E-scooter
E-scooterincident,
incident,and
andtraffic
trafficincident
incidentinin
Austin, TX, between 1 September 2018 and 30 November
Austin, TX, between 1 September 2018 and 30 November 2018. 2018.
The resultZ-Test
4.3. Independent showsResult
that spatial correlation exists between E-scooter ridership, E-scooter
incidents, and traffic incidents by forming high-high and low-low clusters with statistical
Previous spatial
significance. statistics
Specifically, analysis
a high shows
degree spatial similarity
of clustering happensand dissimilarity
near between
the university neigh-
E-scooter
borhood (West University, North University, UT Austin, Hancock, Upper BoggyZ-tests
incidents and traffic incidents in different neighborhoods. We conducted Creek)
to identify how land use, built environment, and street characteristics correlate with these
incidents. A total of 1,566 street networks were used for the Z-tests. Results show that 149
street networks (10%) were associated with E-scooter incidents and 1,417 street networks
(90%) related to traffic incidents. The Z-test result is described in Table 3. The result showsSustainability 2021, 13, 10583 10 of 13
and downtown areas (Central East Austin, East Cesar Chavez, Holly). Both northern
and southern neighborhoods show a lower degree of clusters. E-Scooter incidents show a
higher degree of clusters near downtown (Downtown, East Cesar Chavez, Bouldin) and the
university neighborhood (West University, UT Austin), and a lower degree of the cluster
was shown in the northern-central neighborhood. Traffic incidents show a high degree of
the cluster in the downtown neighborhood (East Cesar Chavez) and part of the northern
neighborhood (Gateway). East Cesar Chavez, a downtown neighborhood, has high degrees
of E-scooter ridership, E-scooter incidents, and traffic incidents, which explains the spatial
correlation between variables.
4.3. Independent Z-Test Result
Previous spatial statistics analysis shows spatial similarity and dissimilarity between
E-scooter incidents and traffic incidents in different neighborhoods. We conducted Z-
tests to identify how land use, built environment, and street characteristics correlate with
these incidents. A total of 1566 street networks were used for the Z-tests. Results show
that 149 street networks (10%) were associated with E-scooter incidents and 1417 street
networks (90%) related to traffic incidents. The Z-test result is described in Table 3. The
result shows a statically significant difference between the physical environment of E-
scooter incidents and traffic accidents. Adjacent residential land use (p < 0.01), length of
the street (p < 0.001), primary street type (p < 0.05), residential street type (p < 0.01), the
total number of street nodes (p < 0.001), and a total number of traffic signals (p < 0.001)
were statistically significantly different.
Table 3. Z-test result.
Variable Z p
Residential −2.5842 0.0098 **
Commercial 0.5699 0.5687
Office 0.8311 0.4059
Land Use and
Built Environment Industrial −0.1635 0.8701
Public 0.6657 0.5056
OpenSpace 0.1480 0.8824
Transportation
0.5043 0.6140
Related
Length −1.60 × 10² 0.0000 ***
One-way 1.5768 0.1148
Link 0.0701 0.9441
Living Street 0.0779 0.9379
Motorway 0.0329 0.9737
Street Edges Primary 2.1168 0.0343 *
Residential −2.9462 0.0032 **
Secondary 0.1256 0.9001
Territory 0.0000 1.0000
Trunk −0.041 0.9673
Unclassified 0.4718 0.6371
Total Nodes 17.4173 0.0000 ***
Motorway Junction 0.0906 0.9278
Street Nodes Traffic Signal 4.7794 0.0000 ***
Turning Circle −0.3029 0.7620
Stop Sign 0.3117 0.7553
(* p < 0.05, ** p < 0.01, *** p < 0.001).Sustainability 2021, 13, 10583 11 of 13
5. Discussion
Micro-mobility programs such as E-scooter sharing are becoming increasingly impor-
tant and relevant as alternative transportation modes for short distance travels. As more
users are willing to use micro-mobility during the COVID-19 pandemic and beyond, it is
critical to identify and analyze micro-mobility injuries and crashes to secure safe urban en-
vironments. Understanding E-scooter incidents in a street network perspective helps create
a better understanding of the characteristics of E-scooter incidents and their occurrences.
Our study conducted three different phases. First, the time series analysis of E-
scooter ridership, E-scooter incidents, and traffic incidents was conducted to identify
temporal patterns throughout time. Second, local Moran’s I was used to explore the
spatial correlation between three variables and explain the spatial pattern. Finally, the
present study conducted an independent Z-test to identify the statistical difference between
E-scooter incidents and traffic incidents from a street network perspective.
Key findings include the following. First, E-scooter ridership and traffic incidents
share similar patterns throughout time; however, E-scooter incidents hardly shared similar
patterns, but instead fluctuated. Nevertheless, E-scooter incidents do seem to occur more
when there is more significant E-scooter ridership. Second, local Moran’s I verified past
research findings that E-scooter usage tends to occur more near downtown and university
neighborhoods [9]. These neighborhoods were also found to have a relatively greater
degree of E-scooter incidents than others. Moreover, the same downtown neighborhood
was spatially correlated with the first two variables, which explains the likelihood of more
E-scooter ridership and more E-scooter and traffic incidents. Third, independent Z-test
results showed a statistical difference between E-scooter incidents associated with the street
network, with traffic incidents concerning one. Specifically, residential land use, length of
the street, primary and residential street type, number of street nodes, and traffic signals
were statistically significant. These results demonstrate that characteristics of E-scooter
incidents do not fully correlate with traffic incidents, and surrounding built environments
concerning crashes differs. Therefore, these results should be carefully considered for
devising planning initiatives to create safe urban environments.
6. Conclusions
The present study contributes to shared micro-mobility research in several ways.
First, the study identified and verified previous findings that explain E-scooter ridership.
Second, we used an unexplored dataset and suggested a new research framework for
understanding E-scooter incidents or crashes. Third, this study is one of the first E-scooter
safety studies that identified the difference between E-scooter incidents and general traffic
incidents from the street network perspective. This study can provide planners with the
characteristics of E-scooter incidents and improve understanding of contexts of injuries
and crashes.
As there are statically significant built environment differences between E-scooter
and traffic incidents in general, planners should avoid implementing the same traditional
measures to mitigate E-scooter incidents. Moreover, a measure to control other micro-
mobility incidents, such as bike-sharing, cannot be the ultimate panacea since E-scooter
crashes are not completely interchangeable [7]. Instead, E-scooter incidents should be
individually explored and analyzed. E-scooter injuries seem to commonly occur on side-
walks, neighborhood streets, and major roadways, and the time of use and travel speed
affects the severity of E-scooter injury [15,18]. E-scooter incidents tend to occur near streets
adjacent to traffic signals and in primary street types compared to traffic incidents. In
this case, a system that alerts E-scooter users to pay closer attention near sidewalks and
increased traffic signal visibility may help reduce E-scooter incidents. Clear and visible
symbols or colors on roads may help resolve safety issues. As smart crosswalk and signal
systems are being implemented in cities, a system that identifies and control E-scooter
users automatically and controls the traffic signal duration may prevent potential E-scooterSustainability 2021, 13, 10583 12 of 13
incidents. Exploring the application of new innovative technology remains a task for future
smart cities.
For future study, we suggest exploring the factors associated with E-scooters by
surveying E-scooter users. For instance, measuring the effects of wearing protective gear
on the severity of the injury is critical. Because the rate of using helmets is mainly found
to be low for shared micro-mobility users [13,30]. Alternatively, as shared micro-mobility
is more visible with other micro-mobilities in streets, evaluating the present risk factors
will be helpful to apprehend shared micro-mobility safety [30]. However, the lack of traffic
and crash data related to E-scooters is the main obstacle for future E-scooter safety studies.
Perhaps applying crowdsourcing tools to obtain public opinions may help gather local
safety data and bring valuable insight to planning practices [3].
The present study has several limitations. First, there are no general public E-scooter
incidents data. Therefore, the research scope of the present study is limited. Second, land
use and built environment factor gathered using round buffer, so the result may differ
depending on its size. Third, land use data are based on 2012 records and may be outdated.
Fourth, the limitation of using Zillow neighborhood boundaries is that the size is hardly big
enough to cover up the entire City of Austin. Though the boundary falls into shared micro-
mobility service areas, the geographic scope is limited. Future studies should consider
these limitations.
Author Contributions: Conceptualization, J.J., S.B., and S.J.C.; methodology, J.J., S.B., and S.J.C.;
validation, J.J., S.B., and S.J.C.; formal analysis, S.B. and S.J.C.; resources, S.B. and S.J.C.; data curation,
S.J.C.; writing—original draft preparation, S.B. and S.J.C.; writing—review and editing, J.J., S.B., and
S.J.C.; visualization, S.J.C.; supervision, J.J.; project administration, J.J.; funding acquisition, J.J. All
authors have read and agreed to the published version of the manuscript.
Funding: This work has been funded through the UT Good System Grand Challenge and the
USDOT Cooperative Mobility for Competitive Megaregions University Transportation Center at The
University of Texas at Austin.
Institutional Review Board Statement: Not applicable.
Informed Consent Statement: Not applicable.
Data Availability Statement: The data described in this article are openly available at City of Austin
Open Data Portal, https://data.austintexas.gov/Transportation-and-Mobility/Shared-Micromobility-
Vehicle-Trips/7d8e-dm7r (accessed on 7 April 2021); https://data.austintexas.gov/Transportation-
and-Mobility/Real-Time-Traffic-Incident-Reports/dx9v-zd7x/data (accessed on 7 April 2021), and
Patch, https://patch.com/texas/downtownaustin/scooter-crash-analysis-gives-glimpse-injuries-
toll-austin (accessed on 7 April 2021).
Acknowledgments: The authors declare that they have no known competing financial interests or
personal relationships that could have appeared to influence the work reported in this paper.
Conflicts of Interest: The authors declare no conflict of interest.
References
1. Allem, J.-P.; Majmundar, A. Are electric scooters promoted on social media with safety in mind? A case study on Bird’s Instagram.
Prev. Med. Rep. 2019, 13, 62–63. [CrossRef]
2. Yang, H.; Ma, Q.; Wang, Z.; Cai, Q.; Xie, K.; Yang, D. Safety of micro-mobility: Analysis of E-Scooter crashes by mining news
reports. Accid. Anal. Prev. 2020, 143, 105608. [CrossRef]
3. Bai, S.; Jiao, J. From shared micro-mobility to shared responsibility: Using crowdsourcing to understand dockless vehicle
violations in Austin, Texas. J. Urban Aff. 2020, 1–13. [CrossRef]
4. Shaheen, S.; Cohen, A. Micromobility Policy Toolkit: Docked and Dockless Bike and Scooter Sharing. 2019. Available online:
https://escholarship.org/uc/item/00k897b5 (accessed on 4 July 2021). [CrossRef]
5. Tuncer, S.; Laurier, E.; Brown, B.; Licoppe, C. Notes on the practices and appearances of e-scooter users in public space. J. Transp.
Geogr. 2020, 85, 102702. [CrossRef]
6. Ma, Q.; Yang, H.; Mayhue, A.; Sun, Y.; Huang, Z.; Ma, Y. E-Scooter safety: The riding risk analysis based on mobile sensing data.
Accid. Anal. Prev. 2021, 151, 105954. [CrossRef]Sustainability 2021, 13, 10583 13 of 13
7. Shah, N.R.; Aryal, S.; Wen, Y.; Cherry, C.R. Comparison of motor vehicle-involved e-scooter and bicycle crashes using standardized
crash typology. J. Saf. Res. 2021, 77, 217–228. [CrossRef]
8. PBOT. 2018 E-Scooter Findings Report; PBOT (Portland Bureau of Transportation): Portland, OR, USA; pp. 1–36.
9. Bai, S.; Jiao, J. Dockless E-scooter usage patterns and urban built Environments: A comparison study of Austin, TX, and
Minneapolis, MN. Travel Behav. Soc. 2020, 20, 264–272. [CrossRef]
10. Park, B.; Cho, J. Older adults’ avoidance of public transportation after the outbreak of COVID-19: Korean subway evidence.
Healthcare 2021, 9, 448. [CrossRef] [PubMed]
11. Campisi, T.; Basbas, S.; Skoufas, A.; Akgün, N.; Ticali, D.; Tesoriere, G. The impact of COVID-19 pandemic on the resilience of
sustainable mobility in Sicily. Sustainability 2020, 12, 8829. [CrossRef]
12. Teixeira, J.F.; Lopes, M. The link between bike sharing and subway use during the COVID-19 pandemic: The case-study of New
York’s Citi Bike. Transp. Res. Interdiscip. Perspect. 2020, 6, 100166. [CrossRef]
13. Störmann, P.; Klug, A.; Nau, C.; Verboket, R.D.; Leiblein, M.; Müller, D.; Schweigkofler, U.; Hoffmann, R.; Marzi, I.;
Lustenberger, T. Characteristics and injury patterns in electric-scooter related accidents—A prospective two-center report from
Germany. JCM 2020, 9, 1569. [CrossRef] [PubMed]
14. Zou, Z.; Younes, H.; Erdoğan, S.; Wu, J. Exploratory analysis of real-time e-scooter trip data in Washington, D.C. Transp. Res. Rec.
2020, 2674, 285–299. [CrossRef]
15. Cicchino, J.B.; Kulie, P.E.; McCarthy, M.L. Severity of e-scooter rider injuries associated with trip characteristics. J. Saf. Res. 2021,
76, 256–261. [CrossRef]
16. Marshall, W.E.; Garrick, N.W. Does street network design affect traffic safety? Accid. Anal. Prev. 2011, 43, 769–781. [CrossRef]
17. Moeinaddini, M.; Asadi-Shekari, Z.; Zaly Shah, M. The relationship between urban street networks and the number of transport
fatalities at the city level. Saf. Sci. 2014, 62, 114–120. [CrossRef]
18. Dockless Electric Scooter-Related Injuries Study September—November 2018; Austin Public Health: Austin, TX, USA, 2019; pp. 1–15.
Available online: https://www.austintexas.gov/sites/default/files/files/Health/Epidemiology/APH_Dockless_Electric_
Scooter_Study_5-2-19.pdf (accessed on 21 February 2021).
19. Shared Micromobility Vehicle Trips. Open Data. City of Austin Texas n.d. Austin. Available online: https://data.austintexas.
gov/Transportation-and-Mobility/Shared-Micromobility-Vehicle-Trips/7d8e-dm7r (accessed on 7 April 2021).
20. Scooter Crash Analysis Gives Glimpse of Injuries Toll in Austin. Austin, TX Patch, 2019. Available online: https://patch.com/
texas/downtownaustin/scooter-crash-analysis-gives-glimpse-injuries-toll-austin (accessed on 7 April 2021).
21. How Cluster and Outlier Analysis (Anselin Local Moran’s I) works—ArcGIS Pro. Documentation, n.d. Available online: https://
pro.arcgis.com/en/pro-app/latest/tool-reference/spatial-statistics/h-how-cluster-and-outlier-analysis-anselin-local-m.htm (ac-
cessed on 9 September 2021).
22. Zhang, C.; Luo, L.; Xu, W.; Ledwith, V. Use of local Moran’s I and GIS to identify pollution hotspots of Pb in urban soils of
Galway, Ireland. Sci. Total Environ. 2008, 398, 212–221. [CrossRef]
23. Lu, X.; Wang, M.; Tang, Y. The spatial changes of transportation infrastructure and its threshold effects on urban land use
efficiency: Evidence from China. Land 2021, 10, 346. [CrossRef]
24. Moons, E.; Brijs, T.; Wets, G. Improving Moran’s Index to identify hot spots in traffic safety. In Geocomputation and Urban Planning;
Murgante, B., Borruso, G., Lapucci, A., Eds.; Springer: Berlin/Heidelberg, Germany, 2009; pp. 117–132. [CrossRef]
25. Truong, L.; Somenahalli, S. Using GIS to identify pedestrian-vehicle crash hot spots and unsafe bus stops. JPT 2011, 14,
99–114. [CrossRef]
26. Kuo, P.-F.; Zeng, X.; Lord, D. Guidelines for choosing hot-spot analysis tools based on data characteristics, network restrictions,
and time distribustions. In Proceedings of the Transportation Research Board 91st Annual Meeting, Washington, DC, USA,
22–26 January 2012.
27. Xie, Z.; Yan, J. Detecting traffic accident clusters with network kernel density estimation and local spatial statistics: An integrated
approach. J. Transp. Geogr. 2013, 31, 64–71. [CrossRef]
28. Jiao, J.; Moudon, A.V.; Drewnowski, A. Grocery shopping: How individuals and built environments influence choice of travel
mode. Transp. Res. Rec. 2011, 2230, 85–95. [CrossRef]
29. Solgi, E.; Oshvandi, Z. Spatial patterns, hotspot, and risk assessment of heavy metals in different land uses of urban soils (case
study: Malayer city). Hum. Ecol. Risk Assess. 2018, 24, 256–270. [CrossRef]
30. Martin, E.; Cohen, A.; Botha, J.; Shaheen, S. Bikesharing and bicycle safety. MTI Publ. 2016, 1204, 93.You can also read