Queer Identities in Video Games: Data Visualization for a Quantitative Analysis of Representation - SBGames
←
→
Page content transcription
If your browser does not render page correctly, please read the page content below
SBC – Proceedings of SBGames 2017 | ISSN: 2179-2259                                                                   Culture Track – Full Papers

    Queer Identities in Video Games: Data Visualization for a Quantitative
                          Analysis of Representation
                          ∗
         Sofia Utsch 1            Luiza C. Bragança†             Pedro Ramos1 ‡            Pedro Caldeira1 §           Joao Tenorio1 ¶

                                                 1 Universidade   Federal de Minas Gerais, Brazil

                Figure 1: A comparison of the number of instances of content representing each one of those LGBTQ identities

A BSTRACT                                                                    1   I NTRODUCTION
LGBT Game Studies has been a field mostly focused on qualita-                Video Games are a social artifact and as such it is important to look
tive analysis of games. There hasn’t been many efforts towards a             at them from a cultural angle. Video games and the representation
bigger understanding of the context of queer representation in the           of people in it impact the cultural corpus of those who interact with
medium as a whole. Recently, there’s been the creation of two on-            them. Through cultural representation, we can better understand
line databases to gather together queer content in videogames, one           the world around us and the people with different life experiences
of them being the LGBTQ Game Archive. Using interactive visu-                from ours. It is also possible to provide validation for stigmatized
alizations that were developed based on the dataset provided by the          identities and life experiences. Some of the identities that need to
archive, this paper proposes a quantitative analysis of the instances        be addressed in this context are LGBTQ people[20].
of queer characters present in video games, to discover more about              In comparison to other medias such as cinema and television, the
the evolution of LGBTQ representation in the medium. We wanted               presence of queer representation in games is still small. People who
to look into how the representation has evolved, regarding the num-          are not gender normative or belong to an underprivileged position
ber of characters with queer identities, and the number of characters        in society often suffer from a lack of visibility in the medium [17].
with each sexuality or gender identity; the intersections of different       In some cases, it even goes beyond exclusion and grows into ex-
identities inside the same game; the presence of queer characters            plicit aggression and prejudice. Some contexts in online gaming,
regarding game genres. We found out that the number of instances             like the community of World of Warcraft, are still hostile towards
of queer characters in games has largely increased, and that is also         LGBTQ gamers [13]. It is important to study the context of the
true for the analysis of individual sexualities and gender identities.       queer presence in video games to understand how we can build a
We also discovered that RPG and Adventure are the genres that                more welcoming community, and how the medium can be more
have the most LGBTQ characters. And finally, we found a big cor-             representative of diverse identities.
relation of non-binary and gender non-conforming characters with                While there has been research on how LGBTQ representation
bisexual ones. While this work has granted us a clearer understand-          happens in video games, those works tend to focus on the players’
ing of how queer characters have been portrayed in video games,              behavior and response to that representation, or in the analysis of
further studies about the quality and importance of those portrayals         the queer presence in specific titles. The field lacks information on
are necessary.                                                               the context of queer representation as a whole [5]. This work aims
Keywords: LGBTQ representation, queer, videogames, games.                    to start a discussion about overall perspective of the topic, by doing
                                                                             a quantitative analysis of the evolution of the LGBTQ presence in
  ∗ e-mail: sofia.utsch@gmail.com                                            video games from the 1980’s to the 2010’s.
   † e-mail:lcbraganza@gmail.com                                                To achieve that, this research developed interactive visualiza-
  ‡ e-mail: phramoscosta@gmail.com                                           tions, used to help in the detection of patterns in the data regarding
  § e-mail: pedro.caldeira@dcc.ufmg.br                                       queer presence in video games. The data used in the visualizations
  ¶ e-mail: jvstenorio@dcc.ufmg.br                                           was gathered from the LGBTQ Video Game Archive [11], which is
                                                                             a project concerning LGBTQ+ representation and is being carried
                                                                             out at the Temple University’s Lew Klein College of Media and
                                                                             Communication. The work of data extraction from the archive is
                                                                             led by the professor Adrienne Shaw and is still in progress. The al-

XVI SBGames – Curitiba – PR – Brazil, November 2nd - 4th, 2017                                                                                 847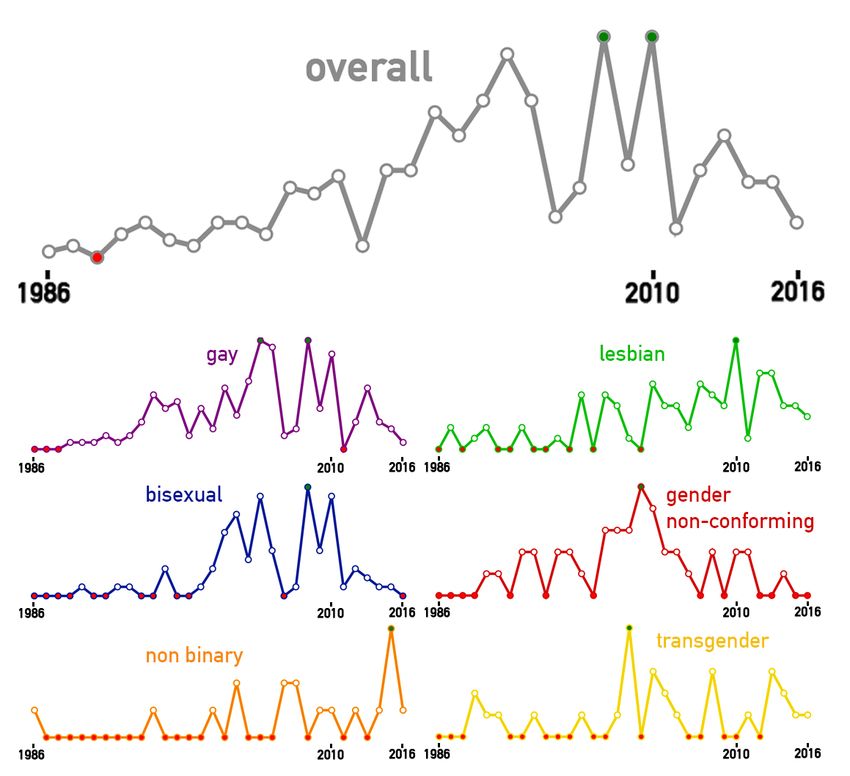
SBC – Proceedings of SBGames 2017 | ISSN: 2179-2259                                                               Culture Track – Full Papers

ready collected data has information on more than 300 games from         developers increased, and now there’s a considerable presence of
the 80’s to the present time, and more than 500 kinds of representa-     games which challenge hegemonic preconceptions and narratives
tion were catalogued. Details of these data collection was published     in video games [1]. Alongside, communities of queer developers
in [18].                                                                 interested in talking about their own experiences have been formed.
   This research’s goal is to use the visualizations to identify pat-    Perhaps the biggest example was the Twine revolution, a movement
terns in the representation of queer characters in video games, and      of games that talked about the personal narratives of queer creators
to try to identify ways in which it has evolved. Some questions that     [9].
might be of interest to achieve this objective are:                         However, the context of how queer content in video games hap-
                                                                         pens, from a wider perspective, has not been a subject of further ex-
    1. How has the LGBTQ+ representation in digital games evolved        ploration by researchers.To find out more about a holistic approach
       through the years?                                                on queer game studies, two important resources have been founded
                                                                         in 2016: the LGBTQ Game Archive and Queerly Represent Me.
    2. Which sorts of representation have increased and which have       The LGBTQ Game Archive, which has been used as a primary
       decreased?                                                        source of information for this research, will its content addressed
                                                                         further on this paper. Queerly Represent Me was founded in May
    3. How has the amount of explicitly LGBTQ+ characters                2016, in Australia, and is described as a resource hub and research
       evolved compared to the amount of implicitly or rumored           organization for LGBTQ content in games. The website holds a
       ones? Has it increased or decreased?                              database of games that feature queer content, and also further re-
                                                                         sources for research in the area[14].
    4. Which are the genres in which the LGBTQ+ content is more             Gathering data from both those sources, Cole, Shaw and Zammit
       present?                                                          [5] have analyzed the growth of queer representation in games from
                                                                         2013 to 2015. In the time span between those two years, the number
    5. Which are the gender identities that are more addressed?
                                                                         of games featuring LBGTQ themes has doubled. It was also con-
    6. Is there any coexistence of different LGBTQ identities in         cluded that the representation of diverse sexualities is more present
       games, and if so how does it happen?                              than the representation of diverse genders, and that, regarding sexu-
                                                                         alities, lesbians and gay men have more instances of representation
                                                                         than bisexual people.
2    R ELATED W ORK
Before starting the analysis, it is important to acknowledge how         3 M ETHODOLOGY
queer issues in video games are being studied. According to Ruberg       This section will explain how the process of gathering data and the
and Shaw, ”Like most game studies scholarship, LGBTQ game                confection of the visualizations happened.
studies can be grouped into three main areas: community/cultural
research, textual analysis, and design studies.” [15] Most of the        3.1 The LGBTQ Video Game Archive
studies so far tend to fit the first group, community and cultural re-   To provide a base for building the visualizations, a database col-
search, approaching the relations between queerness and fan com-         lected from the LGBTQ Game Video Archive was used. The
munities, as well as online gaming. The third group mentioned, de-       Archive is a great resource for a qualitative approach in research.
sign studies, focuses on how to challenge preconceptions on game         However, its data is structured for an individual analysis of each
design by analyzing the systems of play from a queer point of view.      game and so, comparisons of a larger amount of entries can be
However, because of the context of this research, this paper will        laborious. The generation of the visualizations has the objective
focus on studies from the second group, textual analysis, which ap-      of offering tools to better comprehend this multifaceted data set.
proaches LBGTQ content in games.                                         Through data visualization, this work explores the data on the
   Some research has been done to investigate how queer content          LGBTQ Game Archive on a quantitative way, in order to find pat-
takes place in video games, but those studies tend to focus on indi-     terns of queer content in video games.
vidual commercial titles, and not the full context of representation
in the medium. Some examples are Consalvo’s work investigating
relationships in The Sims [6] and Greer’s examination of the inclu-
sion of non-heterosexual identities in Role Playing Games [8]. It
is noticeable that the majority of explicitly queer content in games
takes place in the possibility of pursuing a relationship with charac-
ters of the same gender. However, this doesn’t necessarily configure
LGBTQ representation, since it depends on the player’s will to take
part in those relationships, and it is not going to appear in the game
if the player chooses otherwise. They indicate the possibility of
homosexuality and bisexuality, but ”are not inherent examples of
queerness”[15].
   The presence of transgender, non binary and gender non-
conforming representation, however, is very rarely addressed [18].
Explicitly shown transgender characters are mostly presented as
small secondary roles, and are often victims of transphobia, with
trans women also being subjects of overt sexualization. Character
creation systems, with a few exceptions, tend to be based in gender
stereotypes, and don’t offer the possibility of creating non binary or
gender non conforming characters [3].                                    Figure 2: From all types of queer related content in the initial
   Switching the focus to independent, often personal developed          database, characters were the majority of the instances.
games, it is possible to notice a bigger presence of queer relevant
content. When game making tools and distribution became avail-              The gathered data was processed and a suite of X data visualiza-
able to wider audiences, the presence of minorities and different        tions using D3.js was created. To build the visualizations, the data

XVI SBGames – Curitiba – PR – Brazil, November 2nd - 4th, 2017                                                                            848
SBC – Proceedings of SBGames 2017 | ISSN: 2179-2259                                                                 Culture Track – Full Papers

had to be cleaned and structured to make sure the visualizations
would be faithful to the content of the archive. When making data
visualization, the amount of data used is crucial, as patterns will
hardly emerge from a small pool of data. The amount of informa-
tion on the archive concerning LGBTQ representation in the form
of game characters was by far the most numerous of the content
types as it can be observed in figure 2.
    Unfortunately, the amount of instances of the other content types
in the Archive was too small to enable the craft of conclusive visu-
alizations about them. With that in mind, it was decided to focus
the analysis in the character instances of representation declared on
the database. After the instances unrelated to Characters from the
database were removed, there was still data about 861 video games.
    In the final dataset, there were detailed instances of characters
with a set of characteristics of the representation. Each instance
has attached to them information about the character and about the
game. We have the character sexuality if the instance was about           Figure 3: Every instance in GAME can be related to one or more in-
sexuality and we have the character gender or gender performance          stance of CONTENT, but each instance of CONTENT can be referred
if thats what the instance is about. We also have the year of release,    to only one game.
country of origin and game genre attached to each instance. Other
information we have available is if the representation was explicit -
meaning the character queerness is made clear in the game - or if it      3.3 Visualizations
is implicit - where the representation appears through coded queer
                                                                          With the database up and running, a suite of X visualizations to
characteristics or rumours.
                                                                          aid the analysis of the LGBTQ Content across the video games in
                                                                          the last 30 years was developed. The D3.js Javascript library was
3.2   Data collection
                                                                          used to implement the interactive visualizations [2]. The analyses
The data utilized in the visualizations was extracted from a spread-      of each visualization shall be discussed later in this paper. They are
sheet that encompassed each LGBTQ content and their game data             as follows:
in a single line, spread in attributes such as Game Genre, Type of           Dashboard: an overview. The Dashboard is a panel with three
Content, Release Year, Country and etc. Due to the fact that the          interactive visualizations [7] and was filled with data from both the
spreadsheet was filled by several collaborators, the data lacked pat-     GAME and CONTENT tables. The pie chart represents the types of
tern. Some fields had many different values that in reality were the      content between 6 categories of representation: Gay man, Lesbian,
same. For example, an ”RPG” game would often appear with the              Bisexual, Transgender, Non-binary and Gender non-conforming.
genres of ”RPG”, ”Role-playing” or ”Role playing game”. There-            All the 6 categories sum up to a 100%, so the pie chart encom-
fore, prior to feeding the visualizations with the data, a process of     passes every character content represented in our database. When
formatting and data structuring was carried out.                          the user selects one of the categories, the histogram and the line
   Data formatting. The whole spreadsheet was formatted to low-           chart change to show data for that specific category. The histogram
case strings in order to make the analysis easily case-insensitive.       on the right shows each genre and the number of games (not content
Also, to allow the coalescing of different field values that in reality   entries) that showcase that specific category. The line chart repre-
were equal (such as ”RPG” and ”Role playing game”), some basic            sents the number of games with that theme through the years. If
values for each field were defined and the whole data was processed       the user clicks on the same category again, the dashboard will show
in a way where each field value would either fit in one of the prede-     this info for the whole database.
fined values or it would be considered ”other”. For example, in the          Dendrogram by game genre. The next visualization is a sim-
Game Genre case, the 6 most common genres were selected: RPG,             ple Dendrogram [16] that shows content in each major game genre
Adventure, Shooter, Fighting, Simulation and Action. Any game             based on the sexual orientation of the characters. The scale is from
that didn’t fit in one of those (such as RTS - Real Time Strategy)        1 to 5, in which 1 means few games and 5 means loads of games.
would be considered ”other” because its presence was negligible.          The three most common sexualities in the dataset - Gay, Lesbian,
   Removing redundancy. Many lines in the spreadsheet were re-            Bisexual - are represented as a horizontal bar, and the dendrogram
lated to the same game. This created redundancy in the data, once         shows how the genres are related to LGBTQ Content concerning
although the content might vary, many important features of the           sexual orientations of the characters. Gender identities were not
game remained the same, such as name, country, year and etc. Con-         contemplated because their presence in video games, compared to
sidering this,two tables were created in our Data Base: GAME and          diverse sexualities, is not sufficient for a conclusive analysis in this
CONTENT. They were related by each game ID. By doing that,                visualization.
a separation between game data and content data was determined.              Streamgraph: gender and sexuality through time. The stream-
Now, each content might be related to one and only one game, while        graph [4] correlates the same 6 categories present in the dashboard
one game might have one or more entries of LGBTQ Content. The             with the release years of their respective games. It was built in a
figure 3 shows the relationship diagram for the database.                 scale of 2, because the dataset has 3 sexual orientations - Gay, Les-
   Sparse data. Some games and contents had fields with missing           bian and Bisexual - and 3 gender identities and expressions - Trans-
values. Unfortunately, filling up the missing values would entail         gender, Gender Non-Conforming and Non-binary. Each set sum up
going through the LGBTQ Game Archive manually analyzing each              to 1, and both groups together sum up to 2. Therefore, the sexu-
game. Since this is not the purpose of this work, the data was sim-       alities and gender identities are being treated as different groups,
ply structured and uploaded in the database. Hence, some LGBTQ            compared within themselves. This graph aids the visualization of
game’s content is not entirely complete, especially for more recent       how the representation in games has changed through the years.
games (2010 onward, from which year the data starts to become                Content explicitness. Several entries in the CONTENT table
sparser).                                                                 were tagged as explicit or implicit. For example, a Lesbian charac-

XVI SBGames – Curitiba – PR – Brazil, November 2nd - 4th, 2017                                                                                849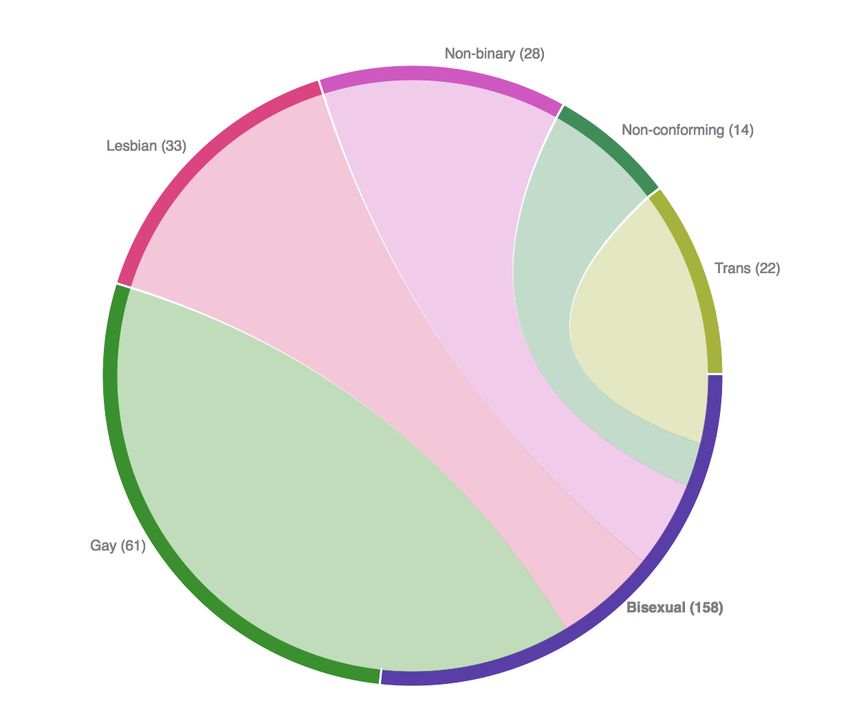
SBC – Proceedings of SBGames 2017 | ISSN: 2179-2259 Culture Track – Full Papers
ter could appear as ”Lesbian implicit” or ”Lesbian explicit”. Con-
sidering that, two horizontal bar charts were built to visually aid
the analysis of how explicit and implicit LGBTQ content in games
has evolved through the years. A second bar chart was also built
to show the explicitness by country, based on each game’s origin
country.
Chords: representation sets. The chord chart [10] correlates all
the 6 categories present in the dashboard. Very often a game would
appear more than once in the CONTENT table - as explained in
section data redundancy. Bearing that in mind, a chord graph was
developed tot correlate two types of character contents when they
appear in the same game. If the same game has contents of Trans-
gender and Bisexual characters, for instance, then there will be a
chord connecting both in the graph. By selecting a representation
type in the graph, the user is able to see for each of the other repre-
sentation types how many games are shared between them.
4 A NALYSIS
The analysis will follow each of the visualizations developed for
this research: first providing an overview of the dataset; sec-
ond, presenting a study on the evolution of LGBTQ representation
through time; third, showing how the representation of different
sexualities happens in different game genres; forth, comparing ex- Figure 4: Time series displaying the quantitative evolution of LGBTQ
plicit with implicit representation; and fifth, analyzing how the rep- representation
resentation of different queer identities relate to each other inside
the same game. The visualizations are available online, in https://s-
utsch.github.io/lgbtq-games-represent/.
However, it is again important to point out that the dataset is The analysis of those two graphs are aligned to what was con-
incomplete from 2010 to 2016, since the LGBTQ Video Game cluded by Cole, Shaw and Zammit [5], both regarding the com-
Archive is still a work in progress and the information regarding parison of the presence of each identity in games, and the overall
these years is still being documented. Therefore, all the available evolution of the numbers in queer representation. It was stated that
data from those years has been taken into consideration, and with there’s a bigger presence of diverse sexualities in comparison to
it is still possible to point out some tendencies, but it’s necessary gender identities, and that the presence of LGBTQ representation
to keep in mind that there’s more content to still be evaluated. This is growing.
will become an important issue when analyzing temporal series, es- Moving on to the third element of the dashboard, the histogram
pecially. (displayed on figure 5), what can be observed is that RPG, Ad-
venture and Action are the genres with higher numbers of LGBT
4.1 Dashboard representation, with RPG being the most representative one, with
almost 40% of the total. The instances of representation in Fight-
The dashboard is a set of three different interactive visualizations, ing, Simulation and Shooters are considerably less numerous, each
with the objective of providing an overall view on the gathered data. representing less than 5% of the of games in the dataset.
First, there’s a pie chart representing the percentage of characters
It could be hypothesized that this behavior happens mostly be-
of each identity and sexuality in the games present on the database,
cause of the genre’s characteristics, regarding character and narra-
followed by a time series from 1985 to 2016 showing the amount of
tive complexity. RPGs, Adventure, and, to a lesser extent, Action
games that feature queer characters in each of those years. Finally,
games tend to focus more on character development and story than
theres a histogram of the number games with LGBTQ characters
Shooters, Fighting games and Simulations. This opens up more
distributed in six game genres.
possibilities for the introduction of diverse characters.
The pie chart, displayed on figure 1, shows that gay male char-
acters are the most present in video games, with a percentage of
4.1.1 Sexualities
38% of the representation. Theyre followed by lesbians and bisex-
ual characters, which respectively have 21% and 20% of the repre- When looking at the visualizations for each different sexuality sep-
sentation. Gender non conforming presentation, binary transgender arately, it is possible to reach further conclusions. Starting with the
identities and non binary identities are the least represented, gath- time series of games featuring lesbian characters, we noticed that
ering together only 21% of the representation in the database. the number of lesbians were higher from the start, but suffer a less
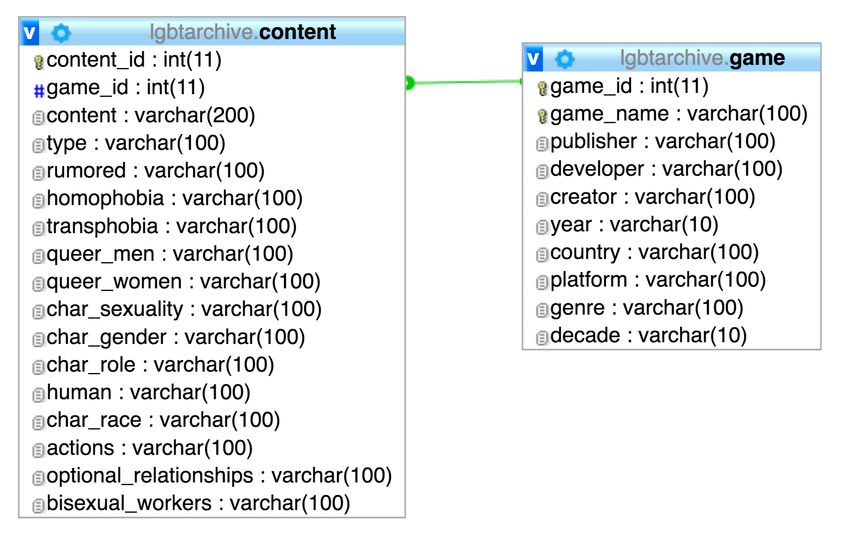
In the general time series, theres a noticeable rise in the numbers steep rise than the number of male gay characters. In the histogram,
of queer characters per year up to 2010, which is when the data the tendency noted in the overall analysis is confirmed when look-
becomes sparse (see figure 4 for more information). Theres a dip ing at lesbian representation. The three genres most present are still
in the numbers in 2006 and 2007, but overall a distinct rise can be RPG, Adventure and Action. However, the distribution between
noticed. The time series representing the sexualities follow a sim- those three genres is less constant in that case: there’s 44% in RPGs,
ilar curve, and the same rise can be observed in them. The graphs 15% in Action, and 27% in Adventure. Comparing to the overall
displaying the evolution of gender related representation, however, graph, and the graphs of gay men and bisexuals, lesbians tend to
show a slightly divergent progression. The transgender and non- have an even bigger percentage of the representation in RPGs, and
binary time series show a growing tendency, but at a small and less less in Action games.
consistent rate. The most divergent time series is the one displaying The number of gay male characters has a slower rise until 1995,
representations of gender non-conforming characters; it rises until but after that year, it starts to grow on the highest rate amongst
2002, and decreases after that. It is the only graph that has better the observed identities and sexualities. In the histogram, we see a
numbers before that year than in the following years. behavior similar to the general view, with the number of games with
XVI SBGames – Curitiba – PR – Brazil, November 2nd - 4th, 2017 850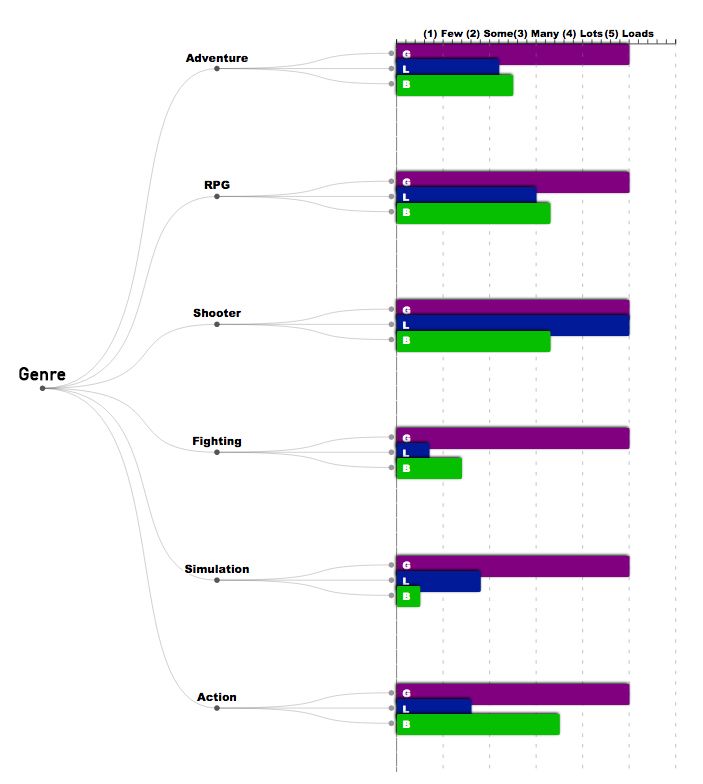
SBC – Proceedings of SBGames 2017 | ISSN: 2179-2259                                                                Culture Track – Full Papers

                                                                         peak in 2001 and from there have a decrease in the number of char-
                                                                         acters appearing in games until 2007. From there on theres a higher
                                                                         number of instances, even as the data becomes sparse. The dis-
                                                                         tribution of binary transgender characters in game genres follow a
                                                                         proportion closer to the one seen in the lesbian histogram, with a
                                                                         significant drop of instances in Action games and a higher number
                                                                         in RPGs. Theres no instances in the database of binary trangen-
                                                                         der characters in Shooters, and the numbers in Fighting games and
                                                                         Simulation are low, similarly to what happened to the non binary
                                                                         graph.
                                                                            The gender non conforming characters have the biggest pres-
                                                                         ence in games regarding diverse gender representation, and have
                                                                         been slowly increasing in numbers from 1989 to 2002, when the
                                                                         graph begins to drop and then stabilize at an amount close to the
                                                                         what is seen in the 1990s. For gender non conforming characters,
                                                                         the two main game genres are RPG and Adventure, which have a
                                                                         similar amount of representation in them. The number of charac-
                                                                         ter in Action games is not as significant as in the other histograms,
                                                                         and there’s a more even distribution of characters amongst the other
                                                                         game genres than in the other identities and sexualities studied.

                                                                         4.2   Streamgraph
                                                                         The streamgraph, displayed in figure 6 is another time series, but
                                                                         this one focus on an overview of how each of the sexualities and
                                                                         gender identities is distributed in relation to one another. There is
                                                                         one color for each of the profiles and the thickness of the lines in the
                                                                         graph represents the proportion of said profile in relationship with
                                                                         the others in each year.
                                                                            Figure stream:
                                                                            In the 1980s, there was less representation, and the majority of
                                                                         the identities present consisted of lesbians, and in a smaller number,
Figure 5: Histograms displaying the presence of queer character in
                                                                         transgender characters. As the time goes on, male gay characters
each of the six most relevant game genres                                get more space in the graph, meaning their presence has increased
                                                                         in video games. It’s also observed that every representation grows
                                                                         as the graph gets thicker with each passing year. Starting in the
                                                                         year 2000, the distribution of sexualities starts to get more even.
gay male characters in each genre keeping the proportion with what       However, the male gay representation remains the most stable and
is seen in the general histogram. Theyre also the most represented       numerous amongst the others.
in the game genres with the least queer representation: Shooters,
                                                                            An interesting finding is that the area that in the 1990s was oc-
Fighting games and Simulations.
                                                                         cupied with gender non conforming characters, is completely filled
   The number of bisexual characters stays constantly low until
                                                                         with the transgender identities in the last year. Similarly, transgen-
1999, when it begins a gradual rise to reach its peak and stabi-
                                                                         der characters occupy a more balanced space in the graph in the
lize in 2008. Looking at the histogram, it can be observed that the
                                                                         later years, in relation to the sexualities being analyzed. In the last
game genres with the most representation there’s a higher number
                                                                         years represented in the graph, there are less male gay characters
of games with bisexual characters than Lesbian characters, in abso-
                                                                         than lesbians and virtually no bisexuals.
lute numbers. It is also noticeable that the representation in those
                                                                            It’s also possible to notice that non binary characters are very
three genres is more proportional than what is seen on the other
                                                                         rare before 2005. This could be attributed to the heavily binary
sexual orientations, but there’s still a higher number of instances in
                                                                         and cisnormative bias of western society, considering that one of
RPGs than in Action or Adventure games. However, the presence
                                                                         the first instances of legal recognition of genders beyond the binary
of bisexuals is the lowest in the three less represented genres, sum-
                                                                         dates from 2003. [12] Taking this into consideration, it is expected
ming up to only 6% of the total, half of the percentages seen for
                                                                         that the representation of people of non binary identities would only
lesbians and gay men.
                                                                         start to appear later in the time period analyzed.
4.1.2   Gender presentation and identity
                                                                         4.3   Dendrogram
Non binary characters dont have any representation for most of the
time frame analyzed, with the exception of a couple of years un-         This visualization is a comparison between the sexualities with the
til 2002. From 2002 to 2016 there’s at least a constant, but low,        goal of discovering how each game genre is representing different
number of non binary character in games. In the histogram, the           sexualities. The number of games of a certain genre featuring gay
number of non binary characters is slightly more balanced between        men, lesbians, and bisexuals are compared, and then normalized in
RPGs and Action games, with Adventure games still having the             a scale that goes from 1 to 5. The patterns found in the dendrogram,
least amount of characters amongst the three main genres. The gen-       which can be seen on figure 7, are in accordance with the ones seen
res with least representation still have some non binary characters      in the histograms present on the Dashboard, which also analyzed
with most of them appearing in Shooters, and less on Simulations         the distribution of queer representation in different game genres.
or Fighting games.                                                          The first thing noticed was that gay men representation is classi-
    Transgender men and women have a similar behavior to the non         fied with 5 in every one of the selected genres. This is no surprise
binary characters, but with higher numbers. They also reach their        and is aligned to what was displayed in the pie chart. Since gay

XVI SBGames – Curitiba – PR – Brazil, November 2nd - 4th, 2017                                                                               851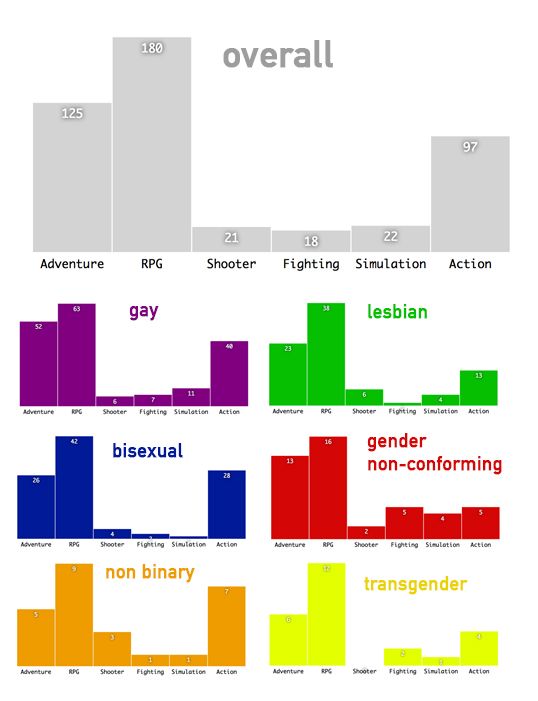
SBC – Proceedings of SBGames 2017 | ISSN: 2179-2259                                                                 Culture Track – Full Papers

       Figure 6: Streamgraph displaying the difference in the proportion of the representation if each LGBTQ identity through the years

                                                                          numbers as gay men, and bisexuals reaching beyond the third tier.
                                                                             Overall, the domination of gay men representation in every genre
                                                                          is expected, likely because men are far more represented in video
                                                                          games, compared to women [19]. Something unexpected is the
                                                                          somewhat well balanced distribution of the three sexualities in the
                                                                          shooter and RPG genres.

                                                                          4.4     Implicit vs. Explicit representation
                                                                          In the dataset, there’s information about the nature of the repre-
                                                                          sentation, if it is either explicit or implicit. Explicit representation
                                                                          happens in a way that leaves no margin for the character to be per-
                                                                          ceived as cisgender and/or heterosexual, while implicit one comes
                                                                          from the interpretation of players and researchers. This distinction
                                                                          is important because it considers queer representation as a complex
                                                                          matter, which can happen in broader contexts than just characters
                                                                          explicitly stating their identities in game. Queer readings by players
                                                                          are an important form of resistance for LGBTQ audiences, and add
                                                                          a fundamental perspective for the understanding of how video game
                                                                          culture relates to matters of gender and sexuality. While explicit
                                                                          representation shows an interest on game developers and producers
                                                                          towards a more diverse medium, implicit representation is not di-
                                                                          rectly linked to an authorial intent, and therefore can be a product
                                                                          of the discussion present in game communities.

                                                                          4.4.1    Per Country

Figure 7: Dendrogram used to compare the presence of different
                                                                          Diverging stacks were used to represent the amount of implicit and
sexualities in each of the selected game genres                           explicit representation in the games produced by each of the follow-
                                                                          ing countries: USA, Canada, Australia, France, Germany, Japan,
                                                                          UK and others.
                                                                             A pattern that can be seen easily is that all the countries consid-
men are by far the most present identity, it is expected that this        ered have more games with implicit representation in them. How-
trend would be confirmed in the analysis of separate genres as well.      ever, Japan and Germany, as the most balanced countries, have
   Among the three genres with the biggest presence of LGBTQ              roughly the same amount of implicit and explicit instances. On the
characters, RPG, Adventure and Action, RPG is the only one of             other hand, France doesnt have any entries of explicit representation
them that displays a reasonable proportion between all sexualities,       in the database, and other countries also have very few instances of
with both lesbians and bisexuals reaching the third category, Many.       explicitly queer characters in their games.
In Action games, lesbians are not very present, their numbers don’t          Japan is an interesting case because it is the most balanced coun-
even reach the second category. Adventure games, however a bit            try, with almost the same amount of explicit instances as explicit
more proportional, still show that both lesbian and bisexual repre-       ones. It is also, outside of the USA, the country with the most in-
sentation are considerably less numerous than gay men, reaching           stances of explicit representation. This variation could partially be
only the second tier, Some.                                               explained by the countrys relationship to games. In Japan, video
   On two of the three less representative game genres, Fighting and      games are seen as an activity for people of all ages, and not only as
Simulation, the disproportion is even more noticeable. Neither les-       children’s entertainment, as it is common in western countries. This
bian or bisexual representation reach the second category used, and       determines a market more open to the inclusion of sexual content
lesbians stay short of 1 in Fighting, while bisexual fail to reach the    suited only for a mature audience, and games have the liberty to
Few tier in Simulations. Shooter games, however, show the most            deal with sexuality in a more explicit way [17]. However, this be-
surprising behaviour. It is the genre with the most equal propor-         havior could still be explored in further research, as the difference
tion between the three sexualities, with lesbians reaching the same       in the Japanese scenario from the rest of the world is very striking.

XVI SBGames – Curitiba – PR – Brazil, November 2nd - 4th, 2017                                                                                852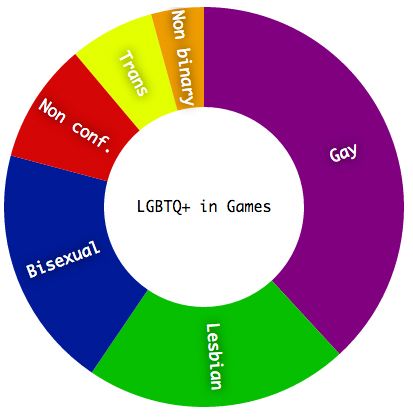
SBC – Proceedings of SBGames 2017 | ISSN: 2179-2259                                                               Culture Track – Full Papers

                                                                         the games with that type of representation also have representation
                                                                         of each of the other types.
                                                                            By taking a closer look at the chords from the three sexualities
                                                                         studied, it is observed that the number of games with bisexual char-
                                                                         acters and some shared instance of gender related representation is
                                                                         of 40,50%. While from the games representing gay male characters
                                                                         only 23,12% have gender related representation, and this number
                                                                         falls to 15,32% for games with lesbians.
                                                                            The patterns of the relationship of bisexual representation with
                                                                         gender expression and identities differs meaningfully from the pat-
                                                                         terns of gay and lesbians representation. The amount of shared rep-
                                                                         resentation doubles in comparison with lesbians and almost doubles
                                                                         when comparing to gay men. This can also be noticed by analyzing
                                                                         the non-binary and gender non-conforming chords. On every other
                                                                         chord, the representation that is most linked is gay, but this doesnt
                                                                         happen on the non-binary and gender non-conforming chords. On
                                                                         the lesbian instances, there’s 58% of male gay shared representa-
                                                                         tion, while only 26% of bisexual representation. Likewise, on the
                                                                         games with binary transgender characters, gay men share 46% of
                                                                         the instances, and bisexuals, 34%.
                                                                            When looking at the representation of characters that break from
                                                                         the gender binary paradigm, there’s a shift in this trend. From
                                                                         the games with non-binary characters with shared representation,
                                                                         there are only 18% of the games representing male gay characters,
                                                                         and 57% representing bisexual characters. When looking at gen-
                                                                         der non-conforming instances, the change is even more noticeable,
                                                                         with only 9,5% of games showing gay male characters and 66%
                                                                         showing bisexuals.
                                                                            There is a distinct connection between bisexual representation
                                                                         and gender related representation that defies the gender binary. To
Figure 8: Bar graphs comparing implicit and explicit representation,     better understand this behavior further investigation is needed.
regarding country of origin and release date

4.4.2    Per Five Year Interval
The overall number of explicit representation grows from each in-
terval to the next until it reaches the peak in 2001-2005. From that
point on, it decreases slightly until 2011-2016, but the data for this
time frame is already sparse.
   Between 1986 to 1990, every instance of representation in the
database is implicit and the number of explicitly queer characters
in games increases steadily until 2005. Its also noticeable that in
that time period, the proportion of explicit and implicit represen-
tation begins to even out. In the years from 2001-2006, the graph
reaches the point where the number of explicit representation is al-
most equal to implicit ones.
   In the last two intervals, from 2006-2010 to 2011-2016, there’s
a slight decrease of explicit instances. But as previously stated, the
data relative to those years does not encompasses all the instances
of queer characters in video games on those years. Further investi-
gation would need to be pursued to better understand those years,
as there was a distinct growing tendency of the explicit instances
up to the year when the data becomes sparse. However, to achieve
conclusive results regarding that time period, another analysis will     Figure 9: Graph that displays the correlation between bisexual char-
be needed with a complete database.                                      acters and characters of other LGBTQ identities
   It is also interesting to note that even with the dataset being in-
complete in those year the total amount of representation on them        5 C ONCLUSION
is still higher that the amount in the years before the peak (2001-
2010).                                                                   Through the analysis of those visualizations, it is possible to con-
                                                                         clude that the representation of LGBTQ characters has increased
                                                                         during the past decades and also became more diverse in the iden-
4.5     Chords
                                                                         tities that it portraits. In later years, the representation of LGBTQ
This visualization allows to identify relationships between the          characters is more well balanced and doesnt retain the strong bias
datasets for each representation. The only games represented in this     towards gay men that can be observed in the 80s and early 90s.
graph are the ones which have two or more types of representation.       It is also noticeable that gender related representation is growing,
By selecting a segment of the circle, it can be noticed how many of      but that it still remains less represented than diverse sexualities;

XVI SBGames – Curitiba – PR – Brazil, November 2nd - 4th, 2017                                                                            853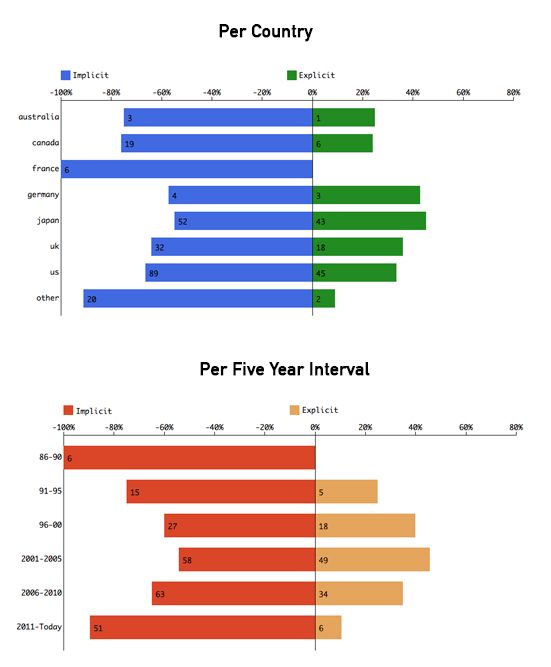
SBC – Proceedings of SBGames 2017 | ISSN: 2179-2259                                                                      Culture Track – Full Papers

gay men are still largely the most present group, followed by les-           [4] L. Byron and M. Wattenberg. Stacked graphs #x02013; geometry
bians and bisexuals. There’s also a growing tendency for explicit                amp; aesthetics. IEEE Transactions on Visualization and Computer
instances of representation up to 2006, when the dataset used be-                Graphics, 14(6):1245–1252, Nov 2008.
came sparse.                                                                 [5] A. Cole, A. Shaw, and J. Zammit. Representations of queer identity
   Another interesting discovery was that gender non-conforming                  in games from 20132015. In Extended Abstract Presented at DiGRA
representation is decreasing with time, and that binary and non bi-              2017. DiGRA, 2017.
                                                                             [6] M. Consalvo. It’s a queer world after all : studying The sims and
nary transgender representations are increasing at a similar rate,
                                                                                 sexuality. GLAAD, 2003.
which could indicate that non traditional gender representations are
                                                                             [7] S. Few. Information Dashboard Design: The Effective Visual Com-
being more directly linked to transgender identities, instead of only            munication of Data. O’Reilly Media, Inc., 2006.
displaying different gender presentations.                                   [8] S. Greer. Playing queer: Affordances for sexuality in fable and dragon
   When looking at the game genres, it can be concluded that                     age. Journal of Gaming & Virtual Worlds, 5(1):3–21, 2013.
LGBTQ representation happens mostly in RPGs, Adventure and                   [9] A. Harvey. Twines revolution: Democratization, depoliticization, and
Action games, in that order. The other three genres present in the               the queering of game design. GAME: The Italian Journal of Game
analysis, Fighting, Simulation and Shooters, weren’t as represen-                Studies, 3(3):95–107, Aug. 2014.
tative. This result probably comes from the more narrative nature           [10] D. Holten. Hierarchical edge bundles: Visualization of adjacency re-
of RPG, Adventure and Action games, which tend to open more                      lations in hierarchical data. IEEE Transactions on Visualization and
possibilities to develop characters in depth, which could include an             Computer Graphics, 12(5):741–748, Sept. 2006.
exploration of queer sexualities and identities.                            [11] Lgbtq video game archive. https://lgbtqgamearchive.com/, 2016. Ac-
   Regarding the co-presence of different identities in the same                 cessed in Augist 7th, 2017.
game, most of them (lesbian, bisexual and transgender men and               [12] Newsletter of the sociology of sexualities section of the american so-
women) are more commonly paired with gay male characters,                        ciological association. American Sociological Association Sexualities
                                                                                 News, 2003. Accessed in August 7th, 2017.
which is expected, since the majority of the queer characters por-
                                                                            [13] A. Pulos. Confronting heteronormativity in online games: A critical
trayed in games are gay men. However, non binary and gender
                                                                                 discourse analysis of lgbtq sexuality in world of warcraft. Games and
non-conforming representations are often paired with bisexuality.                Culture, 8(2):77–97, 2013.
   Overall, this analysis has provided some insight on how LGBTQ            [14] Queerly represent me. http://queerlyrepresent.me/, 2016. Accessed in
representation is happening in video games. And even though the                  August 7th, 2017.
database used for this analysis was still being structured during the       [15] B. Ruberg and A. Shaw. Queer Game Studies. Univ Of Minnesota
process of this research, with some games from 2010 onward not                   Press, 2017.
having been accounted for yet, the games from those years that              [16] J. Seo and B. Shneiderman. Interactively exploring hierarchical clus-
entered the analysis were valuable information for the quantitative              tering results [gene identification]. Computer, 35(7):80–86, July 2002.
analysis made in this work. And while trends can be identified for          [17] A. Shaw. Putting the gay in games: Cultural production and glbt con-
how the representation of queer characters is evolving - notably the             tent in video games. Games and Culture, 4(3):228–250, July 2009.
rise in number and variety that is discussed in the Analysis section        [18] A. Shaw and E. Friesem. Where is the queerness in games?: Types of
of this paper - it will be necessary to revisit this analysis in the fu-         lesbian, gay, bisexual, transgender, and queer content in digital games.
ture with an updated database to have a more complete picture of                 International Journal of Communication, 10:13, 2016.
this theme.                                                                 [19] D. Williams, N. Martins, M. Consalvo, and J. D. Ivory. The virtual
                                                                                 census: Representations of gender, race and age in video games. New
   This paper is just a starting point for the quantitative study of
                                                                                 Media & Society, 11(5):815–834, 2009.
LGBTQ representation in games, and there are plenty of possible             [20] M. M. Y. Yonashiro. O videogame como transformador de cultura: a
further explorations on the theme. Research on the causes of the                 questao lgbt. In Proceedings of SBGames 2012, pages 23–26. SBC,
tendencies observed is crucial for a bigger understanding of the full            2012.
context of this work. And there are plenty of other factors which
weren’t included in the scope of this research that could provide
relevant information, such as the analysis of the roles (playable
characters, NPCs, enemies) queer characters are assigned in video
game narratives and mechanics, or how queer identities intersect
with race. It would be interesting to look more closely into the rela-
tionship of bisexuality and gender identities and performances that
exist beyond the binary of gender.

6   ACKNOWLEDGEMENTS
The authors would like to thank Adrienne Shaw for providing ac-
cess to the database from the LGBTQ Video Game Archive and
allowing us to build the visualizations used in this work, and to
Bernardo Maia, who helped develop part of the visualizations.

R EFERENCES
 [1] A. Anthropy. Rise of The Videogame Zinesters: How Freaks, Normals,
     Amateurs, Artists, Dreamers, Drop-outs, Queers, Housewives, And
     People Like You Are Taking Back An Art Form. Seven Stories Press,
     2012.
 [2] M. Bostock, V. Ogievetsky, and J. Heer. D3: Data-driven documents.
     IEEE Trans. Visualization & Comp. Graphics (Proc. InfoVis), 2011.
 [3] L. Bragança, R. Mota, and E. Fantini. Twine game narrative and dis-
     cussion about lgbtq representation. In Proceedings of SBGames 2016,
     pages 937–946. SBC, 2016.

XVI SBGames – Curitiba – PR – Brazil, November 2nd - 4th, 2017                                                                                      854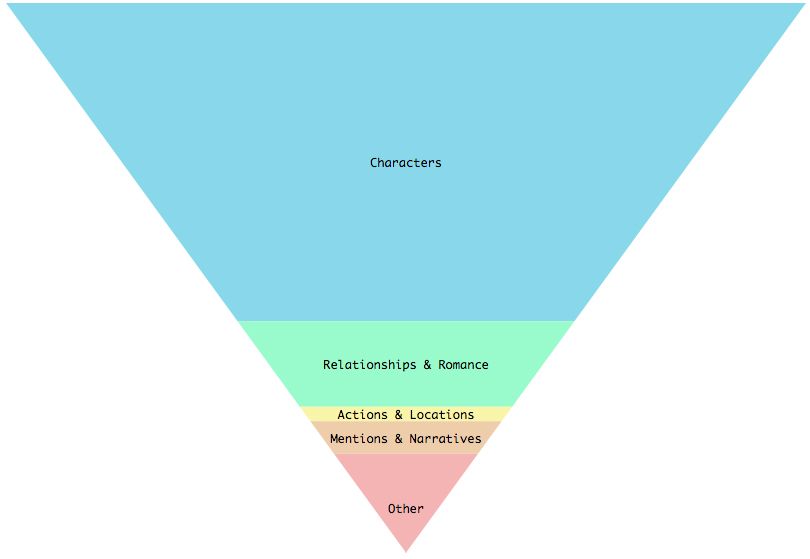
You can also read