Risk Indicators and Road Accident Analysis for the Period 2012-2016 - MDPI
←
→
Page content transcription
If your browser does not render page correctly, please read the page content below
sustainability

Article
Risk Indicators and Road Accident Analysis for
the Period 2012–2016
Lucian-Ionel Cioca 1,2        ID
                                   and Larisa Ivascu 3, *   ID

 1    Department of Industrial Engineering and Management, Faculty of Engineering,
      Lucian Blaga University of Sibiu, Bd. Victoriei No. 10, 550024 Sibiu, Romania; lucian.cioca@ulbsibiu.ro
 2    Academy of Romanian Scientists, Splaiul Independentei, 54, Sector 5, 010071 Bucharest, Romania
 3    Department of Management, Faculty of Management in Production and Transportation,
      Politehnica University of Timisoara, via Victoria Square No. 2, 300006 Timisoara, Romania
 *    Correspondence: larisa.ivascu@upt.ro; Tel.: +40-256-404-308

 Received: 4 July 2017; Accepted: 24 August 2017; Published: 28 August 2017

 Abstract: Road accidents are a major societal issue for every country. The purpose of this paper is to
 assess the number of traffic and road accidents depending on a series of variables (collision mode,
 road configuration, conditions of occurrence, road category, type of vehicle involved, personal
 factors, and length of time of the driving license) in Romania from 2012–2016. The analysis of the
 road accident trend identifies the causes of accidents, road safety performance indicators, and risk
 indicators. Having these identified data, a framework is proposed for improving the road safety
 system and reducing accidents. The Romanian Police, the National Institute of Statistics (NIS) in
 Romania, and the European Commission provided the data used for this analysis. The data obtained
 from these databases are analysed and evaluated according to a series of variables. This paper will
 outline an informative image of road accidents and establish a framework for reducing their effects in
 road transport. As a result of the analysis, we have seen that the combination of vehicles and personal
 factors influences the number of traffic and road accidents.

 Keywords: road accident; traffic accident; risk indicator; road safety; road safety performance indicators

1. Introduction
     Road and traffic accidents involve uncertainty and are unpredictable. These accidents are based
on a number of causes that depend on a number of variables, such as: no priority to pedestrians,
no priority to vehicles, the unlawful crossing of pedestrians, bicycle rider’s deviations, speed not
adapted to road conditions, deviations of the drivers of animal traction vehicles, and so on. It can be
argued that road and traffic accidents are defined by a set of variables, some known and others
unknown, which are more subtle [1–3]. Accident reduction and road safety are major concerns for
public health. This statement is supported by statistics: over 3000 people from all over the world
decease daily because of road traffic [4]. These road accidents cause a series of global economic losses
estimated in road traffic damage costs of $518 billion a year [4]. These huge economic losses contribute
to the country’s economic imbalance. In developing countries, the cost of road accidents is estimated
to be $100 billion [4]. Besides these economic effects, road accidents also influence the demographics of
each country. In this context, identifying strategies to counteract these effects is an important direction
for each country.
     In 49 studies from 13 countries, it was concluded that reporting injuries in official accident statistics
is incomplete at all levels of severity of injuries. These reports found that there were differences
compared with the real situation. It was found that 95% of the reported cases had lesions as follows:
70% serious injuries, 20% minor injuries, and 5% very slight injuries [4–6].

Sustainability 2017, 9, 1530; doi:10.3390/su9091530                          www.mdpi.com/journal/sustainability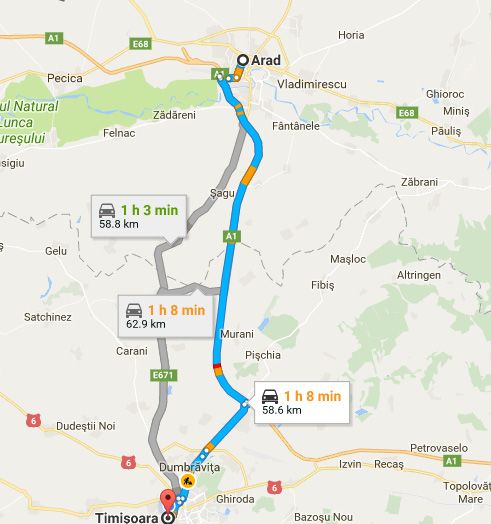
Sustainability 2017, 9, 1530                                                                         2 of 15

      According to various road accident studies, there are a number of factors that influence these
incidents. Environmental conditions, motorway design, type of accident, driver characteristics,
and vehicle attributes are factors identified in research [7]. In another study [8], the factors that
cause the severity of accidents in Hong Kong were examined. The study [9], Alonso et al., examined
the impact of Spanish drivers’ health, and the health conditions that could affect their physical ability
to drive. It has been found that fatigue, alcohol, emotional state, sleepiness, headaches, respiratory
illness, and fever are the most widespread diseases that affect the health of the driver. The intensity
of driving and risk exposure is also a major cause of road accidents, and has implications for road
safety [10]. Personal factors (age, experience, fatigue, health) influence the number of accidents [11–13].
It could be concluded that personal factors considerably affect the number of road accidents.
      These factors are dependent on three types of vehicles: private vehicles, commercial vehicles,
and motorcycles. The study highlights that each type of vehicle is associated with its own particular
factors of severity. In the case of a personal vehicle, the severity levels of accidents were influenced
by the driver’s gender, the vehicle age, the driver’s age, and street light factors. The factors that
influence the accidents involving commercial vehicles are: the use of seat belts, the driver’s health,
vehicle age, the day of the week, and the time of driving. Road accident factors presented in another
study include: time of the accident, location of the accident, road category, the guilty driver’s age,
vehicle characteristics, nationality, and driver experience [9].
      In 2012, there were 5,710,773 registered vehicles, of which: 202,030—age ≤ 2 years, 677,031—age
between 2–5 years, 1,732,941—age between 5–10 years and 3,098,771 over 10 years old. In 2016,
the number of vehicles increased by 19%, reaching 7,010,608 vehicles. Of these there were: 254,042—age
≤ 2 years, 335,308—age between 2–5 years, 1,473,870—age between 5–10 years and 4,947,388 over
10 years old. It is noticed that the number of vehicles older than 10 years is increasing.
      As a result of the evaluation of the specialised literature [9–19], it can be noticed that the road
accident factors are mainly dependent on: the driver’s experience, the environment of the accident,
the road category, the driver’s age, the type of the vehicle and the length of time from acquiring
the driving license. Based on these factors, plus others proposed by the authors, the road accidents
in Romania will be analysed. Following the research, a framework for improving the road safety
system in Romania is proposed based on a bibliographic review and qualitative and semi-quantitative
statistical data analysis.

2. Objective
     The purpose of this study is to evaluate road and traffic accidents in order to get a picture of
performance and safety in Romania. Performance refers to the best results/characteristics obtained on
roads in Romania. To accomplish this goal, the presented study evaluates and analyses the trend of
road accidents in the period 2012–2016. Road accident assessments identify the causes of accidents,
road safety performance indicators, and risk indicators. At the end of the paper, a framework for
improving the road safety system is proposed.

3. Materials and Methods

3.1. Methods
     In this study, the qualitative and semi-quantitative method was used to interpret the statistical data
on the number of traffic and road accidents in Romania. From the statistical data, the selected variables
for analysis included collision mode, road configuration, conditions of occurrence, road category,
type of vehicle involved, personal factors, and length of time of the driving license. For statistical
analysis, the period 2012 to 2016 was chosen. The analysis of the road accident trend identifies the
causes of accidents, road safety performance indicators and risk indicators. Analysing and evaluating
the data lead to obtaining a framework for the improvement of the road safety system and reducing
accidents, which is included in this research.
Sustainability 2017, 9, 1530 3 of 15
3.2. Data Sources
The purpose of this paper is to evaluate the accidents that occurred in Romania. To clarify the
position of Romania regarding the subject of road accidents, a series of data about other European
Union (EU) Member States will be presented. The data used in this research was selected and collected
from the databases related to the following entities: data from the European Commission [18,19],
the National Institute of Statistics (NIS) in Romania [20], and the Romanian Police [21]. These collected
data are evaluated and analysed to identify the causes of accidents, road safety performance indicators,
and risk indicators. For the clarity and accuracy of the identification process, a number of variables
were used to analyse and evaluate the collected data. The variables were established according to the
priorities of the European strategy [18] and the literature [1–9].
3.3. Study Variables
For this study, seven variables were selected to assess and analyse road traffic accidents in
Romania. Table 1 presents the variables used for the study, the types of each variable, and the
implications of each variable. Having established these details, the results of the analysis are presented
in Section 3.
Table 1. The variables used in the present study.
Variable Variable Type Variable Implication
Collision mode Between vehicles This variable highlights the severity of accidents
Vehicle and pedestrian according to the number of factors involved
One vehicle in the accident.
Curves
Tunnel
The most important road configurations that are
Intersections
Road configuration involved in road accidents are these types. These are
Bridges
found on all road categories.
Crossing the railway
Alignment
Daylight The intensity of light within a day was considered to
Condition of
Low brightness form the three categories of values for the condition of
occurrence
Darkness an accident occurrence.
Occurred on motorways For this variable, the main values were considered
Road category Occurred in localities depending on the intensification of the use of each
Occurred outside of localities type of road
All vehicle categories were considered as values for this
car, van, bike, moped & motorcycle,
Type of involved variable. The type of vehicle involved in an accident is
animal traction, auto-trailer,
vehicle important for improving the road system on the
intervention vehicle, and lorry/truck
direction of action
Age of the driver The two values for the variable were considered relevant
Personal factors
Gender of the driver for the improvement of the national road system.
Length of time of the The length of time measured in years was considered for
Period of years
driving license the evaluation of this variable.
3.4. Road Safety System Approach
Road safety is very important in every country because it affects the economic and social
dimension of sustainable development [22,23]. Road traffic affects the environmental dimension
of sustainability. Thus, it can be said that transport contributes directly to the sustainable development
of a country [16].
The accelerated development of road traffic, along with the increase in its complexity and the
intensification of drivers, draw/impose/suggest to automotive companies the approach of innovation
in the production process and the increase of the quality of products and services. The action to prevent
the severity of road accidents can be addressed from the perspective of actions that can be developed
within the automotive industry [17].Sustainability 2017, 9, 1530 4 of 15
In this research, the safety of the road system is assessed and improved in three directions:
accident causes, road safety performance indicators, and risk indicators.
3.5. European Road Safety Strategy
The overall objective of the European Union is to reduce the number of road accidents by 50% by
2020. In 2010–2015, the EU recorded a reduction in deaths of only 17%, whereas a 29% decrease was
needed to reach the 2020 target [18]. Efforts in the field of traffic safety need to be intensified globally,
as over 1.2 million people die annually from road accidents. Death from road accidents is the main
cause of mortality among young people aged 15–29, which is why this cause became a priority in the
European strategy for 2030 [18,19].
Globally, depending on the type of road variable, it can be seen from statistics that European
roads remain the safest in the world. At the EU level, in 2016 there were 50 road deaths per million
inhabitants, compared with 174 deaths per million globally [17–19].
In the year 2016, the ascending [19] ranking per country according to the mortality rate for one
million inhabitants highlights: Sweden (27), the United Kingdom (28), the Netherlands (33), Spain (37),
Denmark, Germany (39), Ireland (40), Poland (79), Latvia (80), Romania (97), and Bulgaria (99).
As the European strategy refers to the decrease in the number of accidents, an assessment of the
situation in the different countries shows that some countries have seen a significant decrease in the
number of road deaths, such as: Lithuania (22%), Latvia (16%), and the Czech Republic (16%) [18].
Four EU member states have achieved a decrease in the number of accidents in line with the
general objective: Denmark, Greece, Portugal and Spain. In relation to this objective, Romania recorded
a 19% decrease in deaths by 2016 compared to 2010. Actions and approaches to this end are sustained
at the national level, with real chances for achieving the EU’s overall objective.
The situation of the member states in terms of achieving the overall objective is presented
in Figure 1 according to the data provided by the European Commission [19]. In this situation,
two periods are evaluated: 2015–2016, and 2010–2016. Differences in the number of accidents per
million inhabitants for the two periods are analysed. The result is expressed in percentage terms by
2015 for the period 2015–2016, and by 2010 for 2010–2016. For the period 2015–2016, it is noticed that
Lithuania recorded the largest drop in road deaths per million inhabitants (22%), followed by Latvia (16%).
In the antithesis, the largest increase in road deaths is registered in Malta. In 2016, there were 51 deaths
per million inhabitants, up 20% compared to 2015, when 42 deaths per million inhabitants were
recorded. For this period, 13 member states recorded an increase in the number of deaths per million
inhabitants. This increase is in the range of 1–10%. In this situation, the EU’s general objective can be
achieved only with major investments in the infrastructure and actions of the countries [18,19].
If the 2010–2016 period is analysed, the data provided [19] in Figure 1 show that Portugal has
the largest decrease in deaths per million inhabitants (40%), followed by Lithuania (37%) and Greece
(35%). The largest increase in deaths per million inhabitants is recorded in Malta. This increase is 69%
in 2016 compared with 2010.
At the EU level [18,19,23,24], there are a number of actions and strategies proposed to achieve the
overall objective. European road safety actions are structured in four major directions:
• A well-functioning internal market—harmonisation of transport requirements with infrastructure
and industry capacity.
• Fair competition and workers’ rights—developing a competitive business environment based
on collaboration.
• Reducing greenhouse gas emissions—a 30% reduction in CO2 emissions, as stipulated in the Paris
COP21 agreement.
• Digital technologies—using innovations in the automotive field to increase road safety.Sustainability 2017, 9, 1530 5 of 15
Sustainability 2017, 9, 1530 5 of 15
Percentage change in the number of 80%
60%
40%
20%
fatalities
0%
Cyprus
Austria
Portugal
Romania
Slovakia
Belgium
Czech Republic
Estonia
Latvia
Lithuania
Ireland
Spain
Finland
Denmark
Germany
Greece
Italy
Bulgaria
France
Croatia
Luxembourg
Malta
Slovenia
Sweden
Poland
EU
Hungary
Netherlands[4]
United Kingdom
-20%
-40%
-60%
Country
2015 - 2016 2010 - 2016
Figure1.1.Number
Figure Number ofof road
road deaths
deaths per
per million
million inhabitants
inhabitants in
in the
the period
period 2015–2016
2015–2016and
and2010–2016
2010–2016
expressed as a percentage [19,20].
expressed as a percentage [19,20].
3.6. National Road Safety Strategy
3.6. National Road Safety Strategy
The overall objective of Romania’s national strategy [16,21], which is aligned with the European
The overall objective of Romania’s national strategy [16,21], which is aligned with the European
strategy, is to reduce the number of deaths from road accidents by 50% by 2020, compared with 2010. In
strategy, is to reduce the number of deaths from road accidents by 50% by 2020, compared with 2010.
this respect, it is expected that in 2020 there will be no more than 1188 deaths, compared with the 2377
In this respect, it is expected that in 2020 there will be no more than 1188 deaths, compared with the
deaths registered in 2010. Among the specific objectives formulated in this direction are:
2377 deaths registered in 2010. Among the specific objectives formulated in this direction are:
• Developing a road-safe country for its inhabitants, tourists, and investors by progressively
• Developing
reducing thea number
road-safe country
of road for itsininhabitants,
accidents tourists, and investors by progressively
the period 2016–2020;
• reducing the number of road accidents in the period 2016–2020;
Improving road infrastructure on all road types to reduce the number of road accidents;
• • Improving road infrastructure
Building additional motorwayon all road types
kilometres to reduce
and express thetonumber
roads reduce of
theroad accidents;
number of accidents;
• • Building additional
Operational motorway
coordination kilometres
of integrated and expressthrough
interventions roads tointeroperability
reduce the number of accidents;
and cooperation
• between intervention
Operational services;
coordination of integrated interventions through interoperability and cooperation
• between
Improving the emergency
intervention service by renewing the telecommunications infrastructure;
services;
• • Improving
Implementation of an integrated
the emergency service bysystem of information
renewing and statistical data
the telecommunications for the continuous
infrastructure;
• monitoring of road accidents and related actions;
Implementation of an integrated system of information and statistical data for the continuous
• Continuous improvement of the quality of the emergency medical act and of the
monitoring of road accidents and related actions;
intervention system;
• Continuous improvement of the quality of the emergency medical act and of the
• Carrying out actions to raise road safety awareness among children, adolescents, and students.
intervention system;
• 4. Results
Carrying out actions to raise road safety awareness among children, adolescents, and students.
4. ResultsThis chapter presents the results obtained from the evaluation of the databases considered. The
data are evaluated in the set of variables established and presented in Table 1. These data refer to
road This
andchapter presentsregistered
traffic accidents the results in obtained
Romania. from the evaluation
To support of the of
the presentation databases considered.
road accident data,
Theit is necessary to present the situation of existing road categories at the national level. Romania refer
data are evaluated in the set of variables established and presented in Table 1. These data ownsto
road
86,080andkm traffic accidents
of public roads,registered
of which in747Romania.
km were To supportin
motorway the presentation
2016 (see Table of2). road
Aboutaccident
90% of data,
the
it national
is necessary to present the situation of existing road categories at the national
road network is at the single carriageway road standard, which significantly influences level. Romania owns
86,080
traffickm of public
safety. Table roads, of which
2 presents 747categories
the road km were in motorway
Romania in for2016 (see Table
the period 2). About
2012–2016 90% of the
[20,21].
national It isroad network
noticed is at
that the the single
national roadscarriageway
are upgradedroad standard, which
in proportion of 35%significantly influences
of the total public roads.traffic
The
safety. Table 2 presents the road categories in Romania for the period 2012–2016
county and communal roads require improvements. This presentation of the road situation in Romania [20,21].
It is noticed
is closely relatedthat therecorded
to the national accidents.
roads are The
upgraded in proportion
registered accidents are of 35%
also of the total on
dependent public roads.
the road
The countyand
category, andthecommunal roads require
road performance improvements.
is directly proportional toThis presentation
the quality of the road
of the public roads.situation in
Romania is closely related to the recorded accidents. The registered accidents are also dependent on
the road category, and the road performance is directly proportional to the quality of the public roads.Sustainability 2017, 9, 1530 6 of 15
Table 2. Road categories in Romania [20].
Category of Public Roads Improvement Status UM 2012 2013 2014 2015 2016
Total km 84,185 84,709 85,184 85,920 86,080
Total Upgraded km 27,665 29,166 30,247 32,648 33,928
Motorways km 550 644 683 747 747
Total km 16,887 17,110 17,272 17,606 17,612
National
Upgraded km 15,645 15,956 16,172 16,557 16,600
Total km 67,298 67,599 67,912 68,314 68,468
County and communal
Upgraded km 12,020 13,210 14,075 16,091 17,328
4.1. Road Traffic Accidents Analysis According to the Established Variables
In this section, the data obtained from the database collections used for research are presented [16–21].
Road and traffic accidents are assessed based on the established variables. These data are analysed
and evaluated in the discussion section.
4.1.1. Collision Mode
This section presents the data on the three types of collisions that may occur in road accidents:
collisions between vehicles, collisions between a vehicle and a pedestrian, and collisions involving
only one vehicle. Table 3 presents road traffic accidents causing bodily injury by their nature and how
they occurred [18–21]. It can be seen that collisions between vehicles account for over 40% of the total
number of accidents recorded. Total accidents registered a decrease in the period 2013–2014, after which
the number of accidents increased. Taking 2010 as the reference year, which is also a reference year for
the European reports (regarding the achievement of the general objective), it is noticed that in 2013
there is a 4.5% decrease in the number of accidents. The largest increase is recorded in 2016, an increase
of 12%. The variance between accidents in 2016 is +8.1% compared with 2012.
Table 3. Situation of road accidents depending on how they occurred [20].
Collision Mode 2012 2013 2014 2015 2016 Variation (%) 2012–2016
Collisions between vehicles 11,932 11,128 11,432 13,540 13,690 +14.7%
Collisions between a vehicle and a pedestrian 8791 8301 8576 8995 9010 +2.4%
Collisions involving only one vehicle 6205 5398 5347 6409 6423 +3.5%
Total 26,928 24,827 25,355 28,944 29,123 +8.1%
Dynamics compared to 2010, year 2010 = 100% +3.5% −4.5% −2.5% +11.3% +12% -
4.1.2. Road Configuration
From the road configuration perspective, the main types of road accidents are road alignment
(71%), curves (18%), and intersections (9%). Table 4 presents the situation of deaths and injuries
according to the characteristics of the road for 2016 [20,21]. The 2012–2016 period is taken into account.
In 2012, there were 36,251 accidents, which included 2042 deaths and 34,209 injuries. For 2016, there is
a 6.7% increase in incidents.
Table 4. Situation of deaths and the number of injuries depending on road configuration [20].
Characteristic No. of Deaths No. of Injured
Curves 2353 8917
Tunnel 16 82
Intersections 1135 8405
Bridges 117 330
Crossing the railway 147 135
Alignments 9144 33,653
Total 12,912 51,522Sustainability 2017, 9, 1530 7 of 15
4.1.3. Conditions of Occurrence
The situation of accidents according to the occurrence conditions is presented in Table 5 [18–21].
The process conditions of the accidents considered for the assessment are: daylight, low light,
and darkness. The highest number of road accidents is recorded during the day (that is daylight).
Darkness brings the least road accidents for the entire analysed period 2012–2016. The total accident
rate variation in 2016 compared to 2012 is +8.1%.
Table 5. Situation of road accidents depending on occurrence conditions [20].
Conditions of Accident Occurrence 2012 2013 2014 2015 2016 Variation (%) 2012–2016
Daylight 18,866 17,494 18,012 20,768 21,121 +11.9%
Low brightness 5677 5167 5152 5770 5801 +2.1%
Darkness 2385 2166 2191 2406 2201 +7.8%
Total 26,928 24,827 25,355 28,944 29,123 +8.1%
4.1.4. Road Category
Depending on the road category, the registered accidents are evaluated within the three categories
of accidents produced on motorways, in the locality and outside the locality [20,21]. These accidents
are presented in Table 6. It is noticed that most accidents are produced in the locality, followed by
those outside the locality. The density of road accidents in relation to km of motorway shows a value
between 3.71–4.73. Accidents in localities show an increase of 11% compared with 2012. The period
2013–2014 is one that has a decrease in the number of accidents. Starting with 2015, the number of
accidents increases considerably. This is due to the increase in the number of vehicles by 12% in
2015 compared with 2012. In 2015, there were 6,600,325 registered vehicles, and in 2012 there were
5,710,773 registered vehicles.
Table 6. Situation of road accidents according to the place of occurrence [20].
The Place Where Accidents Occur 2012 2013 2014 2015 2016 Variation (%) 2012–2016
Occurred on motorways 131 136 129 175 201 +53%
Occurred in localities (excluding motorways) 22,108 20,541 21,080 23,921 24,568 +11.12%
Occurred outside of localities (excluding motorways) 4689 4150 4146 4848 4354 −7.2%
Total 26,928 24,827 25,355 28,944 29,123 +8.2%
Km of motorway 550 644 683 747 747 +35.8%
Density of road accidents reported per km of motorway 4.19 4.73 5.29 4.26 3.71 +14.5%
During the analysed period, there were decreases in accidents on the streets and county roads,
and increases in the accidents on the communal roads and other categories of roads [20]. The death
rate on national roads is higher than the average for all other categories. At the national level in
2016, the death rate for national roads was 0.09 per km compared with the average of 0.04 per km for
all roads. The variation of the road accidents according to the place of production is +8.2% taking into
account the years 2012 and 2016.
4.1.5. Type of Vehicle Involved
The Romanian motor vehicle fleet increased by 21.8% in 2015 compared with 2010. One third of
the cars registered in Romania are over 15 years old. In the year 2016, the trend of cars is an upward
one, with the fleet registering more vehicles older than 10 years [20,21].
An important part of this variable is bicyclists and small vehicles (moped, motorcycle). The types of
variables considered in this analysis are: car, van, bicycle, moped and motorcycle, animal traction,
auto-trailer, intervention vehicle, and lorry/truck. Vehicle typology is presented in Table 7 [20,21].
Since the number of bicycles is increasing [20] as a result of various actions related to sustainable
development, the number of accidents involving bicycles is considerable, and 19–27% of the bicycleSustainability 2017, 9, 1530 8 of 15
accidents involve cars. The fewest accidents are registered for auto-trailers, intervention vehicles,
and lorries/trucks.
Table 7. Typology of vehicles involved in road accidents in 2012–2016 [20].
Variable Type 2012 2013 2014 2015 2016 Variation (%) 2012–2016
Car 4427 3590 3470 4511 4670 +5.4%
Van 570 636 726 732 756 +32%
Bicycle 634 858 944 912 898 +41%
Moped & Motorcycle 860 598 559 560 589 −32%
Animal traction 258 245 212 260 273 +5.8%
Auto-trailer 82 151 139 142 147 +79%
Intervention vehicle 38 34 48 52 54 +42%
Lorry/truck 23 47 40 43 47 +104%
4.1.6. Personal Factors
Personal factors considered for assessing the trend of road accidents and for identifying risk
factors are the driver’s age and sex.
These types were chosen for the “personal factors” variable because it was found [20–25] to be the
most important data for road accident analysis.
A. Driver’s age
From the perspective of personal factors, the distribution by age groups of drivers is presented
in Table 8 [20,21]. According to data provided by the Romanian Police, people over 65 have the highest
risk of death. This share in total road deaths is higher than the share of total population (21.4% vs.
15.4% of the population). This distribution refers to serious traffic accidents for which the offense has
been established by the competent authorities. Most accidents occur in the 26–35 years and 36–45 years
categories. According to the data provided by NIS, these age classes drive most vehicles. We chose to
analyse the years 2012 and 2016 because there are no relevant data for the years 2013, 2014, and 2015.
Table 8. Situation of accidents by age category [20].
2012 2016
Age Category
Involved Involved with Guilt Involved Involved with Guilt
75 71 56 82 58
B. Gender of the driver
Depending on the gender of the vehicle driver, Table 9 lists fatalities and serious injuries [20].
From the data, men are involved in 75% of deaths and 65% of serious injuries. For 2016, data on deaths
and injuries are not public. There were about 7.14 million people holding a valid driving license and
registered in Romania on 31 December 2016, of whom 4.84 million were men.Sustainability 2017, 9, 1530 9 of 15
Table 9. Deaths and serious injuries by sex [20].
Deaths Serious Injuries
Year
Masculine Feminine Masculine Feminine
2012 1542 500 5783 3077
2013 1374 487 5164 2994
Sustainability 2017, 9, 1530 2014 1361 457 5204 2918 9 of 15
2015 1356 455 5197 2903
4.1.7. Length of Time of 2016
the Driving- License - - -
Regarding
4.1.7. Length the length
of Time of theofDriving
time since
Licenseobtaining the driving license [20], most accidents are
produced by drivers with one-year-old driving licenses. They are followed by those who have six-year-
Regarding the length of time since obtaining the driving license [20], most accidents are produced
old driving licenses. One-year-old drivers are involved in road accidents on all road categories. The
by drivers with one-year-old driving licenses. They are followed by those who have six-year-old driving
frequency of involvement in road accidents is higher with less experienced drivers [20,21].
licenses. One-year-old drivers are involved in road accidents on all road categories. The frequency of
involvement in road accidents is higher with less experienced drivers [20,21].
4.2. Case Study: Assessing Accidents on a Road Section
4.2. Case Study: Assessing Accidents on a Road Section
For this case study, we have selected two roadways located in the Western Region of Romania.
These road Forsections
this caselink
study,thewetwo
have selected
cities two roadways
of Timisoara locatedOne
and Arad. in the
ofWestern Region of
these sections is Romania.
composed of
These road sections link the two cities of Timisoara and Arad. One of these
national and European roads, and the second is the A1 motorway. These road sections are identifiedsections is composed of
withnational
the most and European
severe roads, and
accidents, andthethesecond
causes is of
theaccidents
A1 motorway.
and These road sections
risk indicators areare identified
assessed. These
with the most severe accidents, and the causes of accidents and risk indicators are assessed. These road
road sections connect two major cities in the West of Romania.
sections connect two major cities in the West of Romania.
The connection between the two cities, Timisoara and Arad, can be covered via DN69/E671
The connection between the two cities, Timisoara and Arad, can be covered via DN69/E671
(58.80 km) or Via A1 (58.60 km). The Timisoara–Arad motorway section was put into operation in
(58.80 km) or Via A1 (58.60 km). The Timisoara–Arad motorway section was put into operation in
December
December 2011 and
2011 andhas
has aa length
lengthofof 38.9
38.9 km.km. The difference
The difference is that
is that this this
section sectionbyisthe
is covered covered
European by the
European
national national road DN69/E671.
road DN69/E671. According According to the data
to the data provided provided
by Google Maps, by the Google Maps,
time duration the time
is close
duration
for theistwo
close for This
routes. the istwo routes.
because This is because
the European the European
national road national
to the highway road
entrance to the
is very highway
crowded.
entrance is very
It takes aboutcrowded. It takes
20 km to enter theabout 20 km
highway. It istoappreciated
enter the highway.
that on thisIt 20-km
is appreciated
portion, the that on this 20-
running
speed is below
km portion, 40–50 km/h.
the running speed In order to investigate
is below 40–50 km/h. whether
In there
orderaretodifferent risk factors
investigate whether for injury,
there are
two types of roads were considered (national/European and motorway).
different risk factors for injury, two types of roads were considered (national/European These road sections are and
shown inThese
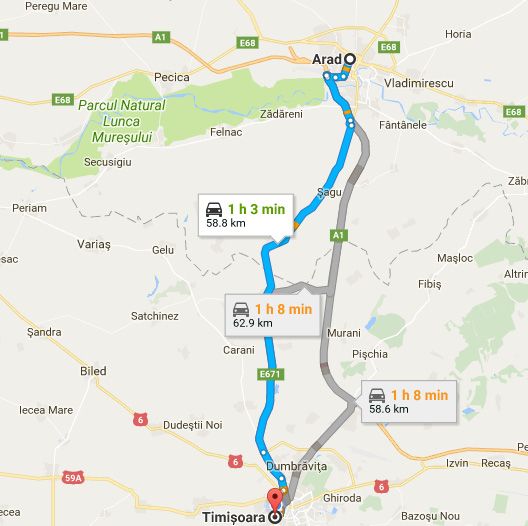
motorway). Figureroad
2. sections are shown in Figure 2.
(a) (b)
Figure 2. Roadway
Figure 2. Roadwaychosen for
chosen for studying
studying Timisoara—Arad:
Timisoara—Arad: (a) thenational
(a) the European European national
road (via road (via
DN69/E671);
DN69/E671);
(b) the A1(b) the A1 motorway
motorway (Google Maps (Google Maps capture).
capture).
The accidents that occurred on these road sections were analysed from the perspective of the
variables used and data analysis for 2012–2016. In addition to these variables, the severity of the
impact was used to identify whether the accident resulted in deaths or injuries only. The data
provided by the Romanian Police were used to assess accidents. The analysis period is 2016 onSustainability 2017, 9, 1530 10 of 15
The accidents that occurred on these road sections were analysed from the perspective of the
variables used and data analysis for 2012–2016. In addition to these variables, the severity of the impact
was used to identify whether the accident resulted in deaths or injuries only. The data provided by
the Romanian Police were used to assess accidents. The analysis period is 2016 on accidents declared
publicly [20,21]. For the two variants of the section, 50 accidents were randomly considered that
took place at different times of the year. The following are the results obtained [20,21] according to
the evaluation:
A. European national road via DN69/E671
• Type of collision: 70% of the accidents occurred as a result of collision between two cars, and 20%
as a result of collision with road furniture.
• Road configuration: 90% of road accidents were caused by road alignment.
• Conditions of occurrence: 45% of accidents occurred in daylight, and 35% in low light.
• Road category: 30% in localities and 70% outside localities.
• Vehicle type involved: 65% cars, 45% animal traction, 55% bicycles. In this variable, it was considered
that in an accident where there may be a collision between a car and a vehicle with animal traction,
taking into account both variants is considered in the expressed percentage.
• Personal factors: most accidents have been committed by drivers in the following age categories:
26–35, 36–45, and over 56 years. In the situation of collisions with animal traction vehicles,
the driver’s age is over 56 years.
• Driving license length of time: one year and over six years. In vehicles with animal traction,
the experience cannot be accurately determined (the duration of use is over 15 years of use of
the vehicle).
B. A1 motorway
• Type of collision: 95% of accidents occurred as a result of collision between two cars and 5% as
a result of collision with road furniture.
• Road configuration: 60% of road accidents were caused by road alignment, 40% due to
non-compliance with the role of the emergency lane.
• Conditions of occurrence: 85% of accidents occurred in the daylight.
• Road category: 100% outside localities.
• The type of vehicle involved: 65% cars, 55% intervention vehicles, 50% auto-trailers and 35%
lorries/trucks. In this variable, it was considered that in an accident there may be a collision
between a car and a truck, taking into account both variants in the expressed percentage.
• Personal factors: most accidents were committed by drivers in the following age categories: 26–35,
46–55, and 56–65 years. The age of drivers of trucks, auto-trailers and intervention vehicles is in
the 56–65 years category.
• Driving license length of time: over six years. The driver’s duration of use for trucks, auto-trailers,
and intervention vehicles is over 10 years.
4.3. The Performance of the Romanian Road System and the Risk Factors
This subchapter identifies road safety performance indicators, risk indicators, and causes of
accidents. The causes and indicators are identified based on road accidents assessment (see Section 3.1)
and the case study from the Western Region of Romania (see Section 3.2). In order to create a complete
picture of road transport in Romania, it is necessary to analyse the most important performance
indicators that contribute to the competitiveness of the road system.
Road safety performance indicators highlight those optimal operating conditions of the road traffic
system that influence system security performance and serve as evaluation tools [20,21]. It is noted [23–31]
that the following are among the most important performance indicators:Sustainability 2017, 9, 1530 11 of 15
• Daytime usage of low beam light on all road categories—using daytime low beam lights helps
reduce the number of accidents.
• The degree of use of seatbelts on all road categories—the percentage of use of seatbelts on
motorway roads is more than one third higher than the one on national/European roads.
• Average running speeds—average running speed for vehicles is 33 km/h in localities, 66 km/h
on national/European roads, and 124 km/h on motorways.
• The number of kilometres covered annually—cars register up to 15,000 km a year, heavy vehicles
about 35,000 km, buses 50,000 km.
• The current state of the auto fleet in Romania has seen a considerable increase in vehicles over
10 years old over the last 10 years.
• Vehicle equipment contributes to driving performance on all road categories due to the comfort
and special features offered to the driver (lane keep assist, rain sensors, driver fatigue warning, etc.).
All exposures related to road accidents that contribute to the emergence of risks to human health
should be considered risk factors. The risk factors [26–31] that are required to be monitored in a safe
road system are:
• The driver’s behaviour, including: individual risk factors, administered drugs, tiredness, lack of
experience, drink, hearing and visual impairment, the use of mobile phones, distributional
attention, health status, and more.
• Vulnerable road traffic subjects include: pedestrian behaviour, unattended children, and older
road users.
• Protective behaviours, including all tools that help reduce the likelihood of a road accident.
• Environment, including all attributes related to the environment, road condition, and other
adjacent elements.
The causes of accidents [18–21,31,32] are directly proportional to the variables analysed in this
paper. The most important causes of accidents include: infrastructure (the reduced number of km of
motorway), vehicle state (Romania fleet has grown in recent years, and vehicle age is over 10 years),
and personal experience (which is different from one driver to another). A description of these causes
by category of road is presented in Table 10. These data refer to the year 2016.
Table 10. The main causes of road accidents by category of road [20].
Road Category The Main Cause Percentage Cause/Road Type
Street No priority to pedestrians 21%
No priority to vehicles 15%
Unlawful crossing of pedestrians 23%
Bicycle rider’s deviations 12%
National road Speed not adapted to road conditions 25%
The irregular crossing of pedestrians 13%
Non-regulatory overtaking 10%
County Road Speed not adapted to road conditions 30%
The irregular crossing of pedestrians 15%
Bicycle rider’s deviations 10%
Communal road Bicycle rider’s deviations 25%
Speed not adapted to road conditions 18%
Deviations of the drivers of animal traction vehicles 13%
Motorway Failure to observe the distance between vehicles 25%
Speed not adapted to road conditions 20%
Attention distraction with other activities 15%Sustainability 2017, 9, 1530 12 of 15
It is important to monitor and improve the road performance indicators in order to reduce risk
factors, address the causes of risk, contribute to increasing road safety, and achieve the EU’s objective
of reducing road traffic accidents by 50% by 2020 compared with 2010 [31,32].
4.4. Improvement of Road Safety System
Following the analysis (see Sections 3.1–3.3), the road safety system can be improved.
These improvements are related to the driver, vehicle, and road safety specialist. This proposal
isSustainability
presented2017, 9, 1530 3.
in Figure 12 of 15
.
Figure3.3. The
Figure The proposed
proposedframework
frameworkfor
forimproving
improvingthe
theroad
roadsafety
safetysystem.
system.
5. Discussion
This proposal focuses on a series of elements of compulsory systematisation in the form of
a pyramid on which four areas are concerned: EU objective, Risk management, Road safety education,
Within this chapter, the results obtained in the previous section are discussed (see Section 3).
and Law.
Discussions are structured on the addressed topics and supported by arguments:
For the pyramid, there is an analogy with Maslow’s Pyramid [33], which requires a series of
• In termsneeds.
fundamental of collision type,of47%
In the case this of road accidents
proposal, there areoccur
vehicleasand
a result of collision
infrastructure between
needs. vehicles.
If these needs
This is also supported by studies conducted in this respect [27–33].
are met, the security level is passed to the next level by awareness of the human factor. The last level
• needs
that Curves to are the cause
be met is thatofofthe
safe most accidents
speeds adapted when considering
to previous needs.theThis
roadpyramidal
configuration.
systemThus,
acts2353
on
deaths
the four areasandthat8917 injuriesto
contribute were
the recorded in the year
competitiveness 2016.
of the road system, and to the reduction of road
• traffic
and During the entire analysed period, accidents occurring in the daylight are those that occur most
risks.
frequently. The number of road accidents according to the configuration in 2012 is 26,928, and
5. Discussion
in 2013 and 2014 there was a decrease in the number of accidents. However, in 2015, these kinds
of accidents
Within becomethe
this chapter, more frequent
results again.inInthe
obtained studies [28–30],
previous Wells,
section are Mikulik,
discussedZhao, daylight3).
(see Section is
an important
Discussions factor inon
are structured monitoring
the addressed roadtopics
safety.and supported by arguments:
• The number of accidents caused by motor vehicles is in the range of +5.4% in 2016 compared
• with
In 2012.
terms of The number
collision of accidents
type, 47% of road is increasing
accidents over
occurtheaslast two years
a result as a result
of collision of overcoming
between vehicles.
the impact
This of the economic
is also supported by studiescrisisconducted
and the increase in the [27–33].
in this respect number of vehicles in the Romanian
• fleet [20,31].
Curves are the cause of the most accidents when considering the road configuration. Thus, 2353 deaths
• andMore than
8917 60% of
injuries serious
were accidents
recorded in thetookyearplace
2016.on national roads and streets, resulting in three
• quarters of the number of serious injuries
During the entire analysed period, accidents occurring and deaths. in the daylight are those that occur most
• frequently.
Drivers aged between 26 and 45 are involved
The number of road accidents according in most road
to the accidents. From
configuration in 2012the
is perspective
26,928, and inof
gender, men are involved in 75% of road accidents. Studies show that women exhibit balanced
behaviour leading to a decrease in the number of their implication [30–35].
• Most accidents are caused by low-skilled drivers, with less than six years of driving experience.
The length time of the driving license highlights that human experience contributes to increasing
positive results [34–36].Sustainability 2017, 9, 1530 13 of 15
2013 and 2014 there was a decrease in the number of accidents. However, in 2015, these kinds of
accidents become more frequent again. In studies [28–30], Wells, Mikulik, Zhao, daylight is an
important factor in monitoring road safety.
• The number of accidents caused by motor vehicles is in the range of +5.4% in 2016 compared
with 2012. The number of accidents is increasing over the last two years as a result of overcoming
the impact of the economic crisis and the increase in the number of vehicles in the Romanian
fleet [20,31].
• More than 60% of serious accidents took place on national roads and streets, resulting in three
quarters of the number of serious injuries and deaths.
• Drivers aged between 26 and 45 are involved in most road accidents. From the perspective of
gender, men are involved in 75% of road accidents. Studies show that women exhibit balanced
behaviour leading to a decrease in the number of their implication [30–35].
• Most accidents are caused by low-skilled drivers, with less than six years of driving experience.
The length time of the driving license highlights that human experience contributes to increasing
positive results [34–36].
• 55% of the injuries produced on DN69/E671 resulted in the death of at least one person.
• 85% of the accidents produced on the A1 motorway resulted in the death of at least one person.
• It is seen from the literature that physical and mental health influence the number of accidents.
• By properly monitoring the health status of drivers, the number of accidents could be lower.
• Road quality and country strategy contribute to improving road performance and safety.
Road safety performance indicators provide the best conditions for safe traffic. The assessment of
these factors contributes to increasing safety and reducing the impact of risk indicators [37,38].
Risk indicators are presented to highlight the importance of risk management in the field of road
safety [39–41]. It can be concluded that through improved risk management, the road safety system in
Romania can be greatly improved. Under these circumstances, the EU target of 50% reduction in road
accidents by 2020 compared to 2010 can be achieved.
Achieving the EU objective contributes to the alignment of the country with European standards
and requirements, and to the sustainable development of the country [18,19].
6. Conclusions
The progressive reduction in the number of road accidents in the period 2016–2020, the central
objective of the strategy, is at the same time the main result that can be expected from the sustainable
development of a country. Sustainable development of an entity should consider the assessment of all
risks and activities related to the human factors.
Most road accidents are caused by human behaviour with certain deficiencies. That’s why its
correction is of great importance. In Romania, a considerable number of road accidents are due to
personal factors. To improve the current situation, the national road safety and security strategy must
include infrastructure investments and raise awareness for the drivers of the importance of physical
and mental health monitoring.
The limitations of this study refer to the fact that the data used was taken from the European
Commission [18,19], the National Institute of Statistics (NIS) in Romania [20], and the Romanian
Police [21], and these represent the data declared by authorised institutions.
Acknowledgments: This work have been partially funded by the Project financed from Lucian Blaga University
of Sibiu research grants LBUS-IRG-2016-02.
Author Contributions: All authors contributed equally to the research presented in this paper and to the
preparation of the final manuscript.
Conflicts of Interest: The authors declare no conflict of interest.Sustainability 2017, 9, 1530 14 of 15
References
1. Savolainen, P.; Mannering, F.; Lord, D.; Quddus, M. The statistical analysis of highway crash-injury severities:
A review and assessment of methodological alternatives. Accid. Anal. Prev. 2011, 43, 1666–1676. [CrossRef]
[PubMed]
2. Kumar, S.; Toshniwal, D. A data mining framework to analyze road accident data. J. Big Data 2015, 2, 2–26.
[CrossRef]
3. Yannis, G.; Papadimitriou, E.; Chaziris, A.; Broughton, J. Modelling road accident injury under-reporting in
Europe. Eur. Trans. Res. Rev. 2014, 6, 425–438. [CrossRef]
4. Bin Islam, M.; Kanitpong, K. Identification of factors in road accidents through in-depth accident analysis.
IATSS Res. 2008, 32, 58–67. [CrossRef]
5. Karlaftis, M.; Tarko, A. Heterogeneity considerations in accident modelling. Accid. Anal. Prev. 1998, 30,
425–433. [CrossRef]
6. Pardillo-Mayora, J.M.; Domínguez-Lira, C.A.; Jurado-Pina, R. Empirical calibration of a roadside
hazardousness index for Spanish two-lane rural roads. Accid. Anal. Prev. 2010, 42, 2018–2023. [CrossRef]
[PubMed]
7. Shankar, V.; Mannering, F.; Barfield, W. Statistical analysis of accident severity on rural freeways. Accid. Anal. Prev.
1996, 28, 391–401. [CrossRef]
8. Yau, K.K.W. Risk factors affecting the severity of single vehicle traffic accidents in Hong Kong. Accid. Anal. Prev.
1996, 36, 333–340. [CrossRef]
9. Alonso, F.; Esteban, C.; Sanmartín, J.; Useche, S. Reported prevalence of health conditions that affect drivers.
Cogent Med. 2017, 4, 1303920. [CrossRef]
10. Lal, S.K.L.; Craig, A. A critical review of the psychophysiology of driver fatigue. Biol. Psychol. 2001, 55,
173–194. [CrossRef]
11. Russo, F.; Biancardo, S.A.; Dell’Acqua, G. Road safety from the perspective of driver gender and age as
related to the injury crash frequency and road scenario. Traffic Inj. Prev. 2014, 15, 25–33. [CrossRef] [PubMed]
12. Useche, S.; Gómez, V.; Cendales, B. Stress-related Psychosocial Factors at Work, Fatigue, and Risky Driving
Behavior in Bus Rapid Transport (BRT) Drivers. Accid. Anal. Prev. 2017, 104, 106–114. [CrossRef] [PubMed]
13. Westerman, S.J.; Haigney, D. Individual differences in driver stress, error and violation. Pers. Indiv. Diff. 2000,
29, 981–998. [CrossRef]
14. Wåhlberg, A.E. Some methodological deficiencies in studies on traffic accident predictors. Accid. Anal. Prev.
2003, 35, 473–486. [CrossRef]
15. Ratanavaraha, V.; Suangka, S. Impacts of accident severity factors and loss values of crashes on expressways
in Thailand. IATSS Res. 2014, 37, 130–136. [CrossRef]
16. Cioca, L.-I.; Ivascu, L.; Rada, E.-C.; Torretta, V.; Ionescu, G. The study of sustainable development and
technological impact on co2 reducing conditions: Case study of Romania. Sustainability 2015, 7, 1637–1650.
[CrossRef]
17. Ambrus, R.; Izvercian, M.; Ivascu, L.; Artene, A. The link between competitiveness and sustainability of
enterprises. In Proceedings of the 4th BE-ci International Conference on Business & Economics, Brno, Cehia,
9–10 January 2017.
18. European Commission. Road Safety: New Statistics Call for Fresh Efforts to Save Lives on EU Roads.
Available online: http://europa.eu/rapid/press-release_IP-16-863_en.htm (accessed on 20 May 2017).
19. European Commission. A Road Transport Strategy for Europe. Available online: https://ec.europa.eu/
transport/road_safety (accessed on 20 May 2017).
20. National Institute of Statistics (NIS). Economic Statistics—Transportation. Available online: http://statistici.
insse.ro/shop/?lang=en (accessed on 10 May 2017).
21. Traffic Police. Statistics. Available online: https://www.politiaromana.ro/ro/structura-politiei-romane/
unitati-centrale/directia-rutiera/statistici (accessed on 10 May 2017).
22. Salata, F.; Golasi, I.; Bombelli, E.; de Lieto Vollaro, E.; Nardecchia, F.; Pagliaro, F.; Gugliermetti, F.;
de Lieto Vollaro, A. Case Study on Economic Return on Investments for Safety and Emergency Lighting in
Road Tunnels. Sustainability 2015, 7, 9809–9822. [CrossRef]Sustainability 2017, 9, 1530 15 of 15
23. Ladeira, R.M.; Malta, D.C.; Morais, O.L.; Montenegro, M.M.; Soares, A.M.; Vasconcelos, C.H.; Mooney, M.;
Naghavi, M. Road traffic accidents: Global Burden of Disease study, Brazil and federated units, 1990 and 2015.
Rev. Bras. Epidemiol. 2015, 3, 157–170. [CrossRef]
24. Carozzi, S.; Elorza, M.E.; Moscoso, N.S.; Ripari, N.V. Methodologies for estimating the indirect costs of
traffic accidents. Rev. Med. Inst. Mex. Seguro Soc. 2017, 55, 441–451. [PubMed]
25. Jama, H.H.; Grzebieta, R.H.; Friswell, R.; McIntosh, A.S. Characteristics of fatal motorcycle crashes into
roadside safety barriers in Australia and New Zealand. Accid. Anal. Prev. 2011, 43, 652–660. [CrossRef]
26. Soehodho, S. Public transportation development and traffic accident prevention in Indonesia. IATSS Res.
2017, 40, 76–80. [CrossRef]
27. Steenberghen, T.; López, E. Overcoming barriers to the implementation of alternative fuels for road transport
in Europe. J. Clean. Prod. 2008, 16, 577–590. [CrossRef]
28. Wells, P. Deaths and injuries from car accidents: An intractable problem? J. Clean. Prod. 2007, 15, 1116–1121.
[CrossRef]
29. Mikulik, J. Road accidents in the Czech Republic. IATSS Res. 2009, 33, 72–74. [CrossRef]
30. Zhao, S. Road accidents in the China. IATSS Res. 2009, 33, 75–79. [CrossRef]
31. Dalla Chiara, B.; Pellicelli, M. Sustainable road transport from the energy and modern society points of view:
Perspectives for the automotive industry and production. J. Clean. Prod. 2016, 133, 1283–1301. [CrossRef]
32. Tähkämö, L.; Halonen, L. Life cycle assessment of road lighting luminaires—Comparison of light-emitting
diode and high-pressure sodium technologies. J. Clean. Prod. 2015, 93, 234–242. [CrossRef]
33. Feniser, C.; Burz, G.; Mocan, M.; Ivascu, L.; Gherhes, V.; Otel, C.C. The Evaluation and Application of the
TRIZ Method for Increasing Eco-Innovative Levels in SMEs. Sustainability 2017, 9, 1125. [CrossRef]
34. Chubukov, A.; Kapitanov, V.; Monina, O.; Silyanov, V.; Brannolte, U. Simulation of regional mortality rate in
road accidents. Trans. Res. Proc. 2017, 20, 112–124. [CrossRef]
35. Cheng, A.S.K.; Liu, P.Y.; Tulliani, N. Relationship between driving-violation behaviours and risk perception
in motorcycle accidents. Hong Kong J. Occup. Ther. 2015, 25, 32–38. [CrossRef]
36. Torretta, V.; Rada, E.C.; Schiavon, M.; Viotti, P. Decision support systems for assessing risks involved in
transporting hazardous materials: A review. Saf. Sci. 2017, 92, 1–9. [CrossRef]
37. Vilela da Silva, L.O.; Braga, M.G.C. Violent events on the road: Risk perception of traffic-related and non
traffic-related situations. Accid. Anal. Prev. 2017, 2. [CrossRef] [PubMed]
38. Ivascu, L.; Cioca, L.-I. Opportunity Risk: Integrated Approach to Risk Management for Creating Enterprise
Opportunities. In Proceedings of the 2nd International Conference on Psychology, Management and Social
Science, Shenzhen, China, 23–24 January 2014.
39. Korchagin, V.; Ljapin, S.; Rizaeva, J.; Konovalova, V. Subsystem of road accident consequences elimination.
methodology of subsystem efficiency improvement. Trans. Res. Proc. 2017, 20, 316–320. [CrossRef]
40. Cioca, L.I.; Moraru, R.I. The importance of occupational health and safety in the framework of corporate
social responsibility. Manag. Sustain. Dev. 2010, 2, 71–77.
41. Cioca, M.; Cioca, L.I.; Buraga, S.C. Spatial [Elements] decision support system used in disaster management.
In Proceedings of the IEEE International Conference on Digital Ecosystems and Technologies, Cairns,
Australia, 21–23 February 2007; p. 235.
© 2017 by the authors. Licensee MDPI, Basel, Switzerland. This article is an open access
article distributed under the terms and conditions of the Creative Commons Attribution
(CC BY) license (http://creativecommons.org/licenses/by/4.0/).You can also read