Estimating the change in soccer's home advantage during the Covid-19 pandemic using bivariate Poisson regression
←
→
Page content transcription
If your browser does not render page correctly, please read the page content below
Noname manuscript No.
                                           (will be inserted by the editor)

                                           Estimating the change in soccer’s home advantage during the
                                           Covid-19 pandemic using bivariate Poisson regression

                                           Luke S. Benz · Michael J. Lopez
arXiv:2012.14949v1 [stat.AP] 29 Dec 2020

                                           Received: date / Accepted: date

                                           Abstract In wake of the Covid-19 pandemic, 2019-2020 soccer seasons across the world were
                                           postponed and eventually made up during the summer months of 2020. Researchers from a variety
                                           of disciplines jumped at the opportunity to compare the rescheduled games, played in front of
                                           empty stadia, to previous games, played in front of fans. To date, most of this post-Covid soccer
                                           research has used linear regression models, or versions thereof, to estimate potential changes to the
                                           home advantage. But because soccer outcomes are non-linear, we argue that leveraging the Poisson
                                           distribution would be more appropriate. We begin by using simulations to show that bivariate
                                           Poisson regression (Karlis and Ntzoufras, 2003) reduces absolute bias when estimating the home
                                           advantage benefit in a single season of soccer games, relative to linear regression, by almost 85
                                           percent. Next, with data from 17 professional soccer leagues, we extend bivariate Poisson models
                                           estimate the change in home advantage due to games being played without fans. In contrast to
                                           current research that overwhelmingly suggests a drop in the home advantage, our findings are
                                           mixed; in some leagues, evidence points to a decrease, while in others, the home advantage may
                                           have risen. Altogether, this suggests a more complex causal mechanism for the impact of fans on
                                           sporting events.
                                           Keywords Bivariate Poisson · Soccer · Home Advantage · Covid-19

                                           1 Introduction

                                           Why do home teams in sport win more often than visiting teams? Researchers from, among other
                                           disciplines, psychology, economics, and statistics, have long been trying to figure that out.1

                                           Luke Benz
                                           Medidata Solutions, Inc.
                                           E-mail: lukesbenz@gmail.com
                                           Michael Lopez
                                           National Football League, Skidmore College
                                           E-mail: Michael.Lopez@nfl.com
                                            1 Initial research into the home advantage included, among other sources, Schwartz and Barsky (1977); Courneya

                                           and Carron (1992) and Nevill and Holder (1999). Works in psychology (Agnew and Carron, 1994; Unkelbach and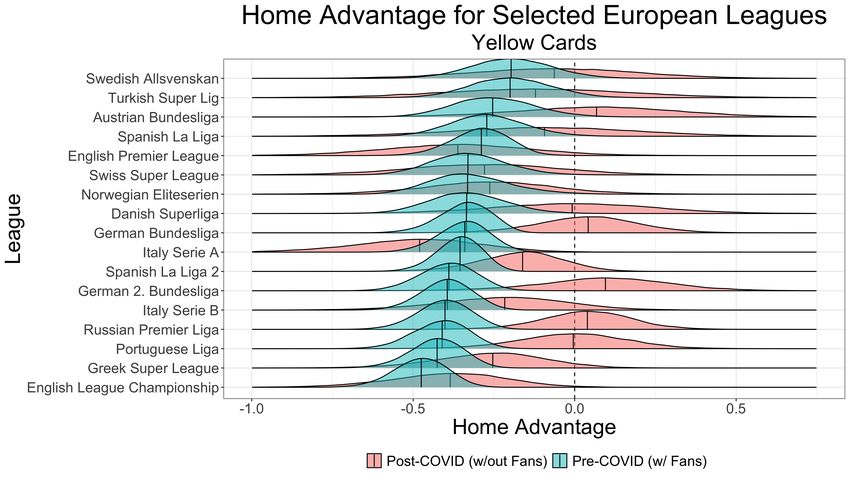
2                                                                              Luke S. Benz, Michael J. Lopez

    One popular suggestion for the home advantage (HA) is that fans impact officiating (Moskowitz
and Wertheim, 2012). Whether it is crowd noise (Unkelbach and Memmert, 2010), duress (Buraimo
et al., 2010; Lopez, 2016), or the implicit pressure to appease (Garicano et al., 2005), referee decision-
making appears cued by factors outside of the run of play. If those cues tend to encourage officials
to make calls in favor of the home team, it could account for some (or all) of the benefit that teams
receive during home games.
    A unique empirical approach for understanding HA contrasts games played in empty stadia to
those played with fans, with the goal of teasing out the impact that fans have on HA. If fans impact
referee decision making, it stands that an absence of fans would decrease HA. As evidence, both
Pettersson-Lidbom and Priks (2010) (using Italian soccer in 2007) and Reade et al. (2020) (two
decades of European soccer) found that games without fans resulted in a lower HA.
    The Coronavirus (Covid-19) pandemic resulted in many changes across sport, including the
delay of most 2019-2020 soccer seasons. Beginning in March of 2020, games were put on pause,
eventually made up in the summer months of 2020. Roughly, the delayed games account for about
a third of regular season play. Make-up games were played as “ghost games” – that is, in empty
stadia – as the only personnel allowed at these games were league, club, and media officials. These
games still required visiting teams to travel and stay away from home as they normally would, but
without fans, they represent a natural experiment with which to test the impact of fans on game
outcomes.
    Within just a few months of these 2020 “ghost games”, more than 10 papers have attempted
to understand the impact that eliminating fans had on game outcomes, including scoring, fouls,
and differences in team performances. The majority of this work used linear regression to infer
causal claims about changes to HA. By and large, research overwhelmingly suggests that the home
advantage decreased by a significant amount, in some estimates by an order of magnitude of one-
half (McCarrick et al., 2020). In addition, most results imply that the impact of no fans on game
outcomes is homogeneous with respect to league.
    The goal of our paper is to expand the bivariate Poisson model (Karlis and Ntzoufras, 2003)
in order to tease out any impact of the lack of fans on HA. The benefits of our approach are
plentiful. First, bivariate Poisson models consider home and visitor outcomes simultaneously. This
helps account for correlations in outcomes (i.e, if the home team has more yellow cards, there is a
tendency for the away team to also have more cards), and more accurately accounts for the offensive
and defensive skill of clubs (Thompson, 2018). We simulate soccer games at the season level, and
compare linear and bivariate Poisson regression models with respect to home advantage estimates.
We find that the mean absolute bias in estimating a home advantage when using linear regression
models is about six times larger when compared to bivariate Poisson. Second, we separate out each
league when fit on real data, in order to pick up on both (i) inherent differences in each league’s HA
and (ii) how those differences are impacted by “ghost games.” Third, we use a Bayesian version of
the bivariate Poisson model, which allows for probabilistic interpretations regarding the likelihood
that HA decreased within each league. Fourth, in modeling offensive and defensive team strength
directly in each season, we can better account for scheduling differences pre- and post-Covid with
respect to which teams played which opponents. Altogether, findings are inconclusive regarding a
drop in HA post-Covid. While in several league’s a drop appears more than plausible, in other
leagues, HA actually increases.

Memmert, 2010), economics (Forrest et al., 2005; Dohmen and Sauermann, 2016), and statistics (Buraimo et al.,
2010; Lopez et al., 2018) are also recommended.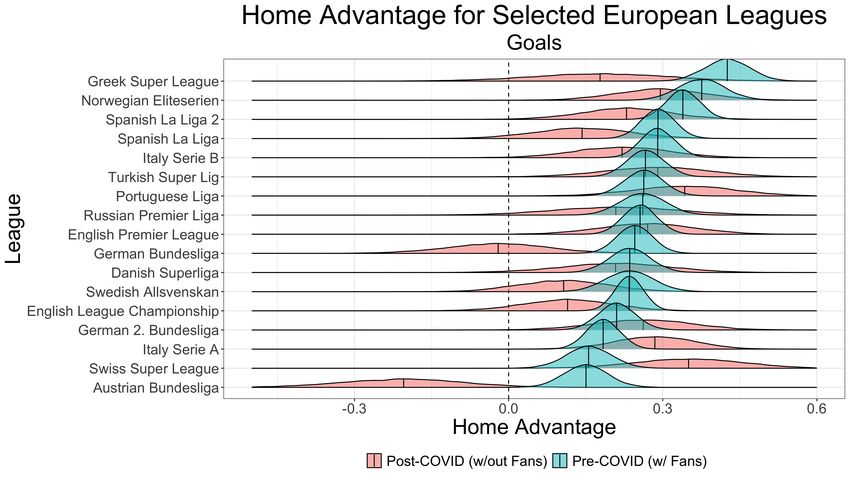
Estimating the change in soccer’s home advantage during the Covid-19 pandemic                                 3

Table 1 Comparison of post-Covid research on home advantage in football. HA: Home advantage. Correlation-
based approaches include Chi-square and Mann-Whitney tests. Linear Regression includes univariate OLS-based
frameworks and t-tests. Poisson Regression assumes univariate Poisson. Papers are sorted by Method and number of
Leagues.

 Paper                                 Leagues         Method                            Finding
 Sors et al. (2020)                    8 (Together)    Correlation                       Drop in   HA
 Leitner and Richlan (2020b)           8 (Together)    Correlations                      Drop in   HA
 Endrich and Gesche (2020)             2 (Together)    Linear Regression                 Drop in   HA
 Fischer and Haucap (2020b)            3 (Separate)    Linear Regression                 Mixed
 Dilger and Vischer (2020)             1 (NA)          Linear Regression, Correlations   Drop in   HA
 Krawczyk et al. (2020)                4 (Separate)    Linear Regression                 Mixed
 Ferraresi et al. (2020)               5 (Together)    Linear Regression                 Drop in   HA
 Reade et al. (2020)                   7 (Together)    Linear Regression                 Drop in   HA
 Jiménez Sánchez and Lavı́n (2020)   8 (Separate)    Linear Regression, Correlations   Mixed
 Scoppa (2020)                         10 (Together)   Linear Regression                 Drop in   HA
 Cueva (2020)                          41 (Together)   Linear Regression                 Drop in   HA
 McCarrick et al. (2020)               15 (Together)   Linear, Poisson Regression        Drop in   HA
 Bryson et al. (2020)                  17 (Together)   Linear, Poisson Regression        Mixed
 Benz and Lopez (this manuscript)      17 (Separate)   Bivariate Poisson Regression      Mixed

   The remainder of this paper is outlined as follows. Section 2 reviews post-Covid findings, and 3
describes our implementation of the bivariate Poisson model. Section 4 uses simulation to motivate
the use of bivariate Poisson for soccer outcomes, Sections 5 and 6 explore the data and results, and
Section 7 concludes.

2 Related literature

To date, we count 11 efforts that have attempted to estimate post-Covid changes to soccer’s HA.
The estimation of changes to HA has varied in scope (the number of leagues analyzed ranges
from 1 to 41), method, and finding. Table 1 summarizes these papers, highlighting the number
of leagues compared, whether leagues were treated together or separately, methodology (split into
linear regression or correlation based approaches), and overview of finding. For clarity, we add a
row highlighting the contributions of this manuscript.
    Broadly, methods consider outcome variables Y as a function of T and T 0 , the home advan-
tages pre-and post-Covid, respectively, as well as W , where W possibly includes game and team
characteristics. Though it is infeasible to detail choice of W and Y across each of the papers, a few
patterns emerge.
    Several papers consider team strength, or proxies thereof, as part of W . This could include fixed
effects for each team (Ferraresi et al., 2020; Cueva, 2020; Bryson et al., 2020), other proxies for
team strength (McCarrick et al., 2020; Fischer and Haucap, 2020b; Krawczyk et al., 2020), and
pre-match betting odds (Endrich and Gesche, 2020). The Cueva (2020) research is expansive, and
includes 41 leagues across 30 countries, and likewise finds significant impacts on home and away
team fouls, as well as foul differential. Other pre-match characteristics in W include if the game is
a rivalry and team travel (Krawczyk et al., 2020), as well as match referee and attendance (Bryson
et al., 2020).
    Choices of Y include metrics such as goals, goal differential, points (3/1/0), yellow cards, yellow
card differential, whether or not each team won, and other in-game actions such as corner kicks and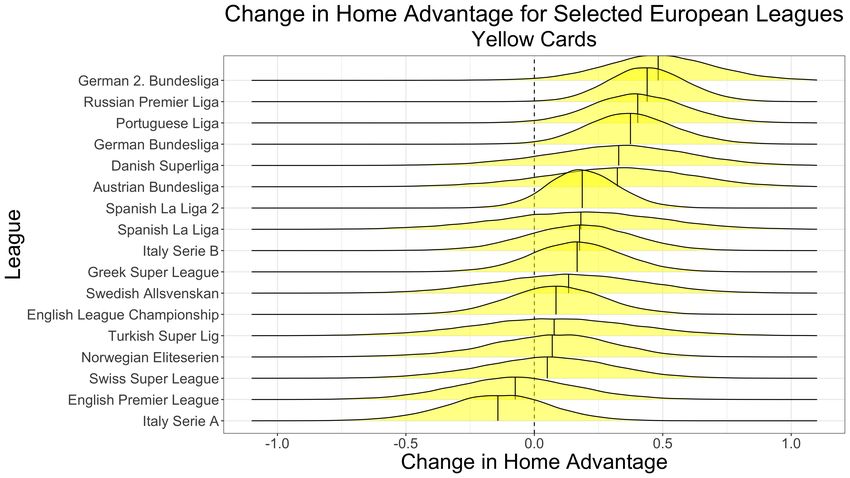
4                                                                           Luke S. Benz, Michael J. Lopez

fouls. Several authors separately develop models for multiple response variables. Linear regression,
and versions of these models including t-tests, stand out most common approaches for modeling Y .
This includes models for won/loss outcomes (Cueva, 2020), goal differential (Bryson et al., 2020;
Krawczyk et al., 2020), and fouls (Scoppa, 2020). Two authors model goals with Poisson regression
(McCarrick et al., 2020; Bryson et al., 2020). McCarrick et al. (2020), used univariate Poisson
regression models of goals, points and fouls, finding that across the entirety of 15 leagues, the home
advantage dropped from 0.29 to 0.15 goals per game, while Bryson et al. (2020) found a significant
drop in yellow cards for the away team using univariate Poisson regression.
    In addition to choice of Y , W , and method, researchers have likewise varied with the decision
to treat each league separate. As shown in Table 1, all but three papers have taken each of the
available leagues and used them in an single statistical model. Such an approach boasts the benefit
of deriving an estimated change in HA that can be broadly applied across soccer, but requires
assumptions that (i) HA is homogeneous between leagues and (ii) differences in HA post-Covid are
likewise equivalent.
    Our approach will make two advances that none of the papers in Table 1 can. First, we model
game outcomes using an expanded version of the bivariate Poisson regression model, one originally
designed for soccer outcomes (Karlis and Ntzoufras, 2003). This model allows us to control for team
strength, account for and estimate the correlation in game outcomes, and better model ties. Second,
we will show that the assumption of a constant HA between leagues is unjustified. In doing so, we
highlight that the frequent choice of combining leagues into one uniform model has far-reaching
implications with respect to findings.

3 Methods

Poisson regression models assume the response variable has a Poisson distribution, and models the
logarithm of response as a linear combination of explanatory variables.
   Let YHi and YAi be outcomes observed in game i for the home (Hi ) and away teams (Ai ),
respectively. For now we assume YHi and YAi are goals scored, but will likewise apply a similar
framework to yellow cards. The response (YHi , YAi ) is bivariate Poisson with parameters λ1i , λ2i , λ3i
if
                                   (YHi , YAi ) = BP (λ1i , λ2i , λ3i ),                              (1)
where λ1i + λ3i and λ2i + λ3i are the goal expectations of YHi and YAi , respectively, and λ3i is the
covariance between YHi and YAi . As one specification, let

                                 log(λ1i ) = µks + Tk + αHi ks + δAi ks ,
                                   log(λ2i ) = µks + αAi ks + δHi ks ,                                (2)
                                             log(λ3i ) = γk .

In Model (2), µks is an intercept term for expected goals in season s (which we assume to be
constant), Tk is a home advantage parameter, and γk is a constant covariance term in s, all of
which correspond to league k. The explanatory variables used to model λ1i and λ2i correspond
to factors likely to impact the home and away team’s goals scored, respectively. Above, λ1i is a
function of the home team’s attacking strength (αHi ks ) and away team’s defending strength (δAi ks ),
while λ2i is a function of the away team’s attacking strength (αAi ks ) and home team’s defending
strength (δHi ks ), all corresponding to league k during season s. For generality, we refer to αks and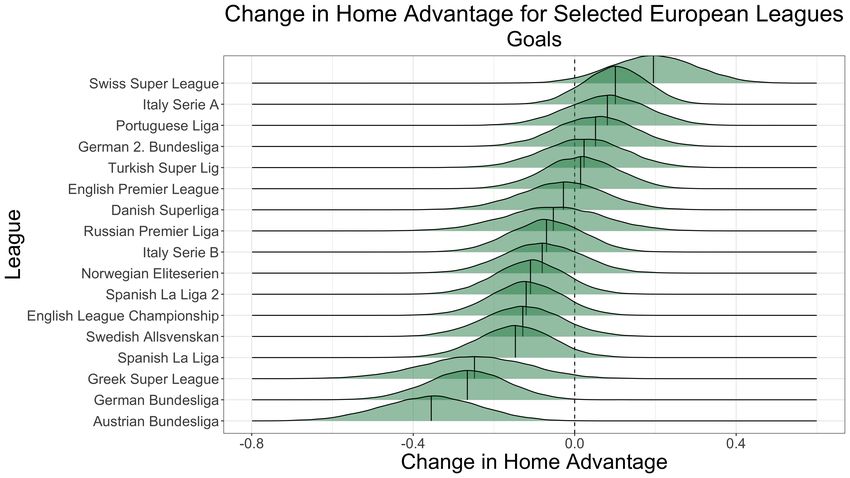
Estimating the change in soccer’s home advantage during the Covid-19 pandemic                       5

δks as general notation for attacking and defending team strengths, respectively. In using µks , αks
and δks are seasonal effects, centered at 0, such that αks ∼ N (0, σatt,k ) and δks ∼ N (0, σdef,k ).
    If λ3 = 0 in Equation 2, then YH ⊥   ⊥ YA , and the bivariate Poisson reduces to the product of
two independent Poisson distributions. Using observed outcomes in soccer from 1991, Karlis and
Ntzoufras (2003) found that assuming independence of the Poisson distributions was less suitable
for modeling ties when compared to using bivariate Poisson. More recently, however, Groll et al.
(2018) suggest using λ3 = 0, as there are now fewer ties when compared to 1991. Structural changes
to professional soccer – leagues now reward three points for a win and one point for a tie, instead of
two points for a win and one point for a tie – are likely the cause, and thus using λ3 = 0 in models
of goal outcomes is more plausible.
    There are a few extensions of bivariate Poisson to note. Karlis and Ntzoufras (2003) propose
diagonally inflated versions of Model (1), and also included team indicators for both home and
away teams in λ3 , in order to test of the home or away teams controlled the amount of covariance
in game outcomes. However, models fit on soccer goals did not warrant either of these additional
parameterizations. Baio and Blangiardo (2010) use a Bayesian version bivariate Poisson that ex-
plicitly incorporates shrinkage to team strength estimates. Additionally, Koopman and Lit (2015)
allows for team strength specifications to vary stochastically within a season, as in a state-space
model (Glickman and Stern, 1998).

3.1 Extending bivariate Poisson to changes in the home advantage

3.1.1 Goal Outcomes

We extend Model (2) to consider post-Covid changes in the HA for goals using Model (3).

                                     (YHi , YAi ) = BP (λ1i , λ2i , λ3i ),
              log(λ1i ) = µks + Tk × (Ipre−Covid ) + Tk0 × (Ipost−Covid ) + αHi ks + δAi ks ,
                                                                                                  (3)
                                     log(λ2i ) = µks + αAi ks + δHi ks ,
                                           log(λ3i ) = γk ,
where  Tk0is the post-Covid home advantage in league k, and Ipre−Covid and Ipost−Covid are indicator
variables for whether or not the match took place before or after the restart date shown in Table
2. Of particular interest will be the comparison of estimates of Tk and Tk0 .

3.1.2 Yellow Card Outcomes

A similar version, Model (4), is used for yellow cards. Let ZHi and ZAi be the yellow cards given
to the home and away teams in game i. We assume ZHi and ZAi are bivariate Poisson such that
                                     (ZHi , ZAi ) = BP (λ1i , λ2i , λ3i ),
                   log(λ1i ) = µks + Tk × (Ipre−Covid ) + Tk0 × (Ipost−Covid ) + τHi ks ,
                                                                                                  (4)
                                          log(λ2i ) = µks + τAi ks ,
                                               log(λ3i ) = γk ,
where τks ∼ N (σteam,k ). Implicit in Model (4), relative to Models (2) and (3), is that teams control
their own yellow card counts, and not their opponent’s, and that tendencies for team counts to
correlate are absorbed in λ3i .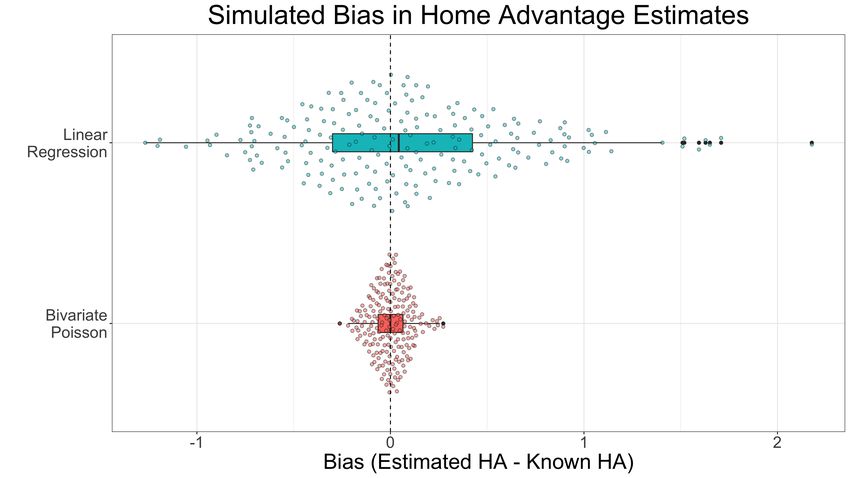
6                                                                         Luke S. Benz, Michael J. Lopez

3.1.3 Model Fits in Stan

We use Stan, an open-source statistical software designed for Bayesian inference with MCMC sam-
pling, for each league k, and with models for both goals and yellow cards. We choose Bayesian
MCMC approaches over the EM algorithm (Karlis and Ntzoufras, 2003; Karlis et al., 2005) in or-
der to (i) incorporate some baseline knowledge of the parameter spaces and (ii) gain probabilistic
interpretation of parameter estimates.
    We fit two versions of Models (3) and (4), one with γk = 0 and a second with γk > 0.
    For models where γk = 0, prior distributions for the parameters in Models (3) and (4) are as
follows.

                                             µks ∼ N (0, 5),
                                          αks ∼ N (0, σatt,k ),
                                          δks ∼ N (0, σdef,k ),
                                         τks ∼ N (0, σteam,k ),
                                   σatt,k ∼ Inverse-Gamma(1, 1),
                                   σdef,k ∼ Inverse-Gamma(1, 1),
                                  σteam,k ∼ Inverse-Gamma(1, 1),
                                             Tk ∼ N (0, 5),
                                             Tk0 ∼ N (0, 5)
    For models w/ γk > 0, empirical Bayes priors were used for TK , Tk0 in order to aid in convergence.
                    c0 k be the posterior mean estimate of pre-Covid and post-Covid HA for from
Namely, let Tbk and T
league k respectively, from the corresponding model with γk = 0. We let

                                      T . = mean({Tb1 , ..., Tb17 })
                                     T 0 . = mean({T           c0 17 })
                                                   c0 1 , ..., T
                                      s = 3 × SD({Tb1 , ..., Tb17 })
                                     s0 = 3 × SD({T
                                                  c0 1 , ..., T
                                                              c0 17 })
    Priors TK , Tk0 and γk for the variants of Model (3) and (4) w/ γk > 0 are as follows:

                                             Tk ∼ N (T . , s)
                                          Tk0 ∼ N (T 0 . , s0 )

                                                  1
                                      γk ∼ N 0,  √         (Goals)
                                                   2
                                              √
                                   γk ∼ N (0, 2) (Yellow Cards)
    For models with γk = 0, Models (3) and (4) were fit using 3 chains, 7000 iterations, and a burn
in of 2000 draws. When γk > 0 was assumed, Models (3) and (4) were fit using 3 chains, 20000
iterations, and a burn-in of 10000 draws.

   To check for model convergence, we examine the R    b statistic (Gelman and Rubin, 1992; Brooks
and Gelman, 1998) for each parameter. If R statistics are near 1, that indicates convergence (Gelman
                                         b
Estimating the change in soccer’s home advantage during the Covid-19 pandemic 7
et al., 2013). To check for the informativeness of a parameter’s posterior distribution, we use effective
sample size (ESS, Gelman et al. (2013)), which uses the relative independence of draws to equate
the posterior distribution to the level of precision achieved in a simple random sample.
For goals, we present results for Model (3) with γk = 0, and for yellow cards, we present results
with Model (4) and γk > 0. Henceforth, any reference to those models assumes such specifications,
unless explicitly stated otherwise. All data and code for running and replicating our analysis are
found at https://github.com/lbenz730/soccer ha covid.
4 Simulation
Most approaches for evaluating bivariate Poisson regression have focused on model fit (Karlis et al.,
2005) or prediction. For example, Ley et al. (2019) found bivariate Poisson matched or exceeded the
predictions of paired comparison models, as judged by rank probability score, on unknown game
outcomes. Tsokos et al. (2019) also compared paired comparison models to bivariate Poisson, with
a particular focus on methods for parameter estimation, and found the predictive performances to
be similar. As will be our suggestion, Tsokos et al. (2019) treated each league separately to account
for underlying differences in the distributions of game outcomes. Bivariate Poisson models have also
compared favorably with betting markets (Koopman and Lit, 2015).
Though out-of-sample prediction accuracy, as well as in-sample fit statistics, are strong moti-
vating factors for using bivariate Poisson regression, to date, we know of no approach that has
explicitly considered measured the accuracy of bivariate Poisson for estimating the home advan-
tage. To motivate our analysis on post-Covid game outcomes, we compare the estimates of home
advantage when using bivariate Poisson to linear regression.
The data generation process behind our simulations is designed to mimic professional soccer
leagues, as in Thompson (2018). We first generate team attacking and defensive strength estimates
(αt∗ ∼ N (0, 0.35) and δt∗ ∼ N (0, 0.35), respectively) for t∗ = 1 . . . 20, where 20 is the number of
simulated teams. This corresponds to the distributions observed in the English Premier League (See
Figure 2). As is custom in professional soccer, we assume each team played each opponent twice,
once at home and once away, yielding 380 total games, and, using Model (2), generated λ1i∗ and
λ2i∗ for each of simulated game i∗, where i∗ = 1 . . . 380. We assume λ3i∗ = 0. Finally, we simulated
T ∗, a simulated home advantage, such that T ∗ ∼ Unif(0, log(2)), where the range of T ∗ corresponds
to the goal differentials in our 17 leagues, as well as the advantages found in Figure 1 of Bryson
et al. (2020).
∗
Using the rpois() function in R we simulated goals for both the home (YHi∗ ∼ Pois(λ1i∗ )) and
∗
away (YAi∗ ∼ Pois(λ2i∗ )) in each of the 380 games, and fit two candidate models to extract the
home advantage.
First, we fit the bivariate Poisson model shown in Model (2), assuming no covariance, and using
2 chains, 5000 iterations, and a burn in of 2000 draws. Our parameter of interest is the home
advantage estimate, T .
Second, we use ordinary least squares to fit a linear regression model of goal differential, using
team-level fixed effects for the home and away teams, as well as a home advantage term. This
mimics the framework of, among others, Bryson et al. (2020), Ferraresi et al. (2020), and Cueva
∗ ∗
(2020). Letting Di∗Hi∗Ai∗ = YHi∗ − YAi∗ be the goal difference in simulated game i∗, we fit Model
(5) below,
Di∗Hi∗Ai∗ = α + homei∗Hi∗ × I(home = Hi∗) + awayi∗Ai × I(away = Ai∗) + i∗Hi∗Ai∗ . (5)8 Luke S. Benz, Michael J. Lopez
Fig. 1 Bias in 200 estimates of the home advantage in a single season of soccer games between 20 teams, using
bivariate Poisson and linear regression models. Bias’ are shown on the goal differential scale. The mean absolute bias
for bivariate Poisson is 0.075 goals, which compares favorably to linear regression (mean absolute bias, 0.45).
In Model (5), α is the home advantage, and homei∗Hi∗ and awayi∗Ai are fixed effects for the home
and away teams, respectively.
A total of 200 seasons were simulated. Figure 1 shows bias of home advantage estimates from
bivariate Poisson and linear regression fits from these simulations. Each bias is shown on the goal
difference scale (using our simulations, the true home advantage varied between 0 and 1 goal per
game).
For bivariate Poisson model simulations, the mean bias is 0.0006 goals, the mean absolute bias
is 0.075 goals, and the middle 95% of simulated bias’ lies between -0.18 and 0.22 goals. For linear
regression model simulations, the mean bias is 0.09 goals, the mean absolute bias is 0.45 goals,
and the middle 95% of simulated bias’ lies between -0.93 and 1.52 goals. That is, when using these
models across a full season’s worth of soccer games, one could the expect the estimate of the home
advantage from a linear regression (with home and away team fixed effects) to be off by nearly half
a goal (in unknown direction), which is about six times the amount of bias shown when estimating
using bivariate Poisson.
5 Data
The data used for this analysis are comprised of games from 17 soccer leagues in 13 European
countries spanning 5 seasons between 2015 and 2020. The leagues selected for use in this analysis
were among the first leagues to return to play following a suspension of the season to the Covid-19
pandemic. Typically, European countries have hierarchies of leagues (also referred to as divisions,
tiers, or flights), with teams competing to be promoted to a better league and/or to avoid beingEstimating the change in soccer’s home advantage during the Covid-19 pandemic 9
Table 2 Breakdown of leagues used in analysis. Data consists of 5 most recent seasons between 2015-2020. # of
games corresponds to sample sizes for goals model. Due to different levels of missingness between goals and yellow
cards in the data, 5 leagues have a smaller # of games in their respective pre-Covid yellow card sample, while 1
league has a smaller # of games in its post-Covid yellow card sample. Restart date refers the date that the league
resumed play after an interrupted 2019-20 season or delayed start of 2020 season (Norway/Sweden).
Pre-Covid Post-Covid # of
League Country Tier Restart Date
Games Games Team-Seasons
German Bundesliga Germany 1 2020-05-16 1448 82 90
German 2. Bundesliga Germany 2 2020-05-16 1449 81 90
Danish Superliga Denmark 1 2020-05-31 1108 74 68
Austrian Bundesliga Austria 1 2020-06-02 867 63 54
Portuguese Liga Portugal 1 2020-06-03 1440 90 90
Greek Super League Greece 1 2020-06-06 1168 58 78
Spanish La Liga 2 Spain 2 2020-06-10 2233 129 110
Spanish La Liga Spain 1 2020-06-11 1790 110 100
Turkish Super Lig Turkey 1 2020-06-13 1460 70 90
Swedish Allsvenskan Sweden 1 2020-06-14 960 198 80
Norwegian Eliteserien Norway 1 2020-06-16 960 175 80
English Premier League England 1 2020-06-17 1808 92 100
Italy Serie B Italy 2 2020-06-17 2046 111 105
Swiss Super League Switzerland 1 2020-06-19 836 65 50
Russian Premier Liga Russia 1 2020-06-19 1136 64 80
English League Championship England 2 2020-06-20 2673 113 120
Italy Serie A Italy 1 2020-06-20 1776 124 100
relegated to the league below. For each of the 13 countries used in this analysis, the top league in
that country was selected. Additionally, 2nd tier leagues were included for England, Spain, Italy
and Germany, the countries among the “Big 5” European soccer to resume domestic competition
(the final of the “Big 5” countries, France, cancelled the conclusion of its leagues’ 2019-20 seasons).
Only games from intra-league competition were used in this analysis, and games from domestic
inter-league cup competitions (such as England’s FA Cup), and inter-country competitions (such
as the UEFA Champions League), were dropped. A full summary of the leagues and games used in
this paper is presented in Table 2.
Data was scraped from Football Reference (Sports Reference, 2020) on 2020-10-28. For each
league, the five most recent seasons worth of data were pulled, not including the ongoing 2020-21
season. For 15 of the 17 leagues, this included the 2015-16 season through the 2019-20 season. Unlike
the majority of European Soccer leagues, which run from August-May, the top flights in Sweden
and Norway run from March-November. These leagues never paused an ongoing season due to the
Covid-19 pandemic, but rather delayed the start of their respective 2020 seasons until June. As a
result, the data used is this analysis is five full seasons worth of data for all the leagues outside of
Sweden and Norway, while those two countries have four full seasons of data, plus all games in the
2020 season through 2020-10-28.
Throughout this analysis, we refer to pre-Covid and post-Covid samples. For each league, the
pre-Covid sample constitutes all games prior to the league’s restart date, listed in Table 2, while
the post-Covid sample includes all games is comprised of all games on or after the league’s restart
date. In nearly all cases, the league’s restart date represents a clean divide between games that had
fans in attendance and games that did not have any fans in attendance due to Covid restrictions.
One exception is a German Bundesliga game between Borussia Monchengladbach and Cologne
on 2020-03-11 that was played in an empty stadium just before the German Bundesliga paused10 Luke S. Benz, Michael J. Lopez
its season. Additionally, seven games in Italy Serie A were played under the same circumstances.
While leagues returned from their respective hiatuses without fans in attendance, some, such as the
Danish Superliga, Russian Premier League, and Norwegian Eliteserien began allowing very reduced
attendance by the end of the sample.
Unfortunately, attendance numbers attained from Football Reference were not always available
and/or accurate, and as such, we can not systematically identify the exact number games in the
sample that had no fans in attendance prior to the league suspending games, or the the exact
number of games in the post-Covid sample that had fans in attendance. Related, there are several
justifications for using the pre-Covid/post-Covid sample split based on league restart date:
1. Any number of games in the pre-Covid sample without fans in attendance is minute compared
to the overall size of any league’s pre-Covid sample.
2. Several month layoffs with limited training are unprecedented, and possibly impact team strengths
and player skill, which in turn may impact game results in the post-Covid sample beyond any
possible change in home advantage.
3. Any games in a league’s post-Covid sample played before fans have attendances significantly
reduced compared to the average attendance of a game in the pre-Covid sample.
4. The majority of leagues don’t have a single game in the post-Covid sample with any fans in
attendance, while all leagues have games in the post-Covid sample without fans.
Recently started games in the 2020-21 season are not considered, as leagues have diverged from
one another in terms of off-season structure and policies allowing fans to return to the stands.
Games where home/away goals were unavailable were removed for the goals model, and games
where home/away yellow cards were unavailable were removed for the yellow cards model. The
number of games displayed in Table 2 reflects the sample sizes used in the goals model. The number
of games where goal counts were available always matched or exceeded the number of games where
yellow card counts were available. Across 5 leagues, 92 games from the pre-Covid samples used in
Model (3) were missing yellow card counts, and had to be dropped when fitting Model (4) (2 in
Italy Serie B, 2 in the English League Championship, 12 in the Danish Superliga, 34 in the Turkish
Super Lig, and 42 in Spanish La Liga 2). 4 games had to be dropped from the Russian Premier’s
Leagues post-Covid sample for the same reason.
6 Results
6.1 Goals
6.1.1 Model Fit
Results from goals Model (3), using γk = 0 for all leagues, are shown below. We choose Model (3)
with γk = 0 because, across our 17 leagues of data, the correlation in home and away goals per
game varied between -0.16 and 0.07.
Using this model, all Rb statistics ranged from 0.9998 - 1.002, providing strong evidence that the
model properly converged. Additionally, the effective sample sizes are provided in Table 5. ESS are
sufficiently large, especially HA parameters of interest Tk and Tk0 , suggesting enough draws were
taken to conduct inference.
We present posterior means of attacking (αks ) and defensive team strengths (δks ) in Figure
2 for teams in the English Premier League (k) during 2016-17 season (s). The casual soccer fanEstimating the change in soccer’s home advantage during the Covid-19 pandemic 11
Fig. 2 Attacking (αks ) and defensive (δks ) posterior means for teams in the English Premier League during the
2016-17 season. Familiar powers such as Manchester City, Chelsea, and Tottenham are assigned the best estimates of
overall team strength. Our model also correctly identifies the weaknesses of teams who were relegated following the
season, including Hull City who allowed a league worst 80 goals, and Middlesbrough, who scored a futile 27 goals in
38 games.
will note familiar powers such as Manchester City, Chelsea, and Tottenham as having the best
estimates of overall team strength. Manchester United conceded the 2nd fewest goals of any team
in the English Premier League during the 2016-17 campaign while scoring the 8th most goals out
of the 20 teams in the league. Such team characteristics appear adequately captured by our model,
which assigned Manchester United a very good defensive team strength while only a slightly above-
average offensive team strength. Our model also correctly identifies the weaknesses of teams who
were relegated following the season, including Hull City who allowed a league worst 80 goals, and
Middlesbrough, who scored a futile 27 goals in 38 games.
6.1.2 Home Advantage
The primary parameters of interest in Model (3) are Tk and Tk0 , the pre- and post-Covid home
advantages for each league k, respectively. These HA terms are shown on a log-scale, and represent
the additional increase in the home team’s log goal expectation, relative to a league average (µks ),
and after accounting for team and opponent (αks and δks ) effects.2
Posterior distributions for Tk and Tk0 are presented in Figure 3. Clear differences exist between
several of the 17 leagues’ posterior distributions of Tk . For example, the posterior mean of Tk in
the Greek Super League is 0.425, or about 2.8 times that of the posterior mean in the Austrian
Bundesliga (0.15). The non-overlapping density curves between these leagues adds further support
for our decision to estimate Tk separately for each league, as opposed to one T across all of Europe.
2 In our simulations in Section 4, we transformed HA estimates to the goal difference scale, in order to compare
to estimtaes from linear regression.12 Luke S. Benz, Michael J. Lopez
Fig. 3 Posterior distributions of Tk and Tk0 , the pre-Covid and post-Covid HAs for goals. Larger values of Tk
and Tk0 indicate larger home advantages. Prior to the Covid-19 pandemic, the Greek Super League and Norwegian
Eliteserien had the largest home advantages for goals, while the Austrian Bundesliga and Swiss Super League had
the smallest home advantages for goals. Across the 17 leagues in the sample, a range of differences exist between
posterior distributions of Tk and Tk0 .
Table 3 compares posterior means of Tk (denoted Tbk ) with those of Tk0 (denoted T c0 k ) for each
of the 17 leagues. Posterior means for HA without fans is smaller that the corresponding posterior
mean of HA w/ fans (T c0 k < Tbk ) in 11 of the 17 leagues. In the remaining 6 leagues, our estimate of
post-Covid HA is larger than pre-Covid HA (T c0 k > Tbk ).
Our Bayesian framework also allows for probabilistic interpretations regarding the likelihood
that HA decreased within each league. Posterior probabilities of HA decline, P (Tk0 < Tk ), are also
presented in Table 3. The 3 leagues with the largest declines in HA, both in absolute and rel-
ative terms were the Austrian Bundesliga (Tbk = 0.150, T c0 k = −0.207), the German Bundesliga
0
(Tk = 0.245, T k = −0.021), and the Greek Super League (Tbk = 0.425, T
b c c0 k = 0.176). The Austrian
Bundesliga and German Bundesliga were the only 2 leagues to have post-Covid posterior HA esti-
mates below 0, perhaps suggesting that HA disappeared in these leagues altogether in the absence
of fans. We find it interesting to note that among the leagues with the 3 largest declines in HA
are the leagues with the highest (Greek Super League) and lowest (Austrian Bundesliga) pre-Covid
HA.
We estimate the probability the HA declined with the absence of fans, P (Tk0 < Tk ), to be 0.999,
0.998, and 0.974 in the top flights in Austria, Germany, and Greece respectively. These 3 leagues,
along with the English League Championship (0.918), Swedish Allsvenskan (0.909), and both tiers
in Spain (0.978 for Spanish La Liga, 0.901 for Spanish La Liga 2) comprise seven leagues where we
estimate a decline in HA with probability at least 0.9.
Two top leagues – the English Premier League and Italy Serie A – were among the six leagues
with estimated post-Covid HA greater than pre-Covid HA. The three leagues with largest increaseEstimating the change in soccer’s home advantage during the Covid-19 pandemic 13
Table 3 Comparison of posterior means for pre-Covid and post-Covid goals HA parameters from Model (3), Tbk
c0 k , respectively. Larger values of Tk and T 0 indicate larger home advantages. Relative and absolute differences
and T k
between T c0 k and Tbk are also shown. Probabilities of decline in HA without fans, P (T 0 < Tk ), are estimated from
k
posterior draws. We estimate the probability of a decline in HA without fans to exceed 0.9 in 7 of 17 leagues, and to
exceed 0.5 in 11 of 17 leagues.
League Tbk c0 k
T c0 k - Tbk
T % Change P (Tk0 < Tk )
Austrian Bundesliga 0.150 -0.207 -0.358 -237.9% 0.999
German Bundesliga 0.245 -0.021 -0.267 -108.8% 0.998
Greek Super League 0.425 0.176 -0.250 -58.7% 0.974
Spanish La Liga 0.291 0.143 -0.148 -50.8% 0.948
English League Championship 0.235 0.114 -0.121 -51.4% 0.918
Swedish Allsvenskan 0.236 0.107 -0.129 -54.8% 0.909
Spanish La Liga 2 0.339 0.228 -0.111 -32.7% 0.901
Norwegian Eliteserien 0.375 0.295 -0.080 -21.3% 0.792
Italy Serie B 0.290 0.220 -0.070 -24.1% 0.776
Russian Premier Liga 0.261 0.207 -0.054 -20.6% 0.668
Danish Superliga 0.236 0.206 -0.030 -12.5% 0.605
English Premier League 0.255 0.270 0.014 5.6% 0.435
Turkish Super Lig 0.267 0.289 0.022 8.2% 0.412
German 2. Bundesliga 0.210 0.261 0.050 23.9% 0.301
Portuguese Liga 0.263 0.342 0.079 30.2% 0.211
Italy Serie A 0.184 0.284 0.100 54.4% 0.102
Swiss Super League 0.156 0.350 0.195 125.2% 0.034
in HA without fans were the Swiss Super League (Tbk = 0.156, T c0 k = 0.350), Italy Serie A (Tbk =
c0 k = 0.284), and the Portuguese Liga (Tbk = 0.263, T
0.184, T c0 k = 0.342).
Figure 6 (provided in the Appendix) shows the posterior distributions of Tk − Tk0 , the change in
goals home advantage, in each league. Though this information is also partially observed in Table 3
and Figure 3, the non-overlapping density curves for the change in HA provide additional evidence
that post-Covid changes were not uniform between leagues.
Fitting Model (3) with γk > 0 did not noticeably change inference with respect to the home
advantage. For example, the probability that HA declined when assuming γk > 0 was within 0.10
of the estimates shown in Table 3 in 14 of 17 leagues. In none of the leagues did the estimated
probability of HA decline exceed 0.9 with γk = 0 and fail to exceed 0.9 with γk > 0.
6.2 Yellow Cards
6.2.1 Model Fit
The yellow cards model presented in this paper is Model (4), using γk > 0 for all leagues. Unlike with
goals, where there was inconsistent evidence of a correlation in game-level outcomes, the correlation
in home and away yellow cards per game varied between 0.10 and 0.22 among the 17 leagues.
R
b statistics for Model (3) ranged from 0.9999-1.013, providing strong evidence that the model
properly converged. Effective sample sizes (ESS) for each parameter in Model (4) are provided
in Table 6. ESS are sufficiently large, especially HA parameters of interest Tk and Tk0 , suggesting
enough draws were taken to conduct inference.14 Luke S. Benz, Michael J. Lopez
Fig. 4 Posterior distributions of Tk and Tk0 , the pre-Covid and post-Covid HAs for yellow cards. Smaller (i.e.
more negative) values of Tk and Tk0 indicate larger home advantages. Prior to the Covid-19 pandemic, the English
League Championship and Greek Super League had the largest home advantages for yellow cards, while the Swedish
Allsvenskan and Turkish Super Lig had the smallest home advantages for yellow cards. Across the 17 leagues in the
sample, a range of differences exist between posterior distributions of Tk and Tk0 .
6.2.2 Home Advantage
As with Model (3) in Section 6.1.2, the primary parameters of interest in Model (4) are Tk and Tk0 ,
the pre- and post-Covid home advantages for each league k, respectively. Unlike with goals, where
values of Tk are positive, teams tend to want to avoid yellow cards, and thus estimates of Tk are
< 0. Related, a post-Covid decrease in yellow card HA is reflected by Tk < Tk0 .
As in Section 6.1.2, Tk and Tk0 are not on a they exist on a log-scale and represent the additional
increase on the home team’s log yellow card expectation, relative to a league average (µks ) after
accounting for team and opponent (τks ) tendencies. Additionally, note that the same value of Tk
represents a larger home advantage in a league where fewer cards are shown (i.e. smaller µks ).
Posterior distributions for Tk and Tk0 are presented in Figure 4. Posterior means of Tk range
from -0.196 (Swedish Allsvenskan) to -0.478 (English League Championship).
Table 4 compares posterior means of Tk (denoted Tbk ) with those of Tk0 (denoted T c0 k ) for each
of the 17 leagues for the yellow cards model. Posterior means for Tk are smaller than that the
corresponding posterior mean of Tk0 , (Tbk < T
c0 k ) in 15 of the 17 leagues, suggesting that yellow card
HA declined in nearly every league examined in the absence of fans.
The two leagues with the largest declines in HA, both in absolute and relative terms were
the German 2. Bundesliga (Tbk = −0.392, T c0 k = −0.090) and the Austrian Bundesliga (Tbk =
0
−0.251, T k = 0.063). In addition the top Austrian division and the 2nd German division, T
c c0 k >
0 in the German Bundesliga (Tbk = −0.340, T c0 k = 0.039) and Russian Premier League (Tbk =
0
−0.404, T k = 0.037).
cEstimating the change in soccer’s home advantage during the Covid-19 pandemic 15
Table 4 Comparison of posterior means for pre-Covid and post-Covid yellow cards HA parameters from Model (4),
c0 k , respectively. In the context of yellow cards, smaller (i.e. more negative) values of Tk and T 0 indicate
Tbk and T k
larger home advantages. Relative and absolute differences between T c0 k and Tbk are also shown. Probabilities of decline
in HA without fans, P (Tk0 > Tk ), are estimated from posterior draws. We estimate the probability of a decline in HA
without fans to exceed 0.9 in 5 of 17 leagues, and to exceed 0.5 in 15 of 17 leagues.
League Tbk c0 k
T c0 k - Tbk
T % Change P (Tk0 > Tk )
Russian Premier Liga -0.404 0.037 0.441 109.1% 0.997
German Bundesliga -0.340 0.039 0.379 111.4% 0.986
Portuguese Liga -0.415 -0.008 0.406 98.0% 0.984
German 2. Bundesliga -0.392 0.090 0.482 123.0% 0.982
Spanish La Liga 2 -0.359 -0.169 0.190 52.9% 0.917
Danish Superliga -0.331 -0.010 0.321 96.9% 0.878
Austrian Bundesliga -0.251 0.063 0.314 125.1% 0.863
Greek Super League -0.429 -0.261 0.168 39.2% 0.829
Italy Serie B -0.397 -0.223 0.174 43.8% 0.799
Spanish La Liga -0.269 -0.094 0.176 65.3% 0.719
Swedish Allsvenskan -0.196 -0.063 0.132 67.6% 0.682
English League Championship -0.478 -0.393 0.085 17.7% 0.675
Norwegian Eliteserien -0.323 -0.266 0.057 17.8% 0.615
Turkish Super Lig -0.199 -0.122 0.077 38.8% 0.599
Swiss Super League -0.327 -0.282 0.045 13.7% 0.581
English Premier League -0.293 -0.366 -0.073 -24.9% 0.376
Italy Serie A -0.344 -0.489 -0.145 -42.1% 0.240
Posterior probabilities of HA decline, P (Tk0 > Tk ), are also presented in Table 4. This probability
exceeds 0.9 in 5 of 17 leagues: Russian Premier Liga (.997), German Bundesliga (0.986), Portuguese
Liga (0.984), German 2. Bundesliga (0.982), and Spanish La Liga 2 (0.917).
c0 k in 2 leagues, the English Premier League (Tbk = −0.293, T
Alternatively, Tbk > T c0 k = −0.366)
and Italy Serie A (Tbk = −0.344, T 0
ck = −0.489). However, given the overlap in the pre-Covid and
post-Covid density curves, this does not appear to be a significant increase.
Figure 7 (provided in the Appendix) shows the posterior distributions of Tk − Tk0 , the change
in yellow card home advantage, in each league. In Figure 7, there is little, if any, overlap between
estimates of the change in Serie A’s yellow card home advantage, and, for example, the change in
German 2. Bundesliga and the Russian Premier League, adding to evidence that the post-Covid
changes in HA are not uniform across leagues.
Fitting Model (4) with γk = 0 changed inference with respect to the home advantage slightly
more than was the case between the two variants of Model (3). For example, the probability that
HA declined when assuming γk = 0 was within 0.10 of the estimates shown in Table 4 in only 9
of 17 leagues. With γk = 0, we estimated the probability HA declined to be 0.979 in the Austrian
Bundesliga and 0.944 in the Danish Super Liga, compared to 0.863 and 0.874, respectively with
γk > 0. Other notable differences include the English Premier League and Italy Serie A, whose
estimated probability of HA decline rose from 0.075 and 0.073 to 0.376 and 0.240, respectively.
Such differences are to be expected given the much larger observed correlation in yellow cards as
compared to goals, and suggest that failure to account for correlation in yellow cards between home
and away teams might lead to faulty inference and incorrect conclusions about significant decreases
(or increases) in home advantage.16 Luke S. Benz, Michael J. Lopez
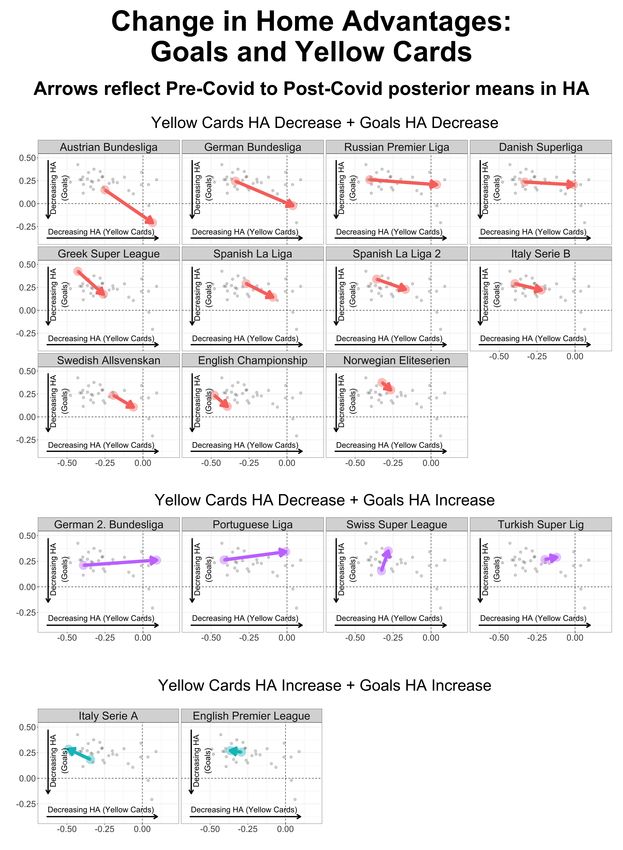
6.3 Examining Goals and Yellow Cards Together
To help characterize the relationship between changes in our two outcomes of interest, Figure 5
shows the pre-Covid and post-Covid HA posterior means of each of goals and yellow cards in the
17 leagues. The origin of the arrows in Figure 5 is the posterior mean of HA for pre-Covid yellow
cards and goals, and the tip of the arrow is the posterior mean of post-Covid HA for yellow cards
and goals.
Of the 17 leagues examined in this paper, 11 fall into the case where yellow cards and goals both
experienced a decline in HA. In four leagues, the German Bundesliga, Spanish La Liga 2, Greek
Super League, and Austrian Bundesliga, the probability that HA declined was greater than 0.8 for
both outcomes of interest.
Despite the posterior mean HA for goals being higher post-Covid when compared to pre-Covid,
the Turkish Super Lig, German 2. Bundesliga, Portugese Liga, and Swiss Super League show a
possible decrease in yellow card HA. For example, we estimate the probably that HA for yellow
cards declined to be 0.984 for the Portuguese Liga and 0.982 for the German 2. Bundesliga.
Both the English Premier League and Italy Serie A show posterior mean HAs that are higher
for both outcomes. Of the four countries where multiple leagues were examined, only Spain’s pair of
leagues showed similar results (decline in HA for both outcomes). No leagues had showed posterior
means with a lower HA for goals but not for yellow cards.
7 Discussion
Our paper utilizes bivariate Poisson regression to estimate changes to the home advantage (HA)
in soccer games played during the summer months of 2020, after the outbreak of Covid-19, and
relative to games played pre-Covid. Evidence from the 17 leagues we looked is mixed. In some
leagues, evidence is overwhelming that HA declined for both yellow cards and goals. Alternatively,
other leagues suggest the opposite, with some evidence that HA increased. Additionally, we use
simulation to highlight the appropriateness of bivariate Poisson for home advantage estimation in
soccer, particularly relative to the oft-used linear regression.
The diversity in league-level findings highlights the challenges in reaching a single conclusion
about the impact of playing without fans, and implies that alternative causal mechanisms are also
at play. For example, two of the five major European leagues are the German Bundesliga and Italy’s
Serie A. In the German Bundesliga, evidence strongly points to decreased HA (> 99% with goals),
which is likely why Fischer and Haucap (2020a) found that broadly backing away Bundesliga teams
represented a profitable betting strategy. But in Serie A, we only find a 10 percent probability that
HA decreased with goal outcomes. Comparing these two results does not mesh into one common
theme. Likewise, Figures 3-4 and Figures 6-7 imply that both (i) HA and (ii) changes in HA are
not uniform by league.
Related, there are other changes post Covid-19 outbreak, some of which differ by league. These
include, but are not limited to:
1. Leagues adopted rules allowing for five substitutions, instead of three substitutions per team
per game. This rule change likely favors teams with more depth (potentially the more successful
teams), and suggests that using constant estimates of team strength pre-Covid and post-Covid
could be inappropriate.3
3 As shown in Table 2, however, we are limited by the number of post-Covid games in each league.Estimating the change in soccer’s home advantage during the Covid-19 pandemic 17 Fig. 5 Gray points represent pairs of posterior means for goals and yellow cards for all leagues, both pre- and post- Covid. For each league k, arrows allow for visual comparison of the direction and magnitude of any change in HA in both outcomes of interest. Arrows pointing down denote a decline in goals HA, and arrows pointing right reflect a decline in yellow cards HA. Of 17 leagues, 11 experienced a decline in HA in both outcomes, four leagues experienced an increase in goals HA and a decline in yellow cards HA, and two experienced an increase in both outcomes.
18                                                                        Luke S. Benz, Michael J. Lopez

   2. Certain leagues restarted play in mid-May, while others waited until the later parts of June.
An extra month away from training and club facilities could have impacted team preparedness.

   3. Covid-19 policies placed restrictions on travel and personal life. When players returned to
their clubs, they did so in settings that potentially impacted their training, game-plans, and rest.
Additionally, all of these changes varied by country, adding credence to our suggestion that leagues
be analyzed separately.

    Taken wholly, estimates looking at the impact of HA post-Covid are less of a statement about
the cause and effect from a lack of fans (McCarrick et al., 2020; Bryson et al., 2020), and as much
about changes due to both a lack of fans and changes to training due to Covid-19. Differences
in the latter could more plausibly be responsible for the heterogenous changes we observe in HA
post-Covid.

    Given league-level differences in both HA and change in HA, we do not recommend looking
at the impact of “ghost games” using single number estimate alone. However, a comparison to
McCarrick et al. (2020), who suggest an overall decline in per-game goals HA from 0.29 to 0.15
(48%), is helpful for context. As shown in Table 3, our median league-level decline in goals HA, on
the log scale, is 0.07. Extrapolating from Model 3, assuming attacking and defending team strengths
of 0, and using the average posterior mean for µk , averaged across the 17 leagues, this equates to
a decline in the per-game goals HA from 0.32 to 0.23 (28%). This suggests the possibility that,
when using bivariate Poisson regression, the overall change in HA is attenuated when compared to
current literature.

    We are also the first to offer suggestions on the simultaneous impact of HA for yellow cards
and goals. While traditional soccer research has used yellow cards as a proxy for referee decisions
relating to benefits for the home team, we find that it is not always the case that changes in yellow
card HA are linked to changes to goal HA. In two leagues, German 2. Bundesliga and Poruguese
Liga, there are overwhelming decreases in yellow card HA (probabilities of a decrease of at least 98%
in each), but small increases in the net HA given to home team goals. Among other explanations,
this suggests that yellow cards are not directly tied to game outcomes. It could be the case that, for
example, visiting teams in certain leagues fouled less often on plays that did not impact chances of
scoring or conceding goals. Under this hypothesis, yellow cards aren’t a direct proxy for a referee-
driven home advantage, and instead imply changes to player behavior without fans, as suggested
by Leitner and Richlan (2020a). Alternatively, having no fan support could cause home players
to incite away players less frequently. Said FC Barcelona star Lionel Messi (Reuters, 2020), “It’s
horrible to play without fans. It’s not a nice feeling. Not seeing anyone in the stadium makes it like
training, and it takes a lot to get into the game at the beginning.”

    Finally, we use simulations to highlight limitations of using linear regression with goal outcomes
in soccer. The mean absolute bias in HA estimates is roughly six times higher when using linear
regression, relative to bivariate Poisson. Admittedly, our simulations are naive, and the data gen-
erating processes for simulated game outcomes aligns with the same Poisson framework as the one
we use to model game results. This, however, is supported by a wide body of literature, including
Reep and Benjamin (1968), Reep et al. (1971), Dixon and Coles (1997), and Karlis and Ntzoufras
(2000). Despite this history, linear regression remains a common tool for soccer research (as shown
in Table 1); as an alternative, we hope these findings encourage researchers to consider the Poisson
distribution.
Estimating the change in soccer’s home advantage during the Covid-19 pandemic 19
Declarations
Conflict of interest
The authors declare that they have no conflict of interest. The authors would like to note that this
work is not endorsed, nor associated with Medidata Solutions, Inc.
Funding
Not Applicable.
Data Availability
All data used in this project are open source, and come from Football Reference (Sports Reference,
2020). We make our cleaned, analysis-ready dataset available at https://github.com/lbenz730/
soccer ha covid/tree/master/fbref data.
Code Availability
All code for scraping data, fitting models, and conduncting analyses has been made available for
public use at https://github.com/lbenz730/soccer ha covid.
Appendix
Table 5 Effective Sample Sizes (ESS) of posterior draws for parameters from Model (3), with γk = 0. For parameters
that vary by season (µks ) or team and season (αks , δks ), mean ESS values are presented.
League Tk Tk0 µks αks δks σatt,k σdef,k
Austrian Bundesliga 30018 31716 6588 16833 22229 9169 7072
Danish Superliga 21322 27533 8405 19303 22289 7883 4705
English League Championship 28645 32838 13036 28257 28323 5252 5719
English Premier League 32906 33898 5467 18846 24789 10888 6903
German 2. Bundesliga 22404 26053 12245 25580 27561 4417 2492
German Bundesliga 36352 37765 8889 23248 30848 9600 5570
Greek Super League 30796 31963 5402 18258 19803 8913 7151
Italy Serie A 30217 33255 5869 19603 23533 9056 7037
Italy Serie B 29673 32131 14612 30287 30888 5020 3052
Norwegian Eliteserien 24768 24773 12348 24348 26556 6220 3845
Portuguese Liga 32515 39975 7611 22048 27836 10979 5916
Russian Premier Liga 28564 35249 9044 25985 26889 6969 7545
Spanish La Liga 32711 35710 7345 23094 27454 10134 7666
Spanish La Liga 2 31558 35343 13605 31644 31673 4306 3925
Swedish Allsvenskan 39035 39961 9595 27498 24742 6773 7396
Swiss Super League 21074 21399 7621 15339 20193 7120 4944
Turkish Super Lig 34784 29287 11329 25711 29127 7081 568020 Luke S. Benz, Michael J. Lopez Fig. 6 Posterior distributions of Tk − Tk0 , the change in goals home advantage. Negative values of Tk − Tk0 reflect a decrease in home advantage while positive values reflect an increase in home advantage. Across the 17 leagues in the sample, a range of differences exist between posterior distributions of Tk − Tk0 . Fig. 7 Posterior distributions of Tk −Tk0 , the change in yellow card home advantage. Positive values of Tk −Tk0 reflect a decrease in home advantage while negative values reflect an increase in home advantage. Across the 17 leagues in the sample, a range of differences exist between posterior distributions of Tk − Tk0 .
Estimating the change in soccer’s home advantage during the Covid-19 pandemic                                  21

Table 6 Effective Sample Sizes (ESS) of posterior draws for parameters from Model (4), with γk > 0. For parameters
that vary by season (µks ) or team and season (τks ) mean ESS values are presented.
               League                              Tk       Tk0    µks      τks   σteam,k      γk
               Austrian Bundesliga               5157    25191    1567    31518       993     431
               Danish Superliga                 10080    29180    2263    32471       961    1293
               English League Championship       2956    36611    2166    34905      1838    1748
               English Premier League            7354    21696     976    27820       659     727
               German 2. Bundesliga              5202    31952     528    34198       501     979
               German Bundesliga                 3262    43122    1006    31308       911    1096
               Greek Super League                3337    39304    2026    35878      2061    1539
               Italy Serie A                     7205    13276    1619    21431      1158     963
               Italy Serie B                     6460    35809    2145    37667      1657    1333
               Norwegian Eliteserien             1304    22198     454    29584       371     226
               Portuguese Liga                   6360    44860    1542    36093      1402    1755
               Russian Premier Liga              6933    44941    1247    36397      1365    1490
               Spanish La Liga                   5951    19471     789    31242       428     243
               Spanish La Liga 2                 3197    38104    2034    39014      1849    1367
               Swedish Allsvenskan              22669    28121    4988    37235       968    1760
               Swiss Super League               10103    31241    2426    38500      1572    1109
               Turkish Super Lig                20777    24891    5737    39653       723    2545

References

Agnew GA, Carron AV (1994) Crowd effects and the home advantage. International Journal of
  Sport Psychology
Baio G, Blangiardo M (2010) Bayesian hierarchical model for the prediction of football results.
  Journal of Applied Statistics 37(2):253–264
Brooks SP, Gelman A (1998) General methods for monitoring convergence of iterative simulations.
  Journal of Computational and Graphical Statistics 7(4):434–455
Bryson A, Dolton P, Reade JJ, Schreyer D, Singleton C (2020) Causal effects of an absent crowd
  on performances and refereeing decisions during covid-19
Buraimo B, Forrest D, Simmons R (2010) The 12th man?: refereeing bias in english and german
  soccer. Journal of the Royal Statistical Society: Series A (Statistics in Society) 173(2):431–449
Courneya KS, Carron AV (1992) The home advantage in sport competitions: a literature review.
  Journal of Sport & Exercise Psychology 14(1)
Cueva C (2020) Animal spirits in the beautiful game. testing social pressure in professional football
  during the covid-19 lockdown
Dilger A, Vischer L (2020) No home bias in ghost games
Dixon MJ, Coles SG (1997) Modelling association football scores and inefficiencies in the football
  betting market. Journal of the Royal Statistical Society: Series C (Applied Statistics) 46(2):265–
  280
Dohmen T, Sauermann J (2016) Referee bias. Journal of Economic Surveys 30(4):679–695
Endrich M, Gesche T (2020) Home-bias in referee decisions: Evidence from “ghost matches” during
  the covid19-pandemic. Economics Letters 197:109621
Ferraresi M, Gucciardi G, et al. (2020) Team performance and audience: experimental evidence
  from the football sector. Tech. rep.
Fischer K, Haucap J (2020a) Betting market efficiency in the presence of unfamiliar shocks: The
  case of ghost games during the covid-19 pandemic
You can also read


