#Feesmustfall and beyond: Towards a sustainable National Student Loan regulatory framework - NWU view - Department of Justice
←
→
Page content transcription
If your browser does not render page correctly, please read the page content below
#Feesmustfall and beyond:
Towards a sustainable National Student Loan
regulatory framework – NWU view

 “Overcoming poverty is not a task of charity, it is an act of justice. Like slavery and apartheid,
 poverty is not natural. It is manmade and it can be overcome and eradicated by the actions of
human beings. Sometimes it falls on a generation to be great. You can be that great generation.
                          Let your greatness blossom.” ~ Nelson Mandela

Elmarie de Beer, North-West University, Executive Director Finance and Facilities
Lerike Jacobs, North-West University
Anneke Moolman, North-West University

Ronette Zaaiman, Johannesburg Metro Clinics

With acknowledgement to:
Olive Stumke
Lana Harmse
Thys Swanepoel
Monique Theunissen
Josua van As
Fatima Mohamed
Heleen Janse van Vuuren
Frik van Niekerk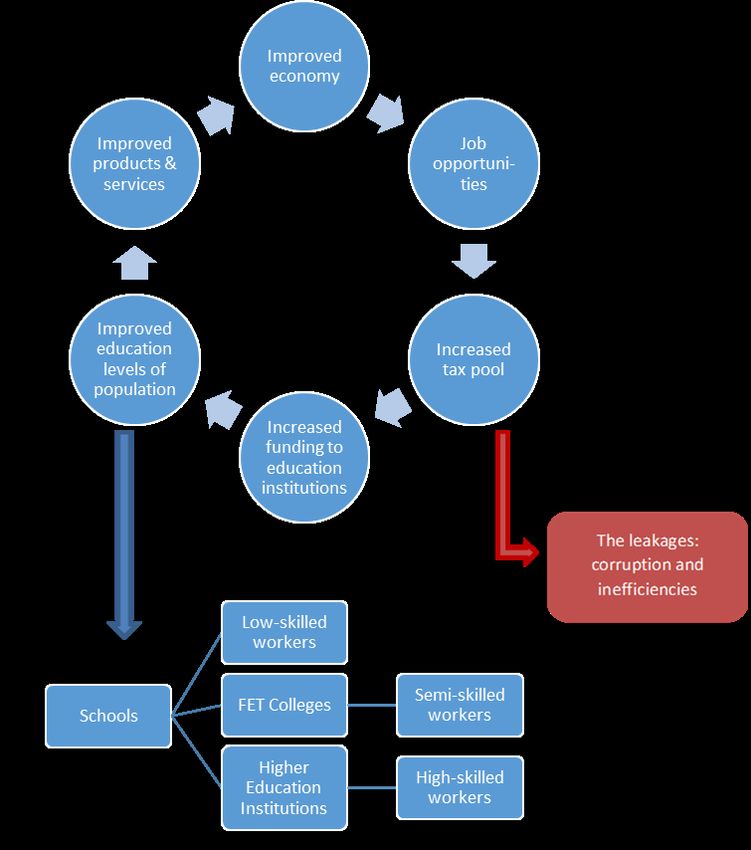
Contents
1 Executive Summary .................................................................................................................. 3
2     Implications of #Feesmustfall for RSA Universities.................................................................. 4
    2.1      Psychological Considerations Of Free or More Affordable Higher Education ................. 4
    2.2      Financial Impact and Government Priorities .................................................................... 6
3     Proposed Student Loan Regulatory Framework .................................................................... 11
    3.1      Challenges of the Current System.................................................................................. 11
    3.2      Proposed New Framework ............................................................................................. 13
      3.2.1     Apply NSFAS as a Government loan fund, available to all students, and not only
      the poor, by implementing a sliding scale based on the Individual Tax Tables ..................... 13
      3.2.2         Requirements to Qualify for the Government Loan Fund....................................... 14
      3.2.3         Merit-bursaries to Reduce Loan Amounts .............................................................. 14
      3.2.4         Enforce Repayment Terms including Interest ........................................................ 15
      3.2.5         SARS Mechanism to Deduct Repayments from Students’ Salaries ...................... 15
4     Closing Suggestions ............................................................................................................... 16
5     Contact details ........................................................................................................................ 17
6     Reference List ......................................................................................................................... 18

                                                                       2
1 EXECUTIVE SUMMARY
Universities have been forced to raise higher education fees with above inflation rates due to
increasing operating costs and higher student numbers and decreasing real term Government
funding. While free higher education or other alternative funding models are being considered, it
is important to remember that the higher education sector is at stake: a sector that plays a vital
role in creating improved lives for all South Africans.
The psychological considerations surrounding fee free or more affordable higher education
indicates a need for a stable funding framework. Financially, such a sustainable framework is
desperately required or universities will once again need to increase student fees at
unreasonable rates to maintain quality. Fee free higher education is not viable in South Africa as
significant funds will need to be reallocated from other sectors that also require funding, or it will
have to be collected from already overburdened tax payers.
This report therefore proposes a viable student fee regulatory framework: subsidised higher
education with the effective use of the already implemented National Student Financial Aid
Scheme.
32 IMPLICATIONS OF #FEESMUSTFALL FOR RSA UNIVERSITIES
On 23 October 2015, the presidency announced a zero percent tuition fee increase for the 2016
academic year after 10 days of revolutionary student protests (Fataar, 2015). Protests
commenced on 14 October 2015 at Wits University in Johannesburg (Fataar, 2015) after an
announcement of a 10.5 percent increase (almost double inflation) was communicated (Fourie,
2015).
The idea of free higher education, which had started with free education to the poor, became a
demand for free education for all. Although free higher education may be an ideal, it has proven
to reproduce and reinforce inequalities, and is not affordable by poor political economies in the
long run as increased enrolments require growing resources to sustain quality education (Langa,
Wangenge-Ouma, Jungblut, & Cloete, 2016).
Several political factors played a role in the #Feesmustfall campaign, which abused students’
legitimate concerns and discredited the campaign. This report does not discuss these political
factors.
2.1 PSYCHOLOGICAL CONSIDERATIONS OF FREE OR MORE AFFORDABLE HIGHER
EDUCATION
Research indicates a variety of responses of people when people pay for a product in
comparison with not having to pay for it. Some are of the opinion that cost reflects value, and the
higher the financial investment made, the higher the value that is attributed. Cialdini (2009)
proposes that scarcer things are valued more highly and that free commodities, which can mostly
be considered as a scarcity, might therefore also then be valued highly. Free commodities also
appear to be valued not only due to its decreased cost, and thus cost efficacy, but also due to
higher associated benefits attributed to these products (Shampanier, Mazar, & Ariely, 2007).
Whether a product is valued, depends more on an individual’s need therefor, than whether it was
paid for (Hoffman, Barrett, & Just, 2007).
The cost of tertiary education, however, is not a product that can be bought or ‘given’ – a price
can only be attributed to the opportunity to study. The extent to which free or more affordable
higher education may impact students, depends on the most prominent factors motivating
students to study, and whether these factors may be impacted by introducing free or more
affordable higher education.
Brophy (1987) suggested that the motivation to learn is an ability acquired through general
experience, but encouraged most directly through modelling, communication of expectations and
direct instruction or socialisation by others, especially parents or other primary caregivers and
teachers. Parents are the earliest source of information, helping their children to understand and
create an image of the outside world through answering their questions, familiarising them to
different situations and sharing different rituals and stories. They are the primary intermediaries
in the development of their children’s attitude towards life and learning. Certainly, if children
developed confidence, a sense of self-worth and competence, they will be ready to face
challenges and attain successes. Regrettably, if children do not perceive themselves as
competent, due to the unavailability or overly anxious and punishing involvement of parents, they
may develop a fear of failing and will find it very difficult to motivate themselves from within.
In academic institutions, lecturers play a vital role in the development of their students’ attitude
towards learning through the nature of their teaching and the expectations they hold for their
students (Afzal, Ali, Khan, & Hamid, 2010). Student motivation is often separated into two types,
namely intrinsic and extrinsic motivation.
4Intrinsically motivated students find their motivation within themselves and engage in learning out
of interest, pleasure, or to achieve their own scholarly and personal goals and experience a
sense of accomplishment (Afzal et al., 2010). Extrinsically motivated students engage in learning
to attain a reward, such as good grades, prizes or a parent’s or lecturer’s approval or to avoid
possible punishment (Afzal et al., 2010). Intrinsically motivated students tend to engage more
intensively and consistently in their learning which produces better and more consistent
academic performance. This is also found to be a mutually causal relationship where students’
motivation enhances their academic performance, which again enhances their academic
performance. On the other hand, students with extrinsic motivation who feel compelled to learn,
and who may put minimal efforts to achieve maximum appreciations, may show difficulty
maintaining their motivation or academic performance.
A study performed by Chamorro-Premuzic (2013) on the impact between compensation,
motivation and performance in the work environment, concluded that extrinsic motivation,
including financial benefits, has proven to be a poor motivating factor and may in fact be
demotivating through diminishing intrinsic motivation (Afzal et al., 2010). Therefore, if we aim to
understand or enhance student’s attitudes towards and academic performances in their studies,
one must focus on the intrinsic motivational factors of students and acknowledge uniqueness of
the motivating forces at play in each individual’s life.
It is also important to consider the South African context within which the #Feesmustfall
campaign was launched. Students are sent to university with great struggle due to significant
financial difficulties. It may be helpful to consider what the motivating factors may be for such
students in the context of Maslow’s hierarchy of needs. If students’ fundamental needs aren’t met
we can imagine that it will be very challenging to remain motivated to persist in their studies.
According to probably the most widely known theory of human motivation, as described by
Maslow (1943), the five human needs motivating behaviour are physiological; safety;
belongingness and love; esteem and self-actualisation needs.
These needs are arranged from lower (deficiency) needs which must at least be partially satisfied
before the higher (growth) needs become influential (Sadock & Sadock, 2007). For instance if
you are desperately hungry or have compromised safety and fear for your life or bodily integrity,
your motivation will be dominated by these physiological needs (Maslow, 1943). But as these
most basic needs are satisfied, motivation through the higher needs occur (Schultz & Schultz,
2001). Satisfaction of these higher needs can then contribute to improved health and growth and
is also psychologically beneficial by leading to contentment, accomplishment and fulfilment. If a
student arrives at a university, far from their home and support system, with only enough money
to pay for registration, they are extremely vulnerable to deprivation of their fundamental needs,
which will hinder them greatly in their motivation to study. The motivation of the student therefore
also depends greatly on their ability to adjust to the demands that they are faced with, including
but not limited to, academic demands. Support systems at universities are therefore very
important, especially for students from less privileged backgrounds, which transcend providing
free education.
From the above, it is clear that intrinsic motivation is necessary to create a student culture that is
motivated, responsible, hard-working and appreciative. In doing this, students’ primary needs
need to be addressed by providing support and stability, which can be done through the
provision of subsidised higher education.
52.2 FINANCIAL IMPACT AND GOVERNMENT PRIORITIES
In 2015, tuition fees ranged between R25 710 and R64 500 (Write, 2015). At an average of
R45 105 and taking the number of university students of 2013 into account (983,698 students
according to the Department of Higher Education and Training (2015)), it will cost the
Government approximately R44.4 billion to achieve tuition free education. This calculation
disregards any growth in student numbers from 2013 onwards, and excludes any cost
adjustment to 2015 tuition fees. In addition, the amount neither includes any funding provided for
infrastructure, development, etc. nor does it include any funding for accommodation, meals,
books and travel that the National Student Financial Aid Scheme (NSFAS) currently offer.
Currently, the NSFAS allows a maximum funding of R71 800 per annum per student, indicating
that approximately 62.8 percent (45 105/71 800) relates to tuition fees. The 2016 NSFAS funding
to universities amounts to R8.9 billion (Department of Higher Education and Training, 2016).
Table 1 indicates that a minimum of R17.1 billion additional funding is required to achieve fee
free higher education.
Table 1: Minimum annual funding required from Government for tuition free higher
education.
Description Amount (R bn)
Tuition fees required (2015 tuition fees × 2013 student numbers) 44.37
2016 NSFAS funding for accommodation, meals, books and travel (R8.9bn × 3.31
37.2%) 1 (Department of Higher Education and Training, 2016)
2016 Buildings & other infrastructure earmarked grant (Department of Higher 2.43
Education and Training, 2016)
2016 Development funds earmarked grant (Department of Higher Education 1.63
and Training, 2016)
2016 Other earmarked grants (Department of Higher Education and Training, 2.23
2016)
Total 53.97
Total funding provided in 2016 36.86
Minimum shortfall for free higher education 17.11
Reallocating the amount from other sectors’ funding, may create negative repercussions.
Currently, Government contributes approximately 0.9 percent of GDP to higher education (Langa
et al., 2016; South African Institute of Race Relations, 2016), which means that the GDP needs
to grow by R1.9 trillion to sustain free higher education.
The South African economy is under huge pressure with negative economic growth in the first
quarter of 2016. South Africa’s economy decreased by 1.2 percent quarter-on-quarter
(seasonally adjusted and annualised). Year-on-year growth for the same quarter was -0.2
percent (Stats SA, 2016a). According to Neil Roets, CEO of debt management firm Debt Rescue,
South Africa is going to be further pressurised after the announcement that the United Kingdom
exit the European Union, as the United Kingdom is the biggest single investor in the South
African economy (Times Live, 2016b).
Dawie Roodt, independent economist, is of the opinion that the economic uncertainty
increasingly worries investors: "I think it is important first of all to realise that there is no such
thing as free education. Even if the free education would be implemented, it is not going to be
free because some will have to pay for that. The reality is that the tax payers in South Africa are
already overburdened, they are not able to pay more tax. Even if so-called free education is
being implemented it will come at a huge cost to the South African economy (Moerane, 2015)."
1 Assuming that 70 per cent of the NSFAS’ funding is towards tuition fees.
6Collecting the additional funding from current taxpayers, would therefore be unreasonable and
unsustainable as it will further reduce spending in the already pressured current economic
climate, lowering chances of economic growth even further. Clearly, free higher education is not
sustainable for South Africa.
One of the reasons that South African students are fighting for free higher education is to
improve their quality of living. South Africa is faced with high rates of unemployment. This rate for
South Africa was 26.7 percent for the first quarter of 2016, and specifically for the youth, it was
54.5 percent, which is estimated to grow to 59.58 percent for the same quarter in 2017 (Trading
Economics, 2016b). Reducing unemployment is also one of the reasons the Department of
Higher Education and Training (DHET) has set forth growth requirements to universities to
increase the number of graduates. Government ultimately requires an improvement in quality
education and innovation through research from South African universities (Department of Higher
Education and Training, 2013; National Planning Commission, 2011; Wangenge-Ouma & Cloete,
2008). However, achieving the objectives set by Government will require universities to
significantly expand its infrastructure, to establish effective administrative systems, and to recruit,
train and retain high quality higher education staff, which will require significant funds
(Department of Higher Education and Training, 2013).
In South Africa, the affordability of higher education remains a challenge due to declining state
funding in real terms (reducing by 1.1 percent from 2000 to 2012) and the low portion of gross
domestic product going to higher education (around 0.9 per cent) (Langa et al., 2016; South
African Institute of Race Relations, 2016).
The last ten years show a decrease of nine percentage points in Government subsidies as a part
of total university income (see Table 2). Although student numbers have increased by 69.8
percent between 2000/01 and 2014/15, total State finance for universities as a proportion of
gross domestic product increased by only 25.4 per cent and total State finance for universities as
a proportion of total State expenditure decreased by 9.8 per cent for the same period (South
African Institute of Race Relations, 2016).
Table 2: South African higher education income sources.
Source 2000 2012
Student fees 24 31
Government 49 40
Third stream 27 29
Total 100 100
Source: South African Institute of Race Relations (2016).
Universities have been increasing tuition fees to mitigate shortfalls while ensuring quality of
service. Table 3 presents a five year comparison of the average tuition fee increases at South
African universities, in comparison with the country’s inflation rate. The frustration displayed by
South African university students is understandable since tuition fee increases are substantially
higher than inflation rates, reducing the opportunity to obtain higher education. Graduates have a
much lower unemployment rate (5.1 percent) than matriculates (25.5 per cent) – see Table 4.
7Table 3: A five year comparison of annual fee increases at South African universities in
comparison with the country’s inflation rate, as well as North-West University’s internal
rate of inflation.
Year Annual increase rate in Average inflation rate of Annual NWU internal
cost of Education (Stats South Africa (CPI) 2 inflation rate
SA, 2016b) (Inflation.eu, 2016) (North-West University,
2016)
2016 0.00 6.55 8.18
2015 9.30 4.51 9.25
2014 8.70 6.13 10.59
2013 9.00 5.77 10.36
2012 9.00 5.75 9.58
Table 4: Unemployment rate of the working-age population of South Africa at the fourth
quarter of 2015.
Education level Unemployment
rate
Less than matric 28.5
Matric 25.5
Other tertiary 15.6
Graduate 5.1
Source: Stats SA (2015).
Universities have been increasing tuition fees at rates above inflation due to rising operational
costs. Although South Africa’s inflation rate was 4.51 percent in 2015, the following examples of
cost increases were e.g. experienced by the North-West University: computer and software
expenses increased 20 percent; books and electronic databases increased 11 percent; cleaning
costs increased 10 per cent; and water and electricity increased 7.3 percent (refer to Table 3 –
Annual NWU internal inflation rate). The highest cost increases are experienced in imports, due
to the weakening rand. The US Dollar gained 23.98 per cent against the South African Rand
(ZAR) during the past 12 months from June 2015 (Trading Economics, 2016c).
When comparing the internal rate of inflation of academic institutions with the inflation rate of the
country (Table 3) it is clear that the current financial basis of universities is not sustainable. The
only way of reducing the operational costs of the university, is to strengthen South Africa’s
economy, which will lead to a stronger currency as well as lower costs of imports. In the
meantime, higher education institutions desperately require increased funding from Government.
With the absence of sufficient funding, universities will be forced to either increase tuition fees at
higher than expected rates, or quality higher education will be compromised. By compromising
quality, prospective students (the professionals of the future) may immigrate to countries with
better institutions, ultimately weakening South Africa’s economy further. Alternatively they may
end up with worthless degrees and diplomas, student debt and may still have no job
opportunities.
Ideally, a country would like to increase its level of education as this will ultimately lead to a
stronger economy. The quality (skills, abilities, training and education) and quantity of a country’s
human resources influences economic growth (Ntisha, 2016). This is proven when scrutinising
the compilation of the United States’ labor force. According to Bajpai (2016), the United States
2 The average of 12 monthly inflation rates of a calendar year.
8has the strongest economy in the world based on nominal GDP. Table 5 displays the high levels
of education of its labor force in comparison with that of South Africa.
Table 5: Education levels of South Africa’s citizens in comparison with the United States
set out as percentages of the labor force.
Education Level South Africa United States
(Stats SA, 2015) (Bureau of Labor
Statistics, 2016)
Less than matric 60.9 7.9
Matric 26.7 25.9
Other tertiary 7.1 27.4
Graduate 4.4 38.8
Other 1.0 -
Total 100 100
However, it is emphasised that improved education does not only take place at higher education
institutions; it commences with the schooling system and also includes education provided by
Technical Vocational Education and Training (TVET) colleges. One of the main reasons of low
graduation rates at South African universities (15 percent compared to the international norm of
25 percent) is attributable to entrants from poor school education backgrounds, increasing the
cost to produce graduates (Department of Higher Education and Training, 2013; National
Planning Commission, 2011). South Africa’s schooling system is substandard, proven by the low
numeracy rate of 11 percent of grade nine pupils (Times Live, 2016a). As soon as the country’s
schooling system can be improved, education levels will increase, increasing income levels and
therefore also the tax pool: “Greater educational attainment increases the likelihood that an
individual will be employed and raises the level of his or her wages when employed. Although
researchers cannot estimate the causal relationship precisely, the available evidence indicates
that more education is associated with at least 7 to 10 percent higher earnings per additional
year of schooling among those who are employed. The higher earnings realised by more highly
educated people result in higher tax payments” (Rand Education, 2009). Individuals and
corporations make up 37.5 and 16.9 percent of South Africa’s tax revenue respectively (National
Treasury, 2016). Increasing the tax base of the country is therefore directly dependent on the
amount of taxpayers, being either employees or entrepreneurs.
Technically, the framework presented in Figure 1, a virtuous process, can be initiated at any
point and this ideal should therefore be attainable in South Africa. However, the problem is that
there are leakages in the system: corruption and inefficiencies.
South Africa scored 44 out of 100 on the Corruption Perception Index (Trading Economics,
2016a). A score below 50 indicates a significant corruption problem. In 2009, Government
corruption totalled R70 billion (News24, 2012), causing diminishing trust of the country’s citizens
in the public sector (Transparancy International, 2014). Lawson Naidoo of the council of the
advancement of South African constitutions stated that an estimate of 20 percent of the GDP is
lost to corruption annually (News24, 2012). South African organisations also reported the highest
economic crime rate in the world (PwC, 2016). Corruption causes the distributable tax pool to
decrease, causing the flow in Figure 1 to decrease year-on-year.
In addition to corruption, inefficiencies exist in the distribution of taxes. An example is social
grants: R457.5 billion will be spent on social grants over the next three years (National Treasury,
2016). By utilising the social grants more effectively such as to distribute to higher education, it
can lead to 12 years more funding based on the R36.86 billion funding (including NSFAS
funding) granted to universities in 2016 (Department of Higher Education and Training, 2016). It
is suggested that this funding will be better applied in vocational training, enabling more citizens
to find jobs, which will increase salaries earned, thereby stimulating the economy.
9Figure 1: Illustrating the proposed method of improving South Africa’s economy by way
of increased education levels.
In short, universities currently suffer year-on-year shortfalls due to increased operating costs and
higher student numbers, without the accompanying increase in subsidies from Government. The
options for universities include a combination of increased third stream income, increased
student fees and increased State funding. Government can only contribute more if the economy
grows and if leakages in the system (corruption and inefficiencies) are stopped. The State
administrative machinery is too large for an economy of our size.
Taking into account the considerations contained in this report, free higher education in South
Africa is not viable. Section two proposes a continuation of subsidised higher education.
103 PROPOSED STUDENT LOAN REGULATORY FRAMEWORK
Twenty-four percent of the funding allocated to universities from Government, relates to the
NSFAS (Department of Higher Education and Training, 2016). According to the Minister of
Higher Education and Training, Dr Blade Nzimande, the NSFAS has been tasked to provide an
efficient and sustainable financial aid system for poor yet academically eligible students.
Countries like Australia and Norway were used as examples in developing the proposed
subsidised funding framework.
Norwegian State universities and university colleges as a rule do not charge tuition fees to
students, including international students, but all students need to pay a semester fee of
NOK300-600 each semester. This means: no fee free education.
Funding for tertiary education in Australia is through a combination of Government subsidies,
student fees and loans. The Higher Education Loan Programme (HELP) is an interest free loan
available to assist with the payment of tuition fees. Even though interest is not charged, the
amount outstanding is subject to an index adjustment in terms of the CPI every year. The
repayment of HELP is compulsory and is regulated as displayed in Table 6.
Table 6: HELP Repayment Income compulsory repayment 2016/17.
Repayment income ($) Repayment rate (%)
Below 54,869 Nil
54,869-61,119 4.0
61,120-67,368 4.5
67,369-70,909 5.0
70,910-76,222 5.5
76,223-82,550 6.0
82,551-86,894 6.5
86,895-95626 7.0
95,627-101,899 7.5
101,900 and above 8.0
Source: Australian Taxation Office (2016).
3.1 CHALLENGES OF THE CURRENT SYSTEM
The current NSFAS system is neither operating in a sustainable framework nor managed to
render sustainable outcome.
The NSFAS is a loan and bursary scheme funded by the DHET for those who do not have the
financial means to fund their studies and/or cannot access bank funding, study loans or bursaries
(South African Government, 2016). The NSFAS provide loans for low income households with a
threshold annual income of R120 000 per annum or less (National Student Financial Aid
Scheme, 2015).
Table 7 displays the NSFAS contribution in Rand value and number of students for the 2013 and
2014 academic years.
11Table 7: NSFAS Student awards.
Academic years 2014 2013
Number Number
Rand value of Rand value of
students students
Student awards by
institution category
Universities 6,969,940,822 186,150 6,729,069,970 194,923
TVET colleges 1,991,487,809 228,642 1,953,253,361 220,978
Other institutions 1,041,602 10 19,082,247 464
8,962,470,233 414,802 8,701,405,578 416,365
Source: National Student Financial Aid Scheme (2015).
The total student headcount enrolment for 2013 at the (then) 23 universities, reached 983 698 in
the 2013 academic year (Department of Higher Education and Training, 2015). The NSFAS
therefore funded only 20 percent of the total university headcount for 2013. This means that 80
percent of students need to find finances elsewhere. The “missing middle” is students whose
families earn above the required R120 000 per annum. This exclusion has tremendous
implications such as the recent #feesmustfall campaign. These middle-class families cannot
raise funds from commercial banks because the risk of default is too high, while at the same time
they do not qualify for the NSFAS, due to the set thresholds (Mtwesi, 2016).
Table 8 sets out the low loan recoveries for the 2014 and 2015 financial years, indicating that
only about 3.5 percent of funds distributed through the NSFAS are collected.
Table 8: Loan repayments recoveries (R and %) against NSFAS funding for that academic
year.
Repayments 2015 2014 2014 2013
financial year academic financial year academic
(R) year (%) (R) year (%)
Loan recoveries including
donor settlements and credit 261,213,101 2.90% 372,326,300 4.28%
balances on fee accounts
Loan recoveries excluding 247,200,000 2.75% 261,213,101 4.00%
donor settlements and credit
balances on fee accounts
Source: National Student Financial Aid Scheme (2015).
Currently, the NSFAS loan payback is linked to a salary threshold of R30 000 per annum.
Interest is charged at 80 percent of the bank repo rate and the repayment amount starts at three
percent, increasing on a sliding scale to a maximum of eight percent of the salary once the salary
reaches R59 300 per annum. The maximum funding that a student can qualify for per academic
year is R71 800. If a student therefore earns R59 300 per annum and received the maximum
loan amount for three years of R215 400 (R71 800 x 3 years), it will take approximately 45 years
to repay the capital loan amount3.
The repayment period of the NSFAS loans can therefore be very extensive. In addition to this, a
lot of the funding provided is never collected, making the current system inefficient, while
thousands of students could get the benefit from these funds if repayment terms were
implemented.
3 The calculation assumes no increase in salary.
12Another problem with the current funding system is the high dropout rate of first year students
(between 50 and 60 percent) (eNCA, 2015); funding that could have been distributed to
deserving students. The high dropout rate can be contributed to the poor schooling system as
discussed in section 1.2. With the current schooling system, it is almost effortless to meet the
basic requirements for provisional bachelors’ admission at universities. It is recommended that
the schooling system improve and/or that universities set higher admission requirements to allow
only the truly academically deserving students. In doing so, universities will suffer a much lower
dropout rate, enabling them to make effective use of limited funds. Students that do not meet the
admission requirements of universities can then enter TVET colleges that focus on vocational or
occupational training and education by nature, targeting post-school students from as early as
Grade 9.
3.2 PROPOSED NEW FRAMEWORK
The following student fee regulatory funding framework is proposed to apply from the 2017
academic year onwards: using the NSFAS as a means of providing subsidised education for all
students.
The following subsidised funding framework is presented:
1. Apply NSFAS as a Government loan fund, available to all students, and not only the poor,
by implementing a sliding scale based on the Individual Tax Tables.
2. Formalise requirements to qualify for a Government loan fund through the South African
Revenue Service (SARS) 4.
3. Reward academically deserving students with merit-bursaries to reduce the loan balance for
tuition fees.
4. Enforce repayment terms with interest through SARS.
5. Make use of SARS to collect repayments from students’ salaries.
3.2.1 Apply NSFAS as a Government loan fund, available to all students, and not only
the poor, by implementing a sliding scale based on the Individual Tax Tables
Income brackets are already allocated for individuals to calculate the monthly Pay as You Earn
(PAYE). This is a good guideline to apply to distribute funding between all classes of students.
Table 9: Rates of tax for individuals for the 2017 tax year.
Taxable income (R) Rates of tax (R)
0 – 188 000 18% of taxable income
188 001 – 293 600 33 840 + 26% of taxable income above 188 000
293 601 – 406 400 61 296 + 31% of taxable income above 293 600
406 401 – 550 100 96 264 + 36% of taxable income above 406 400
550 101 – 701 300 147 996 + 39% of taxable income above 550 100
701 301 and above 206 964 + 41% of taxable income above 701 300
Source: South African Revenue Service (2016).
Table 10 proposes an application of Government loan funding per income tax bracket based on
family income.
4 In the UK the successful student loan payback mechanism is managed through the UK income tax
system.
13Table 10: A proposed framework for applying Government loan funding for higher
education per income tax bracket based on family income.
Taxable income (R) Qualifying % of loan amount
100% of (100% tuition fees, accommodation, meals, books and
0 – 188 000
travel)
80% of (100% tuition fees, accommodation, meals and books and
188 001 – 293 600
50% of travel)
60% of (100% tuition fees and accommodation and 50% of meals,
293 601 – 406 400
books and travel)
40% of (100% tuition fees and 75% of accommodation and 50%
406 401 – 550 100
for meals and books and 25% of travel)
550 101 – 701 300 20% of (100%tuition fees and 50% of accommodation)
701 301 and above 10% of (100% tuition fees)
The above sliding scale ensures that all students have an equal opportunity to receive the benefit
of a low-interest rate Government loan, but still ensures that the poor academically eligible
students have the opportunity to study and address the “missing middle” issue.
Students can qualify for varying amounts up to the maximum of a set amount, e.g. R71 800 for
2016 (which is the 100 percent funding amount for tuition fees, accommodation, meals, books
and travel) per academic year.
The proposed Government loan needs to be mainly self-sustaining after the first cycle of funding.
Ideally, the only Government funding required would be to cover the loan system’s operating
cost, funding for bursaries through this system (see 2.2.3) and minimal bad debts.
3.2.2 Requirements to Qualify for the Government Loan Fund
Currently, first year students must have obtained an APS-score of 26 during their final Grade 12
exams and must apply for the Government loan before 30 October of the preceding year of
study. Also, senior students must pass at least 60% of the modules taken to be eligible for a
Government loan in the next academic year. The closing date for senior students is 30
September annually. It is agreed that these terms are reasonable.
In addition to these requirements, it is suggested that all students have to obtain an income tax
number as part of the registration process at all universities. This allows the NSFAS to keep track
of all the details of the students to enable the NSFAS to deduct the required repayments at a
later stage.
3.2.3 Merit-bursaries to Reduce Loan Amounts
It is suggested that the loan portion relating to tuition fees may be converted into a bursary on a
level of merit. To encourage students to graduate, and as the NSFAS loans carry no interest
during the time of studies, it is suggested that a sliding scale be introduced where the average of
a students’ degree is calculated, which will determine the amount of outstanding fees to be
converted to a bursary. A different framework may also be used for degrees obtained in scares
skills versus other skills as suggested in Table 11.
14Table 11: Proposed average to obtain for conversion of the NSFAS loan to a bursary,
distinguished between scarce skills and other skills.
Scarce skills Other skills
% merit bursary % merit bursary
Average % achieved Average % achieved
relating to tuition relating to tuition
for total modules for total modules
fees fees
75% > 100% 75% > 100%
65% - 74% 90% 70% - 74% 90%
55% - 64% 70% 65% - 69% 70%
50% - 54% 40% 60% -64% 60%
55% - 59% 50%
50% - 54% 40%
This section is to motive and create hard working students, which will ultimately lead to fee-free
education for academically deserving poor students (as they receive 100 percent loans) and
subsidised education for other academically deserving students (based on the percentage loan
obtained per the income tax sliding scale).
3.2.4 Enforce Repayment Terms including Interest
It is suggested that the repayment terms be thoroughly communicated on the NSFAS’ website,
as well as the loan contract agreed upon between the NSFAS and the student.
The current interest charge of 80 per cent of the national repo rate, as well as the repayment
terms of between three and eight percent is considered reasonable. It is suggested that these
terms are just enforced to create a culture of responsibility.
Students that do not complete their studies should still be held responsible for any outstanding
loan amounts. In such a case, and when students’ details change (i.e. they change address)
without informing the NSFAS, the collection process is still made possible if these students have
an income tax number.
3.2.5 SARS Mechanism to Deduct Repayments from Students’ Salaries
One of the major issues relating to the current NSFAS system is the repayment of loans.
Communication regarding repayment is vague 5 and students don’t communicate changes of
personal details, such as addresses, with the NSFAS. According to the NSFAS’ website, SARS
can be used as the middle man to collect repayments from the students’ salaries. The same
principle can apply for the collection through an ITA88, where SARS appoints the employer as an
agent to collect money on behalf of SARS by law.
5 When considering the communication available regarding repayment on the NSFAS website.
154 CLOSING SUGGESTIONS
ANC Head of Policy Jeff Radebe urged the youth to take education seriously on 27 June 2016:
"We have many opportunities that are available to young people in our country today. What the
youth of 1976 dreamed about for better education‚ the youth of 2016 must be grateful for what is
available to them now (Goba, 2016)”.
Therefore, and based on the findings of this report, the following are suggested:
1. Transform discussions surrounding fee free higher education to subsidised higher
education;
2. Increase Government funding to universities to preserve and improve quality higher
education services;
3. Address leakages (corruption and inefficiencies) in the State budget and prioritise
economic growth to increase available Government funding; and
4. Effectively apply the already implemented National Student Financial Aid Scheme as a
means to a sustainable student fee regulatory framework with specific focus on collection
of loan amounts.
~ Let’s build on the present to better the future ~
165 CONTACT DETAILS
The following persons are willing to present to the Commission on behalf of North-West
University if called upon in either English or Afrikaans:
5.1.1 Elmarie de Beer
Executive Director: Finance and Facilities
Email: Elmarie.debeer@nwu.ac.za
Telephone no: 018-299 4922
5.1.2 Lerike Jacobs
Email: 12690988@nwu.ac.za
Telephone no: 018-299 3299
5.1.3 Anneke Moolman
Email: Anneke.moolman@nwu.ac.za
Telephone no: 018-299 3383
176 REFERENCE LIST
Afzal, H., Ali, I., Khan, M. A., & Hamid, K. (2010). A study of university students’ motivation
and its relationship with their academic performance. International Journal of
Business and Management, 5(4), 80-88.
Australian Taxation Office. (2016). HELP, TSL, SSL and SFSS repayment thresholds and
rates. Retrieved from https://www.ato.gov.au/Rates/HELP,-TSL-and-SFSS-
repayment-thresholds-and-rates/
Bajpai, P. (2016). The world's top 10 economies. Retrieved from
http://www.investopedia.com/articles/investing/022415/worlds-top-10-economies.asp
Brophy, J. (1987). Synthesis of research on strategies for motivating students to learn.
Educational Leadership(October), 40-48.
Bureau of Labor Statistics. (2016). The employment situation - May 2016. Retrieved from
http://www.bls.gov/news.release/pdf/empsit.pdf
Chamorro-Premuzic, T. (2013). Motivating people: Does money really affect motivation? A
review of the research. Retrieved from https://hbr.org/2013/04/does-money-really-
affect-motiv
Cialdini, R. B. (2009). Influence: science and practice. Boston, Massachusetts: Pearson.
Department of Higher Education and Training. (2013). White Paper for Post-School
Education and Training. Retrieved from
http://www.dhet.gov.za/SiteAssets/Latest%20News/White%20paper%20for%20post-
school%20education%20and%20training.pdf
Department of Higher Education and Training. (2015). Statistics on Post-School Education
and Training in South Africa: 2013. Retrieved from
http://www.dhet.gov.za/DHET%20Statistics%20Publication/Statistics%20on%20Post-
School%20Education%20and%20Training%20in%20South%20Africa%202013.pdf
Department of Higher Education and Training. (2016). University state budgets: Public
report. Retrieved from
eNCA. (2015). SA student dropout rate high. Retrieved from https://www.enca.com/south-
africa/student-dropout-rate-high
Fataar, A. (2015). Why the fees must fall. Retrieved from
https://socialistworker.org/2015/10/27/why-the-fees-must-fall
Fourie, J. (2015). A blanket university fee reduction benefits the wealthy – and slows
change. Retrieved from https://www.enca.com/opinion/blanket-university-fee-
reduction-benefits-wealthy-%E2%80%93-and-slows-change
Goba, N. (2016). Jeff Radebe encourages youth to take education seriously. Retrieved
from http://www.timeslive.co.za/politics/2016/06/27/Jeff-Radebe-encourages-youth-
to-take-education-seriously
Hoffman, V., Barrett, C. B., & Just, D. R. (2007). Do free goods stick to poor households?
Experimental evidence on insecticide treated bednets. World Development, 37(3),
607-617.
Inflation.eu. (2016). Historic inflation South Africa - CPI inflation. Retrieved from
http://www.inflation.eu/inflation-rates/south-africa/historic-inflation/cpi-inflation-south-
africa.aspx
Langa, P., Wangenge-Ouma, G., Jungblut, J., & Cloete, N. (2016). South Africa and the
illusion of free higher education. Retrieved from
http://www.universityworldnews.com/article.php?story=20160223145336908
Maslow, A. H. (1943). A theory of human motivation. Psychological Review, 50(4), 370-396.
Moerane, B. (2015). SA far from free tertiary education: economist. Retrieved from
http://www.sabc.co.za/news/a/76b40b004b239e5bbb38fb445cadceaa/SA-far-from-
free-tertiary-education:-Economist-20153112
Mtwesi, A. (2016). The student funding gap and the ‘missing middle. Retrieved from
http://hsf.org.za/resource-centre/hsf-briefs/the-student-funding-gap-and-the-
2018missing-middle2019
18National Planning Commission. (2011). National Development Plan 2030 - Executive
Summary. Retrieved from
http://www.gov.za/sites/www.gov.za/files/Executive%20Summary-
NDP%202030%20-%20Our%20future%20-%20make%20it%20work.pdf
National Student Financial Aid Scheme. (2015). 2014/15 Annual Report. Retrieved from
http://www.nsfas.org.za/content/reports/NSFAS%20AR%202014-15.pdf
National Treasury. (2016). National Treasury Budget Highlights. Retrieved from
http://www.treasury.gov.za/documents/national%20budget/2016/guides/2016%20Bu
dget%20Highlights%20Card.pdf
News24. (2012). Corruption - SA counting the cost. Retrieved from
http://www.news24.com/MyNews24/Corruption-SA-Counting-The-Cost-20120508
North-West University. (2016). Internal Inflation Budget, 2012-2016.
Ntisha. (2016). Five factors that affect the economic growth of a country. Retrieved from
http://www.economicsdiscussion.net/economic-growth/5-factors-that-affect-the-
economic-growth-of-a-country/4199
PwC. (2016). South African organisations report the highest rate of economic crime in the
world. Retrieved from https://www.pwc.co.za/en/press-room/global-economic-crime-
survey.html
Rand Education. (2009). How Taxpayers Benefit When Students Attain Higher Levels of
Education. Retrieved from
http://www.rand.org/pubs/research_briefs/RB9461/index1.html
Sadock, B. J., & Sadock, V. A. (2007). Human development throughout the life cycle. In C.
W. Mitchel, J. A. Murphy, & K. Millet (Eds.), Synopsis of psychiatry (10th ed., pp. 53-
68). Philadelphia: Lippincott Williams & Wilkins.
Schultz, D. P., & Schultz, S. E. (2001). In M. Taflinger, J. Wilkinson, & S. Wood (Eds.),
Theories of personality (7th ed.). Belmont, CA: Wadsworth/Thomson Learning.
Shampanier, K., Mazar, N., & Ariely, D. (2007). Zero as a special price: the true value of free
products. Marketing Science, 26(6), 742-757.
South African Government. (2016). Apply for financial assistance from NSFAS. Retrieved
from http://www.gov.za/services/tertiary-education/apply-financial-assistance-
national-student-financial-aid-scheme-nsfas
South African Institute of Race Relations. (2016). South Africa Survey 2016: Education.
Retrieved from http://irr.org.za/reports-and-publications/south-africa-survey/south-
africa-survey-2016
South African Revenue Service. (2016). Rates of tax for individuals. Retrieved from
http://www.sars.gov.za/Tax-Rates/Income-
Tax/Pages/Rates%20of%20Tax%20for%20Individuals.aspx
Stats SA. (2015). Quarterly Labour Force Survey - Quarter 4: 2015. Retrieved from
http://www.statssa.gov.za/publications/P0211/P02114thQuarter2015.pdf
Stats SA. (2016a). The economy slides in the first quarter. Retrieved from
http://www.statssa.gov.za/?p=7824
Stats SA. (2016b). Education costs continue to outstrip inflation. Retrieved from
http://www.statssa.gov.za/?p=4460
Times Live. (2016a). Schools letting South Africa down‚ hampering improvements to living
standards. Retrieved from http://www.timeslive.co.za/local/2016/03/07/Schools-
letting-South-Africa-down%E2%80%9A-hampering-improvements-to-living-standards
Times Live. (2016b). UK decision to leave EU has far-reaching consequences for SA:
economist. Retrieved from http://www.timeslive.co.za/local/2016/06/24/UK-decision-
to-leave-EU-has-far-reaching-consequences-for-SA-economist
Trading Economics. (2016a). South Africa economic forecasts 2016-2020 outlook.
Retrieved from http://www.tradingeconomics.com/south-africa/forecast
Trading Economics. (2016b). South Africa unemployment rate. Retrieved from
http://www.tradingeconomics.com/south-africa/unemployment-rate/forecast
Trading Economics. (2016c). South African Rand. Retrieved from
http://www.tradingeconomics.com/south-africa/currency
19Transparancy International. (2014). Corruption by country. Retrieved from
https://www.transparency.org/country/#ZAF
Wangenge-Ouma, G., & Cloete, N. (2008). Financing higher education in South Africa:
Public funding, non-government revenue and tuition fees. South African Journal of
Higher Education, 22(4), 14.
20You can also read