Finite difference based response surface methodology to optimize tailgate support systems in longwall coal mining
←
→
Page content transcription
If your browser does not render page correctly, please read the page content below
www.nature.com/scientificreports
OPEN Finite‑difference based response
surface methodology to optimize
tailgate support systems
in longwall coal mining
Satar Mahdevari1* & Mohammad Hayati2
Designing a suitable support system is of great importance in longwall mining to ensure the safe
and stable working conditions over the entire life of the mine. In high-speed mechanized longwall
mining, the most vulnerable zones to failure are roof strata in the vicinity of the tailgate roadway and
T-junctions. Severe roof displacements are occurred in the tailgate roadway due to the high-stress
concentrations around the exposed roof span. In this respect, Response Surface Methodology (RSM)
was utilized to optimize tailgate support systems in the Tabas longwall coal mine, northeast of Iran.
The nine geomechanical parameters were obtained through the field and laboratory studies including
density, uniaxial compressive strength, angle of internal friction, cohesion, shear strength, tensile
strength, Young’s modulus, slake durability index, and rock mass rating. A design of experiment was
developed through considering a Central Composite Design (CCD) on the independent variables.
The 149 experiments are resulted based on the output of CCD, and were introduced to a software
package of finite difference numerical method to calculate the maximum roof displacements (dmax) in
each experiment as the response of design. Therefore, the geomechanical variables are merged and
consolidated into a modified quadratic equation for prediction of the dmax. The proposed model was
executed in four approaches of linear, two-factor interaction, quadratic, and cubic. The best squared
correlation coefficient was obtained as 0.96. The prediction capability of the model was examined by
testing on some unseen real data that were monitored at the mine. The proposed model appears to
give a high goodness of fit with the accuracy of 0.90. These results indicate the accuracy and reliability
of the developed model, which may be considered as a reliable tool for optimizing or redesigning the
support systems in longwall tailgates. Analysis of variance (ANOVA) was performed to identify the key
variables affecting the dmax, and to recognize their pairwise interaction effects. The key parameters
influencing the dmax are respectively found to be slake durability index, Young’s modulus, uniaxial
compressive strength, and rock mass rating.
Designing a set of sustainable and workable support systems is vital in successfully operating at longwall coal
mines. Longwall mining is classified as an underground mining method, which is associated with controlled
caving of the roof strata concurrent with and essential to the conduct of mining1. Therefore, providing such safe
and stable conditions to work within a longwall face and also in the two adjacent tunnels are necessary.
Experiences gained in mechanized longwall coal mining in recent decades show a progressive development
in high-speed mining besides improvements in health and safety standards. Nonetheless, the problem of roof
failure is still the major factor affecting longwall i ncidents2.
Almost all coal reserves in Iran are exploited by the longwall mining method, and many injuries or even
fatalities are annually reported due to collapses resulted from unstable roof strata. The Tabas longwall mine is
gradually proceeded to depth, and consequently unstable zones at the immediate roof rocks or caved zone are
spreading in the vicinity of active longwall faces. This issue may adversely affect the serviceability of the longwall
gate roadways that are the lifelines of a longwall panel, in which personnel, extracted coal, supplies, and fresh
air are to pass.
Safety and profitability are both important in designing mechanized longwall mining, and it is not satisfactory
to interrupt the mining operations due to the unstable gate roadways. However, stress redistribution around a
1
Department of Mining Engineering, Hamedan University of Technology, Hamedan, Iran. 2Department of Mining
Engineering, Faculty of Engineering, Lorestan University, Khorramabad, Iran. *email: satar.mahdevari@hut.ac.ir
Scientific Reports | (2021) 11:2321 | https://doi.org/10.1038/s41598-021-82104-8 1
Vol.:(0123456789)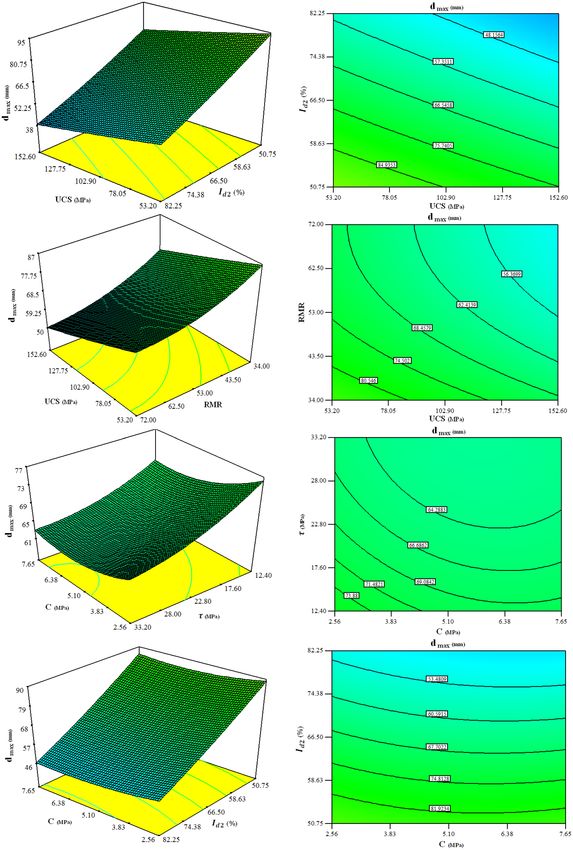
www.nature.com/scientificreports/
longwall panel results in high displacements and deformations, which may lead to delays in the coal production
plan3. Therefore, it is necessary to install the appropriate and adequate support systems for meticulously control
the stability conditions of the mine.
Stability conditions in a longwall panel may be influenced by geological structures, advancement rate, in-situ
and induced stresses, panel orientation, direction of mining, barrier pillar sizes, and support s ystems4. However,
the critical unstable zones in a longwall panel are T-junctions; where the longwall face intersects the tailgate
and headgate roadways. In this respect, Zhu et al.5 denoted that the greatest damage due to rockbursts may be
encountered along the tailgate roadway and ahead of its T-junction (in advance of coalface). Therefore, designing
the suitable support systems in such areas within underground coal mines are necessary to avoid serious destruc-
tions of the installed support systems. Consequently, longwall T-junctions are subjected to severe loadings and
deformations due to approaching and passing the c oalface6.
However, designing a reliable support system is practically an intricate and case-based procedure, which
mostly relies on experience or trial and error. Although many empirical, analytical, and numerical methods were
presented to control roof stability in mechanized longwall panels, the problem is even now a major concern in
most underground coal mines.
Numerous techniques based on experimental, theoretical, and numerical analyses were established to address
the problems of unstable T-junctions such as predicting roof strata behavior, redesigning support installation
plan, and installing suitable support systems. Amongst them, the stability of the longwall tailgate is the most
important ground control measure in the success of designing a longwall mine7.
Due to the importance of the problem, much research has been done in this field. Seedsman8 discussed the
failure mechanisms of longwall tailgates through following the stress and failure paths in the roof strata, and
presented the appropriate support systems for tailgate during face advancement. Tarrant9 combined empirical and
analytical methods to design a stable layout for the longwall tailgate. Kang et al.10 performed a discrete element
numerical method to better understand the mechanism of rock bolts in supporting longwall entries within soft
rocks. Bai and T u11 based on the field observations and numerical simulations investigated the stability condi-
tions of the longwall drift. Mangal and P aul12 reviewed the mechanism of roof caving by theoretical methods
to access the powered support resistance requirement in the mechanized longwall faces. Kang et al.13 combined
the physical and numerical modeling to gain a better understanding of failure mechanisms associated with
sudden roof collapse in longwall faces. Basarir et al.14 applied the global–local modeling approach to analyze
the stability of the longwall roadways, which is applicable for roadways experiencing large convergence. Kang
et al.15 indicated the front abutment stresses ahead of the coalface based on the load transfer mechanics. Ester-
huizen et al.16 developed a numerical model to analyze tailgate stability at two longwall mines based on the field
monitoring data. Darvishi et al.17 also developed a numerical method to investigate the effect of simultaneous
extraction of two longwall panels on the stability of the maingate roadway, and indicated a good agreement with
instrumentation data. Rajwa et al.18 modeled different variants of support designs to investigate the interactions
between powered supports and rock mass during longwall mining.
In real-world situations, there are various types of experiments; just like support designing for underground
coal mining, which seems to be a complicated problem. In this regard, the Design Of Experiments (DOEs)
is a practical approach to describe the variation of information under hypothesized conditions. When the
ranges of treatments are continuous, the relationship between the dependent and independents variables may
be unknown. Therefore, Response Surface Methodology (RSM) aims at approximating the response function
y = f (x1 , x2 , x3 , . . . xn ) + e. In other words, RSM searches an optimal response in a sequence of designed experi-
ments to find the relationship between dependent and independent v ariables19.
RSM as an effective technique was employed in different fields of studies for modeling and optimizing pro-
cesses related to the rock structures. Mollon et al.20 utilized a finite difference based RSM to probabilistically
analyze the mechanized shallow tunnels in frictional and/or cohesive soils. Lü et al.21 employed RSM to investi-
gate the reliability analysis of ground–support interaction in tunnels. Shamekhi and T annant22 developed a meth-
odology for probabilistic rock slope stability assessment using RSM and finite element numerical models. Park
and Park23 employed RSM and numerical modeling to propose an inverse analysis method for the identification
of the rock parameters around tunnels. Raina and M urthy24 predicted the flyrock distance in open pit blasting
using a simplified RSM equation without compromising on the actual field applications. Abdallah and Verdel25
employed RSM together with numerical and experimental analyses to study the impact of mining subsidence on
masonry buildings. Hamrouni et al.26 developed a RSM model to obtain the bending moment on lining and the
surface settlement curve due to tunneling. Rastbood et al.27 developed a finite element based RSM to optimize
the geometrical and mechanical characteristics of tunnel lining segments. Ozfirat et al.28 employed RSM to
investigate the relations between independent variables of geomechanical and machine properties to predict the
performance of roadheaders in an underground metal mine. Park and Park29 proposed a back analysis approach
by combining RSM and finite difference methods to estimate the geotechnical features. And, Heidarzadeh et al.30
applied RSM along with numerical modeling to assess the effect of geometry on rock damage.
This research develops an RSM model based on the geomechanical parameters and numerical simulations
to optimize support systems in longwall tailgates. In addition, the most important parameters affecting roof
strata stability are analyzed and determined to predict unstable zones around the tailgate T-junction in advance
of mining.
Problem statement
Coal or any other layered deposits could be extracted by the longwall mining method through dividing a reserve
in some large rectangular blocks, known as a panel. Before exploitation, each panel is developed by driving a
set of tunnels or roadways on either side of the panel off the main access roadways. The two tunnels on each
Scientific Reports | (2021) 11:2321 | https://doi.org/10.1038/s41598-021-82104-8 2
Vol:.(1234567890)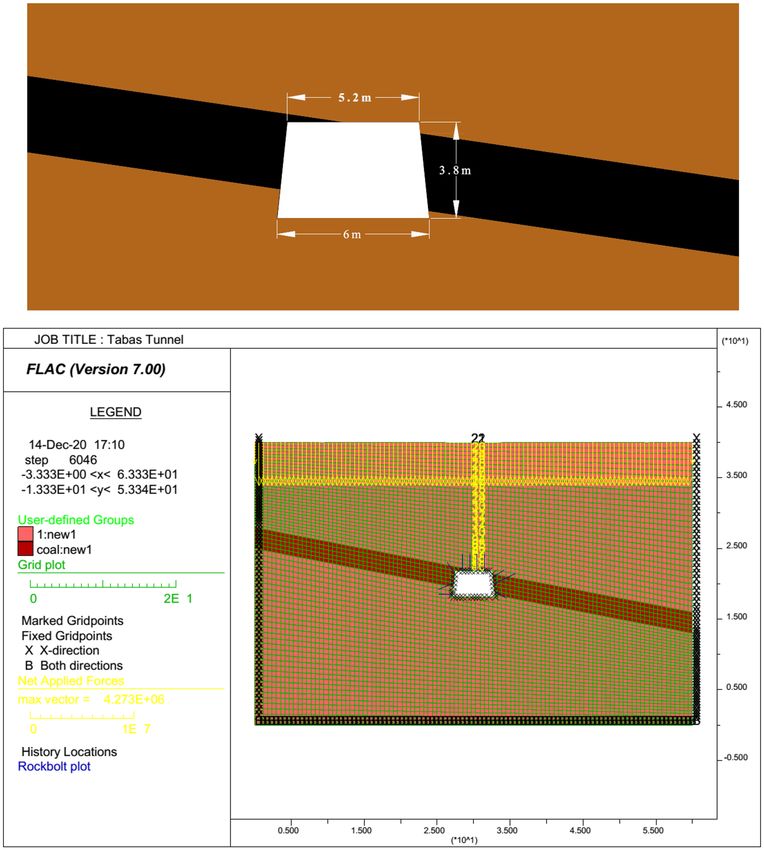
www.nature.com/scientificreports/
Figure 1. Schematic view of coalface, roadways, and T-junctions in a longwall panel.
Figure 2. Location and structural geology of the Tabas mine region, taken from G
oogleEarth32.
side of the panel are necessary to develop the coalface. Each tunnel serves a unique function; headgate for the
transportation of material and personnel, and tailgate for escape way and ventilating the return air. The work-
ing face is created through a slot by joining these two roadways, and the coalface is supported by hydraulic roof
supports to provide a safe working space underground (Fig. 1).
During longwall mining, the immediate roof, which is two to eight times the thickness of the coal seam,
extensively fractures, and falls into the mined-out area. After face advancement, a goaf is formed as the immedi-
ate roof is allowed to cave behind the support systems.
In practice, some adjacent longwall panels are designed to exploit in turn. Therefore, a headgate in the previ-
ous panel should play the role of a tailgate in the next one. This issue leads to a high-stress distribution around
the tailgate roadway due to the superposition of abutment stresses resulted from the two adjacent panels. The
headgate is always located on the solid coal side of the reserve, where the next panel is located; so that it is not
influenced by the side abutment stresses generated by the previous mined-out panel. While the tailgate roadway
within a multiple extraction panel endures a wide range of loading conditions over its s ervices9. Abutment stresses
on the tailgate may cumulate from induced stresses due to exploitation in current and previous panels, and also
from coalface passing and goaf caving in the current panel. This issue causes a high-stress concentration in the
vicinity of the T-junction in the tailgate roadway.
The problem of tailgate instability is a common adversity in the Tabas longwall mine, Parvadeh coalfield,
South Khorasan province, Iran. As shown in Fig. 2, the Parvadeh coalfield is in a coal basin bounded by two
major north–south trending fault systems31. The mine is developed in the southern limb on the south side of the
Rostam fault, where the asymmetric Parvadeh anticline lies.
Due to the severe deformations of the rock strata along with tight folding and numerous faults in the zones
adjacent to the Rostam fault, major instabilities frequently occur in the vicinity of the northern boundary of the
mining area. Therefore, many mine downtimes are reported because of destructive failures taken place as results
of the unstable support systems in the tailgate roadway and its T-junction (Fig. 3).
Field observations show that the coal-bearing strata in the Tabas basin consists mainly of sediments of the
Upper Triassic-Middle Jurassic era namely the Nayband formation and Qadir member, about one kilometer in
thickness. The rocks are mostly mudstone, siltstone, sandstone, and limestone sequences. The main coal seams
are within a 50 m section of the central strata. The main seam thickness varies from 2.2 to 1.5 m, and the gradi-
ents vary from 1 in 2 to 1 in 931.
Scientific Reports | (2021) 11:2321 | https://doi.org/10.1038/s41598-021-82104-8 3
Vol.:(0123456789)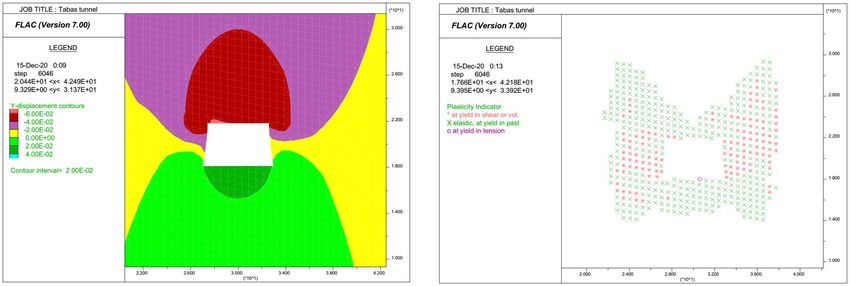
www.nature.com/scientificreports/
Figure 3. Severe roof displacement in the tailgate roadway at Tabas mine.
This research is conducted to optimize the support systems at the tailgate roadway and to indicate the most
effective parameters on the T-junction instabilities. The problem of unstable T-junctions especially in the vicinity
of the intersection of coalface and tailgate roadway, as a problematic disaster in Tabas longwall mine, is focused
to be analyzed using the finite-difference based RSM.
Theory
Response surface methodology. RSM is a commonly used mathematical method for optimiz-
ing the problems, which are affected by some variables in responses of experiments33. The primary objective
of RSM is optimization, finding the best set of factor levels to attain some goals in a multi-purpose strategy.
In other words, RSM combines the DOEs, optimization methods, and regression analyses to develop a suit-
able functional relationship between some independent variables and a response of interest ( y ) denoted by
xi ( y = f (x1 , x2 , x3 , . . . xn ) + e)34. The independent variables are also called factors, input variables or process
variables.
RSM was first presented in the 1950s as a sequential procedure applied to chemical processes design by Box
and Wilson35. Afterward, the RSM capability in solving complex problems causes to the reduction of experimental
runs and statistically acceptable results, which lead to efficaciously extensive applications of RSM in different
fields of engineering. In order to introduce the formulation of the RSM, it can mathematically be written as:
maxf (x) ≡ E(Y(x)) (1)
where Y is a set of random variables having two parameters; a mean as an unknown function of the q-dimensional
factor x , and a variance as an unknown constant value denoted by σ 2.
RSM matches a sequence of local regression models, which are fitted to experimental data based on the DOE.
The most common models are linear, two-factor interaction (2FI), quadratic, and cubic, which will respectively
be written as:
q
Y (x) = β0 + βi xi + ε Linear (2)
i=1
q q
Y (x) = β0 + βi xi + βij xi xj + ε 2FI (3)
i=1 i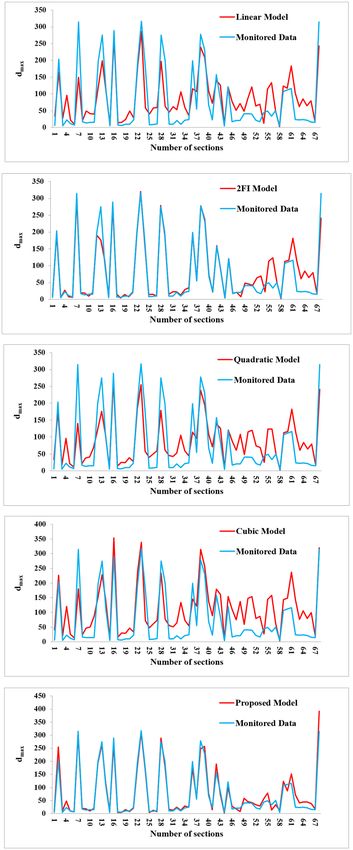
www.nature.com/scientificreports/
Figure 4. Schematic view of CCD for optimization of two and three variables.
Quality Coded value Actual value
Lowest −α xmin
Low −1 xmax +xmin
− xmax −xmin
2 2×2q/4
Centre 0 xmax +xmin
2
High +1 xmax +xmin
+ xmax −xmin
2 2×2q/4
Highest +α xmax
Table 1. Relationship between coded and actual values of a variable. Where xmin and xmax are respectively the
minimum and maximum values of x , and q is the number of variables.
based on the least-squares method in such a way that the sum of the squares of the errors, ε, is minimized.
For n
runs, ε is a normally distributed random n-vector with mean the zero vector and covariance matrix ε = σ 2 I .
In order to find a suitable approximation between the independent and dependent variables, the second-
order models are commonly used in RSM due to some advantages such as flexibility, variety of functional forms,
and using the least-squares method. In order to build the second-order models, the Central Composite Design
(CCD) was presented by Box and W ilson35 as a well-known experimental design.
Central composite design. CCD as a five-level RSM design, is a perfect solution for fitting a second-order
model to optimize the response variable of interest by selecting corner, axial, and center points35. Although there
are some varieties of CCD, the rotatable CCD is selected in our study as the experimental design method, which
maintains the rotatability of the variation and assists in retaining the accuracy of model fitting. In addition, rotat-
able designs lead to equal prediction variance at all points in regression models, given a fixed distance from the
center of the design (Fig. 4). The design procedure in CCD consists of three parts: (I) a fractional factorial design;
(II) experimental points at the distances ±α from their centers; and (III) a central point. Therefore, the whole
factors in CCD are coded in five levels of (−α, −1, 0, +1, +α) as presented in Table 1.
Transforming the input variables to coded variables, leads to being dimensionless with mean zero and the
same standard deviation. Therefore, in order to define the desired ranges of input variables, each factor is coded
to lie at 0 for the center points, at ±1 for the factorial points, and at ±α for the axial points. The axial points are
rotatability selected to keep the variance for all points equidistant from the center.
Finite difference method. The finite difference method (FDM) is one of the oldest numerical methods
used for solving differential equations, given initial and boundary conditions. FDM was already known by Euler
(1707–1783), and was later extended by Runge (1856–1927). The advent of FDM in numerical simulations began
in the early 1950s and its progress was stimulated by the emergence of computers that provided a convenient
framework for coping with complex engineering problems.
In the FDM, derivatives in several governing equations are directly substituted by an algebraic expression
such as stress or displacement at discrete points in space, which are undefined within elements. The theory
and background of FDM is summarized in the user manual of FLAC (Fast Lagrangian Analysis of Continua)
Scientific Reports | (2021) 11:2321 | https://doi.org/10.1038/s41598-021-82104-8 5
Vol.:(0123456789)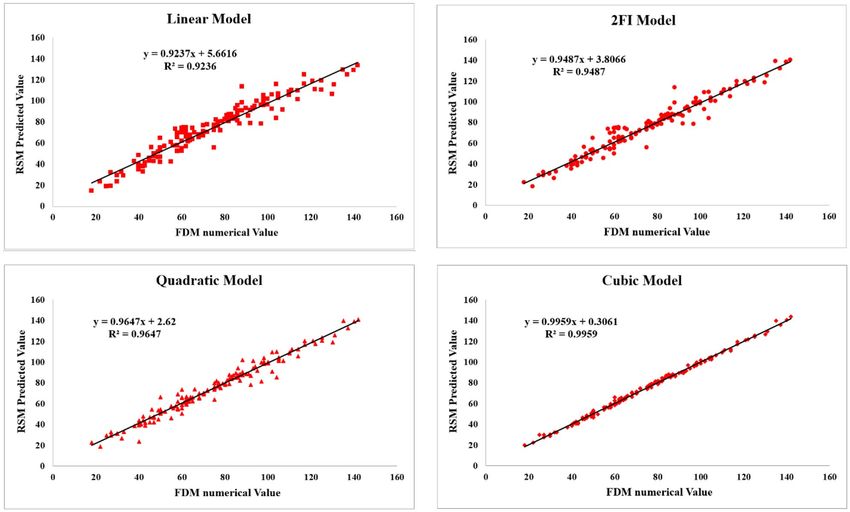
www.nature.com/scientificreports/
software36. In this research, the numerical modeling is executed by FLAC software, which is an explicit finite
difference program developed for solving complex mechanical problems in mining engineering and geotechnics.
Results and discussion
As mentioned, RSM searches the relationships between some independent variables and one or more response
variables in a sequence of designed experiments to attain an optimal response. RSM is employed in this research
together with FDM and statistical analyses to examine the roof strata stability in longwall tailgate, and conse-
quently to indicate the more sensitive parameters affecting the support systems instabilities in the tailgate road-
way. For this purpose, some geomechanical parameters affecting roof displacements in the tailgate roadway of
panel E2 at the Tabas longwall coal mine were selected. After screening and determining dominant parameters,
the ranges of maximum and minimum changes of the influencing factors on maximum roof displacements
(dmax ) are calculated. A DOE is then developed through considering a CCD on input variables which causes to
149 experiments. Thereafter, the dmax values for each experiment are estimated for the whole possible conditions
through some FDM numerical simulations in FLAC software. Finally, investigating various linear, 2FI, quadratic,
and cubic models, a quadratic equation is developed to predict the dmax in the tailgate roadway through statisti-
cal analyses. In addition, the dominant factors affecting the response variable (dmax ), and also the interaction
among input variables are determined by statistical techniques. The developed procedure is summarized in Fig. 5.
Determining dominant parameters. The first requirement for RSM is implementing a DOE framework
or factorial design to achieve a reliable and suitable measure for the response of interest. For this purpose, a
sequential procedure is followed to investigate more important factors influencing the response, and removing
the unimportant ones. A fractional factorial design based on the CCD is employed in our research to design the
experiments. The fractional factorial design is used to diminish the candidate variables, and consequently reduce
the number of simulations. This issue leads to more proficient of the subsequent experiments by determining
the dominant factors affecting the response variable. Since the number of design points required to fit a regres-
sion model enhances with the number of factors, screening out unimportant parameters can extensively reduce
experimental efforts and computational complexity of the model.
After implementing a fractional factorial design, the important independent variables to optimize the support
systems in panel E2 at Tabas longwall mine are obtained as density (ρ ), uniaxial compressive strength (UCS ),
cohesion (C ), angle of internal friction (φ ), slake durability index ( Id2), Young’s modulus ( E ), shear strength (τ ),
tensile strength (σt ), and rock mass rating ( RMR ). The input variables are collected from the rock mechanics
information resulted from the field and laboratory studies based on the boreholes and geological reports which
are gathered during mine development in the 1200 m long tailgate roadway.
Normalizing input parameters. The input parameters are generally called the natural variables, since
they are measured from the field or in the rock mechanics laboratory, and also they are expressed in the natu-
ral units of measurement. In RSM analysis, the natural variables are to be converted to the coded variables for
dimensionless based on the equations presented in Table 1. The input parameters and the coded/actual values
used in our research are summarized in Table 2.
Design of experiments. When coded and actual levels of natural variables are determined, the ranges
of maximum and minimum changes for influencing parameters at this mine are calculated. A DOE is then
developed through considering a CCD on independent variables, which results in 149 experiments. The rotat-
able CCD is implemented to design 149 runs with an appropriate combination for the factors ρ , UCS, E , C , φ ,
τ , σt , Id2, and RMR. Finally, a five-level nine-variable CCD is adopted in our research to describe the response
surfaces. The experiments are designed with Design Expert (DX7) software to choose and fit a suitable model to
the experimental results.
Numerical simulations. The 149 experiments resulted from the output of CCD, are introduced to FLAC
software in order to calculate the dmax in each experiment based on the FDM numerical analysis. Therefore, the
maximum crown displacement at the roof of each modeled tailgate is recorded as the response of the design.
Later, these results will be compared with the monitored roof displacements to investigate the validity of the
model.
In numerical modeling, much attention is paid to follow the real conditions of the tailgate roadway. There-
fore, the trapezoidal cross-section, inclined coal seam, and the arrangement of installed rockbolts are relatively
simplified and modeled similar to the real conditions.
The geometry of a numerical model simulated in FLAC software is presented in Fig. 6. The model size was
taken as 60 m in the x-direction, and 40 m in the y-direction. The model geometry was selected based on the
Saint Venant principle, which neglects the effects of excavation out of a domain with 3 to 5 times the roadway
width or radius. The roadway was set in the middle of the model, and a 27 m wide region at both sides of the
model was preserved to eliminate the boundary effects. By defining this geometry, the stress and displacement
distributions out of the model dimensions can be considered as being scarcely influenced by excavation.
The Mohr–Coulomb failure criterion was used as the constitutive model, and the initial and boundary condi-
tions were simplified and added to each FDM model based on the real conditions. The geometrical and geome-
chanical properties, which were used in FDM modeling are the height of overburden, density of rock strata,
Young’s modulus, Poisson’s ratio, cohesion, and angle of internal friction. A vertical stress in the range of 6.8 to
7.4 MPa, equivalent to the overburden weight, was applied to the upper boundary of the models. The horizontal
Scientific Reports | (2021) 11:2321 | https://doi.org/10.1038/s41598-021-82104-8 6
Vol:.(1234567890)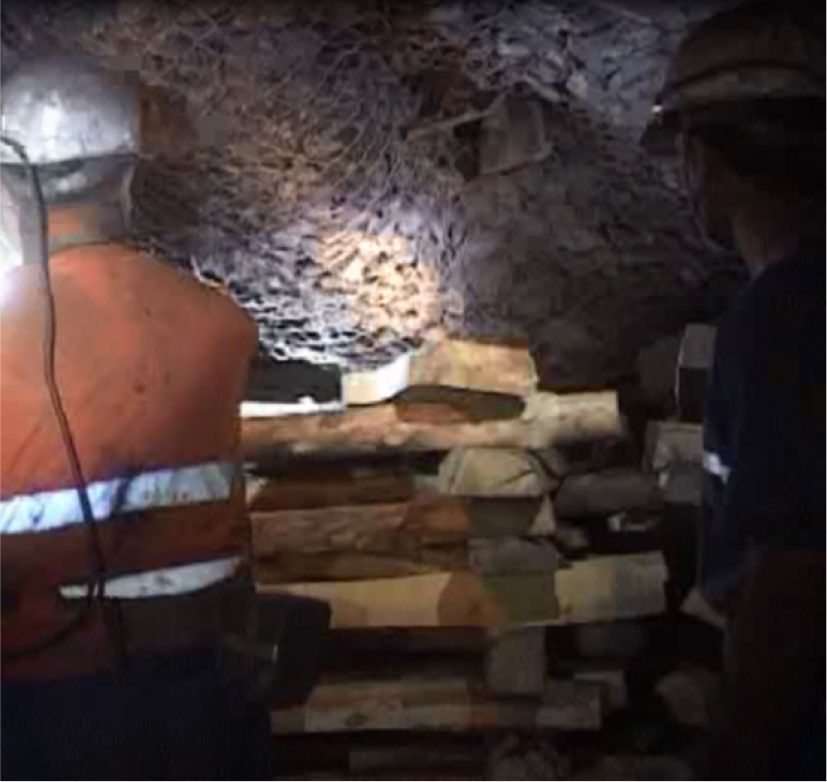
www.nature.com/scientificreports/

                                  Figure 5.  Steps of the proposed model for optimization of support systems in longwall tailgates.

                                  displacement of the lateral boundaries, and the vertical and horizontal displacements of the bottom boundary
                                  were fixed.
                                      There are several ways to make sure that equilibrium has been reached in numerical modeling. In our research,
                                  a quick check was made by plotting the changes in maximum unbalanced force during running the FDM models.
                                  A plot of maximum unbalanced force versus timestep for the 5th section is presented in Fig. 7, in which the maxi-
                                  mum unbalanced force before excavation of the roadway has been zoomed. As seen, the maximum unbalanced
                                  force in any stage of modeling is approaching zero, which indicates that an equilibrium state has been reached.
                                      In order to monitor the roof displacements during running the FDM model, the history of y-displacements
                                  at specified gridpoints are plotted versus timestep. The result of the FDM analysis for the selected section is pre-
                                  sented in Fig. 8, showing a dmax of 60 mm. The y-displacement contours and plasticity indicator resulted from
                                  analysis in this section are also presented in Fig. 9. Running each FDM model, the changes in the corresponding
                                  roof strata displacements are recorded. The results of the numerical analyses were verified based on the roof
                                  displacement recorded by dual-height telltales that were installed in the tailgate roadway. The procedure of
                                  numerical modeling was repeated in turn for the whole of 149 experiments.

Scientific Reports |   (2021) 11:2321 |                https://doi.org/10.1038/s41598-021-82104-8                                                   7

                                                                                                                                               Vol.:(0123456789)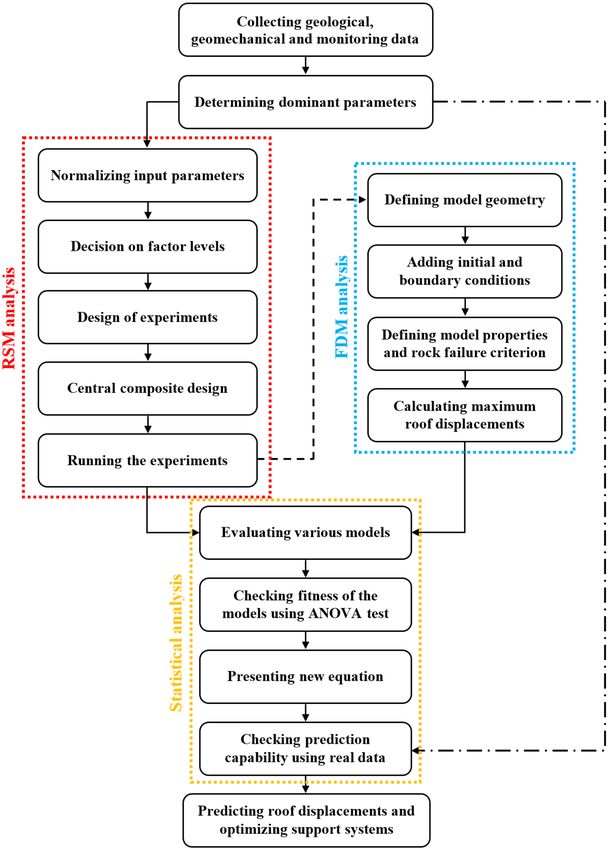
www.nature.com/scientificreports/

                                             Symbol   Unit    −α       −1       0           +1        +α
                                             ρ        g/cm3    1.600    1.887       2.175     2.462     2.750
                                            UCS       MPa      3.500   53.200   102.900     152.600   202.300
                                             E        GPa      0.340    2.992       5.645     8.297    10.950
                                             C        MPa      0.010    2.557       5.105     7.652    10.200
                                             φ        deg     17.800   23.125    28.450      33.775    39.100
                                             τ        MPa      2.000   12.400    22.800      33.200    43.600
                                             σt       MPa      0.200    4.850       9.500    14.150    18.800
                                             Id2      %       35.000   50.750    66.500      82.250    98.000
                                             RMR      –       15.000   34.000    53.000      72.000    91.000

                                            Table 2.  Coded and actual levels of input variables.

                                            Figure 6.  Geometry of the longwall tailgate modeled in FLAC software.

                                            Statistical analysis. Now a comprehensive data are gathered based on the natural geological and rock
                                            mechanical information, as well as the numerical modeling in such a way that could cover all the possible con-
                                            ditions of instabilities that occurred at Tabas longwall mine. Since the experiments are designed based on the
                                            ranges of maximum and minimum changes of natural parameters, the whole scenarios governing the tailgate
                                            instability at the mine will be considered. The part of CCD with the coded/actual values (input variables) and the
                                            results of numerical simulations (dmax ) are given in Table 3.

          Scientific Reports |   (2021) 11:2321 |                  https://doi.org/10.1038/s41598-021-82104-8                                               8

Vol:.(1234567890)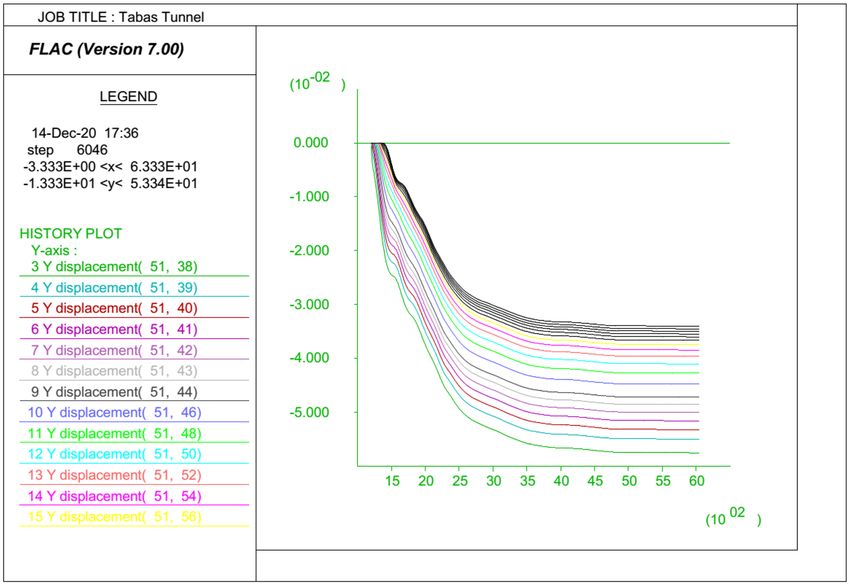
www.nature.com/scientificreports/

                                  Figure 7.  History of maximum unbalanced force for the selected section.

                                  Figure 8.  y-Displacement histories in specified gridpoints versus timestep for the selected section.

                                      In order to construct the linear, 2FI, quadratic, and cubic response surfaces of the dmax , the output of the RSM
                                  models are statistically analyzed based on the fractional factorial design. The RSM establishes a mathematical
                                  relation between the input geomechanical parameters and the dmax , which may be applied as a predictive model
                                  for estimating the stability behavior of the longwall tailgate without further complicated and time-consuming
                                  numerical simulations.
                                      The results of the coefficient of determination ( R2) for the linear, 2FI, quadratic and cubic models are respec-
                                  tively determined as 0.9236, 0.9487, 0.9647, and 0.9959, and are illustrated in the form of the FDM numerical
                                  values versus RSM predicted ones in Fig. 10.

Scientific Reports |   (2021) 11:2321 |                https://doi.org/10.1038/s41598-021-82104-8                                                    9

                                                                                                                                                Vol.:(0123456789)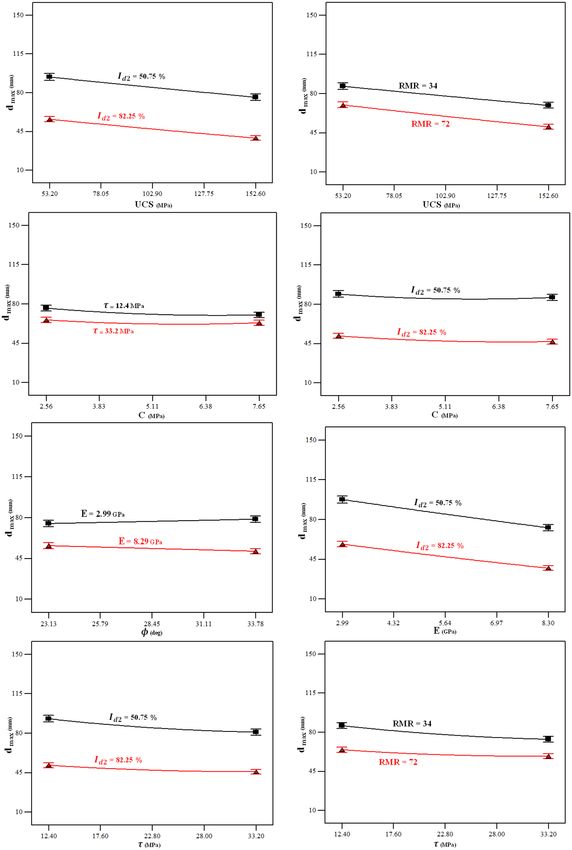
www.nature.com/scientificreports/

                                            Figure 9.  Plots of the y-displacement contours and plasticity indicator in the selected section.

                                                       Input variables                                                        Response
                                             Run no.   UCS      σt       C      φ       E      τ       ρ      Id2     RMR     dmax
                                             1         152.60   4.85     2.56   23.13   2.99   12.40   1.89   82.25   72.00   52
                                             2         152.60   4.85     7.65   33.78   8.30   12.40   2.46   50.75   72.00   68
                                             3         152.60   14.15    2.56   23.13   8.30   33.20   2.46   82.25   34.00   41
                                             –         –        –        –      –       –      –       –      –       –       –
                                             –         –        –        –      –       –      –       –      –       –       –
                                             149       102.90   9.50     0.01   28.45   5.64   22.80   2.17   66.50   53.00   97

                                            Table 3.  Part of CCD consisting of nine experimental factors and numerical results.

                                            Figure 10.  Comparison of the RSM and FDM values of dmax in linear, 2FI, quadratic and cubic models.

          Scientific Reports |   (2021) 11:2321 |                    https://doi.org/10.1038/s41598-021-82104-8                                    10

Vol:.(1234567890)
www.nature.com/scientificreports/
Figure 11. Comparison of the RSM and FDM values of dmax in the proposed model.
Response surface df MSE F-value p value Adeq precision PRESS R2 2
Radj 2
Rpre
Linear model 9 11,156.44 186.80 < 0.0001 59.292 9279.57 0.9236 0.9187 0.9146
2FI model 45 2291.73 42.29 < 0.0001 29.896 8068.99 0.9487 0.9262 0.9212
Quadratic model 54 1942.00 47.52 < 0.0001 31.483 13,121.37 0.9647 0.9444 0.8793
Cubic model 118 917.48 61.53 < 0.0001 35.932 87,370.04 0.9959 0.9797 0.1963
Proposed model 22 16.63 137.95 < 0.0001 52.011 30.01 0.9601 0.9532 0.9258
Table 4. Evaluation criteria for investigated and proposed regression models.
Proposed model. In order to optimize support systems in the tailgate roadway, the key variables affecting
roof displacements are at first identified. For this purpose, a set of adjustments are implemented on the resulted
equations of the linear, 2FI, quadratic, and cubic models to move the process toward the optimum conditions.
At the next step, the interactions between more important independent variables are recognized. In order to
investigate the effect of multiple input parameters, and their interactions on the dmax , the analysis of variance
(ANOVA) is also employed. Finally, the most effective parameters on dmax , and the pairwise interaction effects
between effective parameters are investigated and determined.
Analyzing different scenarios, a modified quadratic equation was obtained to predict the dmax by introduc-
ing the geomechanical parameters ρ , UCS , E , C , φ , τ , σt , Id2, and RMR . The selected independent variables are
of importance, and usually are to be available in designing almost all rock structures. Therefore, the developed
model can be employed in practice by using archive geomechanical information to gain a better understand-
ing of the roadway stability ahead of time. After running DOEs, the final proposed equation in terms of coded
factors is obtained as:
dmax = 8.04 − 1.17Id2 − 0.72E − 0.56UCS − 0.55RMR − 0.26τ − 0.14σt − 0.13C − 0.029φ + 0.027ρ
−0.13φE + 0.079τ RMR − 0.073UCSRMR − 0.065UCSId2 + 0.057τ Id2 − 0.051CId2 − 0.049EId2
2
+0.047Cτ + 0.24RMR2 + 0.15C 2 − 0.12ρ 2 + 0.11τ 2 + 0.099σt 2
(6)
The final proposed equation in terms of actual parameters is also obtained as:
dmax = 12.3920 − 0.0608Id2 + 0.0755E − 0.0017UCS − 0.0992RMR − 0.1239τ − 0.1181σt
−0.2399C + 0.0484φ + 6.6150ρ − 0.0095φE + 0.0004τ RMR − 0.00008UCSRMR
(7)
−0.00008UCSId2 + 0.0004τ Id2 − 0.0013CId2 − 0.0012EId2 + 0.0018Cτ + 0.0007RMR2
2
+0.0227C 2 − 1.4993ρ 2 + 0.0010τ 2 + 0.0046σt 2
Figure 11 illustrates the results of the RSM predicted dmax versus the FDM numerical values for the proposed
model. As seen, R2 is obtained 0.9601, which indicates a high goodness of fit. Due to the high level of accuracy,
Scientific Reports | (2021) 11:2321 | https://doi.org/10.1038/s41598-021-82104-8 11
Vol.:(0123456789)www.nature.com/scientificreports/
the proposed model is relatively reliable and may be useful in predicting roof displacements at tailgate roadway
of panel E2 ahead of time in Tabas longwall mine. It is also applicable to the other similar longwall mines after
validation and verification.
In Table 4, the model-fitting procedure is presented based on the regression output from DX7 software.
Evaluation criteria for four models of linear, 2FI, quadratic, and cubic are presented in this table together with
the evaluation criteria for our proposed model. The significance of each model is assessed based on the MSE,
F-value, p value, adequate precision, and PRESS tests, and also the coefficient of determination ( R2), the adjusted
coefficient of determination ( Radj
2 ), and the predicted coefficient of determination ( R2 ).
pre
The R , Radj , and Rpre can be calculated using the following equations. 37:
2 2 2
SSR SSE
R2 = =1− (8)
SST SST
SSE
(n−p)
2
Radj =1− SST (9)
(n−1)
2 PRESS
Rpre =1− (10)
SST
where, SST , SSE , and SSR are respectively the total sum of squares, the regression sum of squares, and the residual
sum of squares. The n and p are also the sample size and the number of independent variables. The prediction
capabilities of the investigated models are evaluated using the Rpre 2 , which is obtained based on the Predicted
38
Residual Error Sum of Squares (PRESS) v alue . The PRESS statistic is computed in the leave-one-out cross
validation process or jackknife technique, by adding the square of the residuals for the case that is left o ut39,40.
The idea in the leave-one-out cross validation is to fit the model without the i observation xi , and use this fit-
th
ted model to predict the response y(i) at xi . In other words, the regression model is fitted to the remaining n − 1
observations to predict the withheld observation yi , which is denoted by y(i). This procedure will be repeated
for all n observations, producing a set of n PRESS residuals,
and the PRESS statistic is computed as the sum of squares of the n PRESS residuals34,40:
n
n
2 2
PRESS = yi −
y(i) = e(i) (11)
i=1 i=1
where yi,
y(i), and e(i) are respectively the observed value, the estimated value, and the prediction error. The mean
sum of squares of error (MSE) is also obtained as:
n
2
yi −
y(i)
MSE = (12)
n−1
i=1
A comparison of the results shows that the p value of the five models is less than 0.05 which indicates a well-
developed procedure for the whole models. In addition, R2 is more than 0.9 in all five models. Based on the Radj2
values, it appears that Radj for the cubic model is more than the proposed model value. However, the Rpre proved
2 2
that the cubic model has been entangled in the overfitting phenomenon. Hence, Rpre 2 in our proposed model
in about 0.93, which shows a high level of accuracy for the prediction of dmax . Unlike the cubic and quadratic
models, in our proposed model the value of 0.9258 for Rpre 2 is in reasonable agreement with a value of 0.9532
for Radj . Examining the other statistical parameters such as MSE and PRESS, reveals the prediction proficiency
2
of the proposed model in relation to the others. In addition, the adequate precision factor, which measures the
signal to noise ratio is obtained 52.011 indicating an adequate and desirable ratio.
Sensitivity analysis. In order to indicate the most sensitive parameters influencing the dmax in the pro-
posed model, the influences of the whole input parameters ρ , UCS, E , C , φ , τ , σt , Id2, and RMR on the dmax are
investigated through conducting a sensitivity analysis. For this purpose, the ANOVA is implemented on the
results of the proposed model to evaluate the effect of each input parameter on the dmax , and also investigate
their pairwise interactions. The results of ANOVA consisting of the sum of squares, degree of freedom (df), MSE,
F-value, p value, and Variance Inflation Factor (VIF) are presented in Table 5.
According to the results of ANOVA, the p value of the proposed model is under 0.05, which means a high
accuracy for the prediction of dmax . The calculated F-value and p value for lack of fit are respectively 3.66 and
0.2388, which may imply that the proposed model is satisfactory, and the parameter of lack of fit is not significant
in relation to the pure error. Also, based on the resulted F-value, the parameters Id2, E , UCS, and RMR are the key
parameters influencing the dmax , while the parameters φ and ρ do not have a significant effect on the response
variable. Therefore, the parameters Id2, E , UCS, and RMR are the more sensitive factors, and the parameters φ and
ρ are the less ones. Amongst them, the Id2 appears to be the most effective input variable on the dmax , meaning
that by enhancement of the Id2, the dmax will sharply be decreased.
The other important parameter in the ANOVA table is VIF, which measures the upsurge of the variance in
comparison with an orthogonal basis. The VIF of the ith variable is defined as:
Scientific Reports | (2021) 11:2321 | https://doi.org/10.1038/s41598-021-82104-8 12
Vol:.(1234567890)www.nature.com/scientificreports/
Source Sum of squares df MSE F-value p value VIF Note
Model 365.91 22 16.63 137.95 < 0.0001 Significant
UCS 42.54 1 42.54 352.82 < 0.0001 1.00 Significant
σt 2.85 1 2.85 23.62 < 0.0001 1.00 Significant
C 2.35 1 2.35 19.52 < 0.0001 1.00
Significant
φ 0.11 1 0.11 0.93 0.3368 1.00
E 71.28 1 71.28 591.21 < 0.0001 1.00 Significant
τ 9.50 1 9.50 78.80 < 0.0001 1.00
Significant
ρ 0.097 1 0.097 0.81 0.3708 1.00
Id2 186.43 1 186.43 1546.27 < 0.0001 1.00 Significant
RMR 40.60 1 40.60 336.76 < 0.0001 1.00 Significant
UCS Id2 0.54 1 0.54 4.45 0.0369 1.00 Significant
UCS RMR 0.68 1 0.68 5.67 0.0188 1.00
Cτ 0.28 1 0.28 2.34 0.1285 1.00 Significant
C Id2 0.33 1 0.33 2.73 0.1007 1.00
φE 2.31 1 2.31 19.20 < 0.0001 1.00
E Id2 0.30 1 0.30 2.52 0.1150 1.00 Significant
τ Id2 0.42 1 0.42 3.49 0.0642 1.00
τ RMR 0.80 1 0.80 6.65 0.0111 1.00
Significant
σt2 0.34 1 0.34 2.81 0.0959 1.04
C2 0.75 1 0.75 6.24 0.0138 1.04
Significant
τ2 0.39 1 0.39 3.27 0.0730 1.04
ρ2 0.53 1 0.53 4.41 0.0378 1.04 Significant
RMR 2 1.93 1 1.93 16.00 0.0001 1.04
Significant
Residual 15.19 126 0.12
Lack of fit 15.12 124 0.12 3.66 0.2388
Pure error 0.067 2 0.033 Not significant
Cor total 381.10 148
Table 5. Results of ANOVA for the proposed model.
1
VIF i = (13)
1 − Ri2
where Ri2 is the R2 value obtained by regressing the ith predictor on the remaining predictors.
In general, to develop a model with a high goodness of fit, the VIF of all input variables should be less than five
to prevent dilemmas with the stability of the coefficients. When the VIF is obtained more than five, it is possible
to present a severe multicollinearity. Therefore, the variables with the high values of VIF are not suitable and
should be removed from the model. As shown in Table 5, the VIF is calculated for all independent variables, and
the resulted VIF values are in the range of 1, showing a supreme situation for the proposed model.
The influences of the whole nine input parameters on the dmax are depicted in Fig. 12 to provide a perception
for comparison of the effect of each parameter on the dmax . As seen, the most sensitive parameters are Id2, E ,
UCS, and RMR meaning that the dmax will be decreased when these parameters increase. Also, this figure reveals
that the parameters φ and ρ do not have a significant influence on the dmax.
In addition, the ANOVA results show that there are meaningful pairwise interaction effects between UCS
and Id2, UCS and RMR , C and τ , C and Id2, φ and E , E and Id2, τ and Id2, and τ and RMR . Figure 13 illustrates the
pairwise interactions between these input variables, and their effect on the dmax.
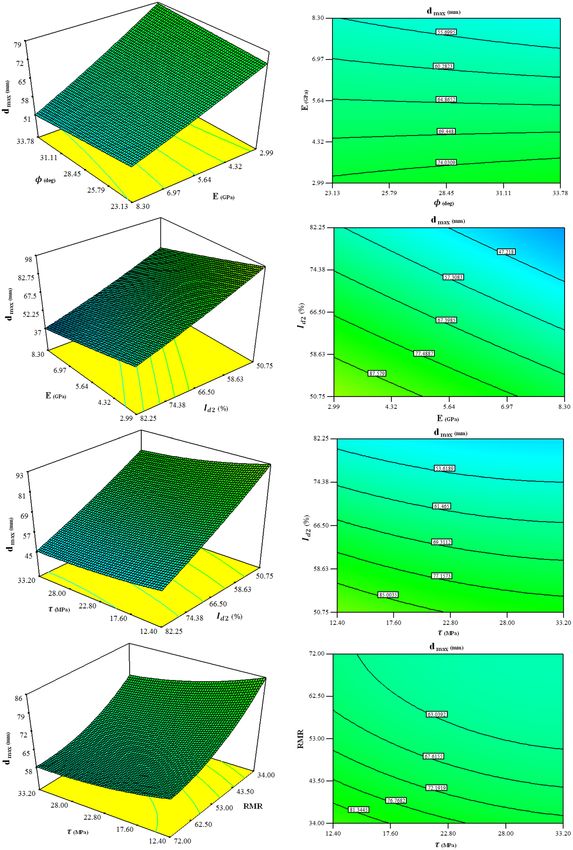
In order to further recognize the interactions between input parameters and their effect on the dmax , the 3D
response surface plots, and contour plots are also drawn in Fig. 14 based on the coefficients of the proposed
model, and the ANOVA results.
Prediction capability of the proposed model. Since the R2 and Radj
2 indicators are unable to provide
enough information for the prediction capability of the model, the Rpre 2 is used in our research which could
prosperously detect the overfitting phenomenon in the cubic model. Moreover, the prediction capabilities of the
models are examined by testing all models using unseen actual data that were monitored at the mine. Hence, in
order to evaluate the validity of the investigated models, the results are compared with the real values of dmax.
The real values of dmax were obtained by monitoring the behavior of the tailgate roadway using dual-height
telltales. The dmax monitored in 68 sections are introduced to the proposed model, and the results are compared
with the linear, 2FI, quadratic, and cubic models. The R2 for four models of the linear, 2FI, quadratic, and cubic
are respectively obtained as 0.68, 0.85, 0.63, and 0.46, which are presented in Fig. 15. The calculated R2 for the
Scientific Reports | (2021) 11:2321 | https://doi.org/10.1038/s41598-021-82104-8 13
Vol.:(0123456789)www.nature.com/scientificreports/
Figure 12. Influences of the input variables on the dmax.
proposed model is also obtained as 0.90 as shown in Fig. 16. As it can be seen, the coefficient of determination
for the proposed model is of priority in relation to the other ones.
The results of the calculated dmax obtained by the linear, 2FI, quadratic, cubic, and the proposed models
are compared with the real dmax measured from the roof displacement monitoring program at the mine. These
results are compared with the real monitored data in 68 sections in Fig. 17, showing the priority and prediction
capability of the proposed model when encountering with unseen data.
Support system optimization in longwall roadways is more important than ever due to reducing the mining
costs, and ensuring the safety of the mine’s personnel. There are currently no methods that logically provide
mine engineers with reliable arranges of support systems in longwall gate roadways especially in the tailgate
roadway. The reliance on experience or at worst trial and error for support systems designing in longwall coal
mining is a major contributing factor responsible for mine downtime and potential calamitous c onsequences9,41.
Due to the fact that the ground reaction behavior is a function of support load density and stiffness of the
support system42, measuring roof displacements is a practical and rational measure to indicate the unstable zones,
and control the potential instabilities through support system optimization.
The proposed model is an approach to optimize support systems and also to indicate the most affecting factor
on the roof displacement as well as to investigate the interaction between independent variables. Nonetheless, a
suitable DOE is to be achieved for rational optimization of support systems installed at the mine. The proposed
model may be useful to avoid the difficulties associated with trial and error or the complexity of further time-
consuming numerical simulations.
Therefore, based on the dmax value obtained by the proposed model, the support systems will be optimized
for controlling the deformation to a predetermined level. Accordingly, a margin of safety is provided, which
reduces the risk of roof failure without necessity to excessive roof support.
Employing the finite-difference based RSM, it is possible to develop a suitable experimental design, which
integrates the dominant independent variables and to present a reliable equation to estimate the response value
based on a well-designed regression analysis. The results of the proposed model can be graphically represented as
3D response surface plots and contour plots, which can be assisted to describe the effects of the natural variables
on the response, and also provide information for pairwise interaction effects of variables.
Since wrong appraisal of the capacity and locality of the designed support systems in tailgate roadway may
result in excessive roof displacements, and consequently roof failures which are accompanied by irrecoverable
disasters in longwall mining2,11, designing a suitable support system in longwall tailgates is one of the major tasks
Scientific Reports | (2021) 11:2321 | https://doi.org/10.1038/s41598-021-82104-8 14
Vol:.(1234567890)www.nature.com/scientificreports/
Figure 13. Pairwise interaction effects of input variables on the dmax.
Scientific Reports | (2021) 11:2321 | https://doi.org/10.1038/s41598-021-82104-8 15
Vol.:(0123456789)www.nature.com/scientificreports/
Figure 14. 3D response surface plots showing interaction effects of variables on the dmax.
Scientific Reports | (2021) 11:2321 | https://doi.org/10.1038/s41598-021-82104-8 16
Vol:.(1234567890)www.nature.com/scientificreports/
Figure 14. (continued)
Scientific Reports | (2021) 11:2321 | https://doi.org/10.1038/s41598-021-82104-8 17
Vol.:(0123456789)www.nature.com/scientificreports/
Figure 15. R2 derived from testing on unseen actual data for linear, 2FI, quadratic and cubic models.
in the mine design procedure. Therefore, employing the proposed model may assist engineers to ensure that the
tailgate roadway is functional. Based on the results obtained from the proposed model, it is possible to install a
set of standing support systems ahead of time to control the immediate roof in the vicinity of the unstable zones
having high displacements. Also, it is feasible to determine the more sensitive geomechanical parameters, and
to indicate the pairwise interaction effects of the geomechanical parameters on the roof displacements. Then,
the support systems will be redesigned to be optimized based on the geological and geomechanical information
to provide a safe and secure working face at underground.
According to our findings at the panel E2 of Tabas mine, the slake durability index, Young’s modulus, uniaxial
compressive strength, and rock mass rating are respectively found to be more sensitive parameters that have
dominant effects on the roof displacements in the tailgate roadway. Also, the Id2 appears to be the most effective
parameters on the dmax in our case study, which emphasizes on the disintegration characteristics of the weak and
clay-bearing rock strata at the mine. Hence, one of the findings of this research is to underscore the measurement
of the weathering resistance of roof rocks at Tabas mine, which are mainly siltstones, mudstones, argillites, and
other clay-bearing rocks. In addition, the dmax will be decreased provided that the Id2 enhances through reducing
the standup time of exposed roof span and avoiding weathering.
Scientific Reports | (2021) 11:2321 | https://doi.org/10.1038/s41598-021-82104-8 18
Vol:.(1234567890)www.nature.com/scientificreports/
Figure 16. R2 derived from testing the proposed model by unseen actual data.
Conclusions
Problematic tailgate instabilities in Parvadeh coalfield are recognized as a serious concern which may cause to
consequences varying from production delays to potentially injuries or fatalities and catastrophic failures with
loss of the mine. The tailgate roadway serves two roles in the adjacent longwall panels; firstly as a headgate for
the previous panel, and secondly as a tailgate for the current panel. Therefore, the tailgate roadway in a longwall
panel endures a high-stress concentration. This research was conducted in the panel E2 at Tabas mine to predict
the unstable zones in the tailgate roadway, and consequently optimize the support systems’ density. A finite-
difference based RSM was employed to develop a new applicable equation for predicting roof strata displacement
in the tailgate roadway, and also optimizing the support systems’ designing process at Tabas mine. A five-level
nine-variable CCD was adopted to design 149 runs with an appropriate combination of the independent vari-
ables of ρ , UCS , E , C , φ , τ , σt , Id2 , and RMR . Thereafter, the dmax for each experiment was estimated for the
whole possible conditions through some FDM numerical simulations in FLAC software. Investigating various
linear, 2FI, quadratic, and cubic models, a modified quadratic equation is developed to predict the dmax through
statistical analyses. The validity of the proposed model is fulfilled by calculating the Radj2 , R2 , MSE, and PRESS
pre
between the models’ outputs and the actual roof displacements. While R2 for four models of the linear, 2FI,
quadratic, and cubic are respectively obtained as 0.68, 0.85, 0.63, and 0.46, the proposed model appears to give
a high goodness of fit with an accuracy of 0.90, which reveals the prediction proficiency of the proposed model
in relation to the others. Unlike the cubic and quadratic models, in our proposed model the value of 0.9258 for
2 is in reasonable agreement with a value of 0.9532 for R2 , and avoids overfitting. Therefore, the proposed
Rpre adj
model may be applied as a reliable tool to estimate the roof displacement in the longwall tailgate without further
complicated and time-consuming numerical simulations. ANOVA is implemented on the results of the proposed
model to investigate the effect of each input parameter on the dmax , and also investigate their pairwise interac-
tions. The calculated F-value and p value for lack of fit are respectively 3.66 and 0.2388, which may imply that
the proposed model is satisfactory, and the lack of fit is not significant in relation to the pure error. The resulted
VIF values are also in the range of unity, showing a supreme situation for the proposed model. In addition, the
parameters Id2, E , UCS , and RMR are the key parameters influencing the dmax , while the parameters φ and ρ do
not have a significant effect on the response variable. Furthermore, there are meaningful pairwise interaction
effects between UCS and Id2, UCS and RMR , C and τ , C and Id2, φ and E , E and Id2, τ and Id2, and τ and RMR .
Amongst them, the Id2 appears to be the most effective input variable on the dmax , showing the role of the weak
and clay-bearing rock strata on the tailgate’s stability. In addition, the dmax will be decreased provided that the
Id2 enhances through reducing the standup time of exposed roof span and avoiding weathering.
Scientific Reports | (2021) 11:2321 | https://doi.org/10.1038/s41598-021-82104-8 19
Vol.:(0123456789)www.nature.com/scientificreports/
Figure 17. Comparing the results of all models with the real monitored data in 68 sections.
Scientific Reports | (2021) 11:2321 | https://doi.org/10.1038/s41598-021-82104-8 20
Vol:.(1234567890)www.nature.com/scientificreports/
Received: 17 October 2020; Accepted: 15 January 2021
References
1. Hartman, H. L. & Mutmansky, J. M. Introductory Mining Engineering. (2002).
2. Mahdevari, S., Shahriar, K. & Esfahanipour, A. Human health and safety risks management in underground coal mines using fuzzy
TOPSIS. Sci. Total Environ. 488–489, 85–99 (2014).
3. Zhu, H. et al. Study of the dynamic development law of overburden breakage on mining faces. Sci. Rep. 10, 1–15 (2020).
4. Gao, F., Kang, H. & Yang, L. Experimental and numerical investigations on the failure processes and mechanisms of composite
coal–rock specimens. Sci. Rep. 10, 1–13 (2020).
5. Zhu, S., Feng, Y., Jiang, F. & Liu, J. Mechanism and risk assessment of overall-instability-induced rockbursts in deep island longwall
panels. Int. J. Rock Mech. Min. Sci. 106, 342–349 (2018).
6. Barczak, T. M., Esterhuizen, G. S., Ellenberger, J. L. & Zhang, P. A first step in developing standing roof support design criteria
based on ground reaction data for Pittsburgh seam longwall tailgate support. In Proceedings of the 27th International Conference
on Ground Control In Mining, 347–357 (2008).
7. Singh, S. P. Ground control aspects of longwall design. Dev. Geotech. Eng. 32, 123–128 (1981).
8. Seedsman, R. The stress and failure paths followed by coal mine roofs during longwall extraction and implications to tailgate
support. In: 20th International Conference on Ground Control in Mining, Morgantown, 42–49 (2001).
9. Tarrant, G. Tailgate support design—an empirical and analytical approach. i—n Coal Operators’ Conference (ed. Aziz, N.) 42–49
(University of Wollongong & the Australasian Institute of Mining and Metallurgy, 2003).
10. Kang, H. P., Lin, J. & Fan, M. J. Investigation on support pattern of a coal mine roadway within soft rocks—a case study. Int. J. Coal
Geol. 140, 31–40 (2015).
11. Bai, Q. S. & Tu, S. H. Failure analysis of a large span longwall drift under water-rich roofs and its control techniques. Eng. Fail.
Anal. 67, 15–32 (2016).
12. Mangal, A. & Paul, P. S. Rock mechanical investigation of strata loading characteristics to assess caving and requirement of support
resistance in a mechanized powered support longwall face. Int. J. Min. Sci. Technol. 26, 1081–1087 (2016).
13. Kang, H., Lou, J., Gao, F., Yang, J. & Li, J. A physical and numerical investigation of sudden massive roof collapse during longwall
coal retreat mining. Int. J. Coal Geol. 188, 25–36 (2018).
14. Basarir, H., Sun, Y. & Li, G. Gateway stability analysis by global-local modeling approach. Int. J. Rock Mech. Min. Sci. 113, 31–40
(2019).
15. Kang, H., Wu, L., Gao, F., Lv, H. & Li, J. Field study on the load transfer mechanics associated with longwall coal retreat mining.
Int. J. Rock Mech. Min. Sci. 124, 104141 (2019).
16. Esterhuizen, G. S., Gearhart, D. F., Klemetti, T., Dougherty, H. & van Dyke, M. Analysis of gateroad stability at two longwall mines
based on field monitoring results and numerical model analysis. Int. J. Min. Sci. Technol. 29, 35–43 (2019).
17. Darvishi, A., Ataei, M. & Rafiee, R. Investigating the effect of simultaneous extraction of two longwall panels on a maingate gateroad
stability using numerical modeling. Int. J. Rock Mech. Min. Sci. 126, 104172 (2020).
18. Rajwa, S., Janoszek, T. & Prusek, S. Model tests of the effect of active roof support on the working stability of a longwall. Comput.
Geotech. 118, 103302 (2020).
19. Fereshteh-Saniee, F., Fakhar, N. & Karimi, M. Experimental, analytical, and numerical studies on the forward extrusion process.
Mater. Manuf. Process. 28, 265–270 (2013).
20. Mollon, G., Dias, D. & Soubra, A.-H. Probabilistic analysis of circular tunnels in homogeneous soil using response surface meth-
odology. J. Geotech. Geoenviron. Eng. 135, 1314–1325 (2009).
21. Lü, Q., Sun, H. Y. & Low, B. K. Reliability analysis of ground-support interaction in circular tunnels using the response surface
method. Int. J. Rock Mech. Min. Sci. 48, 1329–1343 (2011).
22. Shamekhi, E. & Tannant, D. D. Probabilistic assessment of rock slope stability using response surfaces determined from finite
element models of geometric realizations. Comput. Geotech. 69, 70–81 (2015).
23. Park, D. & Park, E. S. Inverse parameter fitting of tunnels using a response surface approach. Int. J. Rock Mech. Min. Sci. 77, 11–18
(2015).
24. Raina, A. K. & Murthy, V. M. S. R. Prediction of flyrock distance in open pit blasting using surface response analysis. Geotech.
Geol. Eng. 34, 15–28 (2016).
25. Abdallah, M. & Verdel, T. Behavior of a masonry wall subjected to mining subsidence, as analyzed by experimental designs and
response surfaces. Int. J. Rock Mech. Min. Sci. 100, 199–206 (2017).
26. Hamrouni, A., Dias, D. & Sbartai, B. Reliability analysis of shallow tunnels using the response surface methodology. Undergr. Sp.
2, 246–258 (2017).
27. Rastbood, A., Yaghoob, G. & Majdi, A. Finite element based response surface methodology to optimize segmental tunnel lining.
Eng. Technol. Appl. Sci. Res. 7, 1504–1514 (2017).
28. Özfirat, K. M., Malli, T., Özfirat, P. M. & Kahraman, B. The performance prediction of roadheaders with response surface analysis
for underground metal mine. Kuwait J. Sci. 44, 112–120 (2017).
29. Park, D. & Park, E. S. Application of response surface methodology to geotechnical parameter estimation in tunneling. In 51st US
Rock Mechanics/Geomechanics Symposium 2017 1, 127–133 (American Rock Mechanics Association, 2017).
30. Heidarzadeh, S., Saeidi, A. & Rouleau, A. Assessing the effect of open stope geometry on rock mass brittle damage using a response
surface methodology. Int. J. Rock Mech. Min. Sci. 106, 60–73 (2018).
31. IRITEC. Tabas Coal Mine Project, Detailed Design Report Vol 1, Underground Mine Revision B. Iran International Engineering
Company (IRITEC) (2003).
32. GoogleEarth. Parvadeh Coal mines, Tabas. 33° 00′ 36.37″ N, 56° 49′ 30.15″ E, elev 2746 ft. (2020). http://www.earth.google.com.
33. Hinkelmann, K. Design and Analysis of Experiments. Design and Analysis of Experiments Vol. 3 (Wiley, Hoboken, 2012).
34. Myers, W. Response Surface Methodology. Encyclopedia of Biopharmaceutical Statistics, 3rd Edition. (Wiley, Hoboken, 2012). https
://doi.org/10.1201/b14674-189.
35. Box, G. E. P. & Wilson, K. B. On the experimental attainment of optimum conditions. J. R. Stat. Soc. Ser. B 13, 1–38 (1951).
36. FLAC. Fast Lagrangian Analysis of Continua. Itasca Consulting Group, Inc. Ver. 8.0. Minneapolis: Itasca (2016).
37. Rawlings, J. O., Pantula, S. G. & Dickey, D. A. Applied Regression Analysis: A Research Tool (Springer, New York, 2001).
38. Allen, D. M. The relationship between variable selection and data agumentation and a method for prediction. Technometrics 16,
125–127 (1974).
39. Craven, P. & Wahba, G. Smoothing noisy data with spline functions—estimating the correct degree of smoothing by the method
of generalized cross-validation. Numer. Math. 31, 377–403 (1978).
40. Tarpey, T. A note on the prediction sum of squares statistic for restricted least squares. Am. Stat. 54, 116 (2000).
41. Zhao, D. & Wu, Q. An approach to predict the height of fractured water-conducting zone of coal roof strata using random forest
regression. Sci. Rep. 8, 10986 (2018).
42. Barczak, T. M., Mucho, T. P. & Dolinar, D. R. Design methodology for standing secondary roof support in longwall tailgates. In
New Technology For Coal Mine Roof Support (2000).
Scientific Reports | (2021) 11:2321 | https://doi.org/10.1038/s41598-021-82104-8 21
Vol.:(0123456789)You can also read