Constructing a precipitable water vapor map from regional GNSS network observations without collocated meteorological data for weather forecasting ...
←
→
Page content transcription
If your browser does not render page correctly, please read the page content below
Atmos. Meas. Tech., 11, 5153–5166, 2018
https://doi.org/10.5194/amt-11-5153-2018
© Author(s) 2018. This work is distributed under
the Creative Commons Attribution 4.0 License.

Constructing a precipitable water vapor map from regional
GNSS network observations without collocated
meteorological data for weather forecasting
Biyan Chen1,2,3 , Wujiao Dai1,2,3 , Zhizhao Liu4 , Lixin Wu1,3 , Cuilin Kuang1,2,3 , and Minsi Ao5
1 Schoolof Geosciences and Info-Physics, Central South University, Changsha, Hunan, China
2 Key Laboratory of Precise Engineering Surveying and Deformation Disaster Monitoring of Hunan Province,
Changsha, Hunan, China
3 Key Laboratory of Metallogenic Prediction of Nonferrous Metals and Geological Environment Monitoring Ministry

of Education, School of Geosciences and Info-Physics, Central South University, Changsha, Hunan, China
4 Department of Land Surveying and Geo-Informatics, Hong Kong Polytechnic University, Hong Kong, China
5 Hunan Province Mapping and Science and Technology Investigation Institute, Changsha, Hunan, China

Correspondence: Biyan Chen (yeary124@csu.edu.cn)

Received: 17 March 2018 – Discussion started: 2 May 2018
Revised: 21 August 2018 – Accepted: 22 August 2018 – Published: 11 September 2018

Abstract. Surface pressure (Ps ) and weighted mean temper-        (2) the constructed PWV maps have good agreements with
ature (Tm ) are two necessary variables for the accurate re-      radiosonde and ERA-Interim reanalysis data with the over-
trieval of precipitable water vapor (PWV) from Global Navi-       all accuracy being better than 3 mm; and (3) PWV maps can
gation Satellite System (GNSS) zenith total delay (ZTD) es-       well reveal the moisture advection, transportation and con-
timates. The lack of Ps or Tm information is a concern for        vergence during heavy rainfall.
those GNSS sites that are not collocated with meteorological
sensors. This paper investigates an alternative method of in-
ferring accurate Ps and Tm at the GNSS station using nearby
synoptic observations. Ps and Tm obtained at the nearby syn-      1   Introduction
optic sites are interpolated onto the location of the GNSS sta-
tion by performing both vertical and horizontal adjustments,      Water vapor is an important meteorological parameter, which
in which the parameters involved in Ps and Tm calculation are     plays a crucial role in the formation of various weather phe-
estimated from ERA-Interim reanalysis profiles. In addition,      nomena such as cloud, rain and snow (Ahrens and Samson,
we present a method of constructing high-quality PWV maps         2011). Water vapor accounts for only 0.1 %–3 % of the to-
through vertical reduction and horizontal interpolation of the    tal atmosphere mass; however, due to the latent heat release,
retrieved GNSS PWVs. To evaluate the performances of the          a small amount of water vapor may cause severe weather
Ps and Tm retrieval, and the PWV map construction, GNSS           changes (Mohanakumar, 2008). The monitoring of atmo-
data collected from 58 stations of the Hunan GNSS network         spheric water vapor variation is thus of significant value for
and synoptic observations from 20 nearby sites in 2015 were       short-term severe weather forecasting (Brenot et al., 2013;
processed to extract the PWV so as to subsequently gener-         Labbouz et al., 2013; Van Baelen et al., 2011; Zhang et al.,
ate the PWV maps. The retrieved Ps and Tm and constructed         2015). Among the various atmosphere sensing techniques,
PWV maps were assessed by the results derived from ra-            the Global Navigation Satellite System (GNSS) is regarded
diosonde and the ERA-Interim reanalysis. The results show         as a uniquely powerful means to estimate the water vapor
that (1) accuracies of Ps and Tm derived by synoptic inter-       with advantages of all-weather capability, high accuracy and
polation are within the range of 1.7–3.0 hPa and 2.5–3.0 K,       low operating expenses (Bevis et al., 1992; Guerova et al.,
respectively, which are much better than the GPT2w model;         2016; Yao et al., 2017).

Published by Copernicus Publications on behalf of the European Geosciences Union.
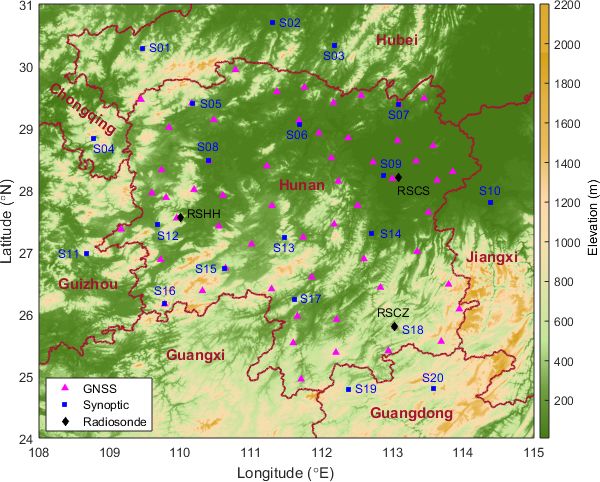
5154                                                          B. Chen et al.: Constructing PWV map regional GNSS network

   While GNSS signals are transmitted from satellites to            ever, most blind models (e.g., global pressure and tempera-
ground receivers, they are delayed by the terrestrial tropo-        ture 2 wet, GPT2w; Boehm et al., 2015) are developed at a
sphere. In GNSS data processing, the tropospheric delay is          global scale and are not likely to capture regional small-scale
usually expressed as the zenith total delay (ZTD) multiplied        variations. More accurate Ps and Tm could be achieved by in-
by a mapping function, and sometimes plus horizontal gra-           terpolation from nearby meteorological observations if they
dients for a better GNSS positioning performance (Lu et al.,        can be accessed simultaneously. In this study, we investigate
2016). The accuracy of the GNSS ZTD estimates depends               the construction of PWV maps from GNSS observations over
on the data processing strategies and on the global prod-           the Hunan Province by performing the following five tasks:
ucts used in the processing. At present, ZTDs are likely to         (1) Tm –Ts relationship and vertical reduction models for Ps
be determined with accuracies up to several millimeters by          and Tm are developed for each synoptic station; (2) Ps and Tm
a wide range of GNSS processing software (Pacione et al.,           data interpolated by nearby meteorological observations are
2017; Yuan et al., 2014). ZTD is normally divided into two          compared with those derived from radiosonde and GPT2w
parts: the zenith hydrostatic delay (ZHD) which is caused           models; (3) a PWV vertical reduction model is developed for
by the dry gases of the troposphere and the zenith wet de-          each GNSS station; (4) a PWV interpolation is performed
lay (ZWD) which stems from the water vapor. The ZHD can             over the whole Hunan region and evaluated by radiosonde
be accurately calculated using empirical models with surface        and European Centre for Medium-Range Weather Forecasts
pressure (Ps ) measured by meteorological sensors (Saasta-          (ECMWF) ERA-Interim reanalysis (hereafter abbreviated as
moinen, 1972). ZWD is readily obtained with the subtraction         ERA-I); and (5) the water vapor variation during a heavy rain
of ZHD from ZTD. The precipitable water vapor (PWV) can             event that occurred over a wide range of Hunan is examined
then be retrieved from ZWD with a conversion factor which           based on PWV maps.
is a function of the weighted mean temperature (Tm ). Tm can           This paper is organized as follows. Section 2 presents the
be calculated by numerical integration from the vertical pro-       study area and the datasets used in the study. Section 3 de-
files of atmospheric temperature and humidity (Davis et al.,        scribes the methodology to retrieve PWV from GNSS data.
1985). PWV is a key parameter in studying water vapor vari-         The strategy for meteorological data interpolation, Tm mod-
ations during severe weather phenomena, since it can reflect        eling and PWV interpolation is also presented in this section.
the inflow and outflow of water vapor in a vertical air column      The assessment of Ps and Tm interpolated by nearby synop-
above a certain area (Yao et al., 2017).                            tic observations is described in Sect. 4. The PWV maps con-
   As stated above, the retrieval of PWV from GNSS ZTD              structed by GNSS data and PWV evolution during a heavy
needs two key meteorological parameters: Ps and Tm . The            rain event are also presented in Sect. 4. The summary and
first choice is to measure the Ps by a barometer collocated         conclusions are given in Sect. 5.
at the GNSS station. However, a large number of GNSS
stations have been deployed for positioning purposes and
are not equipped with collocated meteorological sensors. In         2     Study area and data description
this case, one may use pressure derived from a global atmo-
spheric reanalysis (Dee et al., 2011; Zhang et al., 2017), inter-   The Hunan Province is located in the middle reaches of
polated from nearby meteorological observations (Alshawaf           the Yangtze watershed in South Central China, with a terri-
et al., 2015; Musa et al., 2011; Wang et al., 2007) or pre-         tory of about 211 800 km2 . Hunan enjoys a subtropical hu-
dicted by a blind model (Boehm et al., 2015; Wang et al.,           mid monsoon climate bearing obvious continental climate
2017). For Tm , since the temperature and humidity profiles         features. The average annual rainfall varies between 1200
are very difficult to obtain, particularly in a near-real-time      and 1700 mm, with 50 %–60 % concentrating in the months
mode, Tm has to be calculated from a model. An empirical            from April to August. Heavy showers and thunderstorms fre-
Tm model dependent on surface temperature (Ts ) (Bevis et           quently occur in summer, causing catastrophic conditions as
al., 1994; Li et al., 2018) or a blind model developed from         well as significant damages to urban infrastructure and agri-
atmospheric reanalysis products (Boehm et al., 2015; Yao et         cultural production. The monitoring of water vapor variations
al., 2013; Zhang et al., 2017) is often employed.                   using the GNSS network has a great potential to improve the
   The work presented in this paper is carried out for con-         capacity of extreme weather forecasting in the Hunan region.
structing high-quality PWV maps by a regional GNSS net-
work in the Hunan Province, China, for precipitation fore-          2.1    GNSS, synoptic and radiosonde stations in Hunan
casts and analysis. The constructed high-quality PWV maps
will also be of significant value for monitoring and early          In 2015, 58 GNSS stations were deployed in the Hunan
warning of geological disasters, such as landslides and debris      GNSS network and new stations have subsequently been
flows. In such a near-real-time application, the use of reanal-     added (see Fig. 1). At present, the GNSS network consists
ysis products is not feasible. Ps and Tm have to be determined      of more than 90 stations and the number is still increasing
only using a blind model or nearby surface synoptic stations.       (Li et al., 2017). Most of the GNSS stations are equipped
The use of blind models is a very convenient means; how-            with Trimble or Leica receivers and have a typical sampling

Atmos. Meas. Tech., 11, 5153–5166, 2018                                               www.atmos-meas-tech.net/11/5153/2018/
B. Chen et al.: Constructing PWV map regional GNSS network                                                                      5155

Figure 1. Geographic distribution of GNSS, synoptic and radiosonde stations in Hunan and surrounding provinces.

interval of 30 s. In this study, the ZTDs are estimated us-           ds336.0/, last access: March 2018). For real-time applica-
ing a GNSS precise point positioning (PPP) technique with             tions, pressure and temperature data at a given epoch are ex-
the Bernese 5.2 software (Dach et al., 2015). To examine              trapolated from empirical models established using the past
their performance in real-time applications, IGS (Interna-            20-day data. Here, the four-order Fourier function is adopted
tional GNSS Service) ultra-rapid satellite orbit data and clock       for the empirical models. In addition, quality-assured atmo-
corrections are adopted in PPP processing. The ZTDs are               spheric profiles observed by three radiosonde sites (marked
estimated with an interval of 30 min, whilst the horizon-             with black diamonds in Fig. 1) from the Integrated Global
tal gradients are estimated every 12 h. The global mapping            Radiosonde Archive (IGRA) (Durre et al., 2006) will be used
function (GMF) is used (Boehm et al., 2006) in the esti-              to evaluate the meteorological data and PWV measurements.
mation, and GNSS observations with elevation angles be-               Both RSCS and RSCZ stations are equipped with GTS1 ra-
low 5◦ are rejected. Evaluation results show that our esti-           diosonde sensors, whilst the type of GZZ2 sensor is adopted
mated ZTDs have an accuracy of ∼ 9 mm in the compari-                 by the RSHH station (refer to https://www1.ncdc.noaa.gov/
son by radiosonde-measured ones. However, some stations               pub/data/igra/history/igra2-metadata.txt, last access: March
in the Hunan GNSS network are not collocated with me-                 2018).
teorological sensors; thus, they cannot be directly used for
water vapor monitoring. Except the Hunan GNSS network,                2.2   ECMWF reanalysis
there are many GNSS stations without meteorological obser-
vations distributed across the province, which could be in-           ECMWF ERA-Interim is a global atmospheric reanalysis
cluded for enhancing the quality of constructed PWV maps              from 1979, continuously updated in near-real time. In the re-
in the future. Therefore, a strategy of using nearby synoptic         analysis data generation, meteorological observations from
observations is needed to acquire the necessary meteorologi-          in situ platforms (e.g., surface weather stations, ships, buoys,
cal parameters for GNSS PWV retrieval. As shown in Fig. 1,            radiosonde stations and aircraft) and remote sensing satellites
a total of 20 synoptic sites situated in Hunan and surrounding        are assimilated into atmospheric physical models to recreate
provinces can be used for this study. The average distance be-        the past atmospheric conditions (Dee et al., 2011). Due to its
tween a synoptic station and a GNSS station is about 41 km.           high quality and global coverage, the ERA-Interim reanalysis
The 6-hourly pressure and temperature data measured at the            has been exploited in various fields, e.g., GNSS meteorology
synoptic sites can be retrieved from the National Center for          (Wang et al., 2017; Zhang et al., 2017) and climate change
Atmospheric Research (NCAR) (http://rda.ucar.edu/datasets/            research (Chen and Liu, 2016b; Lu et al., 2015). The ERA-

www.atmos-meas-tech.net/11/5153/2018/                                                   Atmos. Meas. Tech., 11, 5153–5166, 2018
5156                                                         B. Chen et al.: Constructing PWV map regional GNSS network

Figure 2. Time series of surface pressure provided by radiosonde, synoptic adjustment and GPT2w model over the whole year of 2015 at
three radiosonde stations: (a) RSCS, (b) RSCZ and (c) RSHH, all of which are located in the Hunan Province, China.

I provides pressure, temperature, humidity and many other           3     PWV map construction with GNSS network
meteorological variables at 37 isobaric levels from 1000 to               observations
1 hPa with a 6 h interval. The reanalysis contains grid prod-
ucts with 11 different scales from 0.125◦ ×0.125◦ to 3◦ ×3◦ ,       3.1    Retrieval of PWV from GNSS ZTD
and the horizontal resolution of 0.25◦ × 0.25◦ is selected for
this study, which equals to about 26 km in Hunan.                   To retrieve PWV from GNSS-inferred ZTD, ZHD should be
                                                                    determined first. The ZHD calculation formula is theoreti-
2.3    GPT2w model                                                  cally derived based on the assumption that the air is an ideal
                                                                    gas and that the troposphere satisfies the hydrostatic equi-
The global pressure and temperature (GPT) model, which is           librium (Davis et al., 1985). Saastamoinen (1972) derived
developed using spherical harmonics (Boehm et al., 2007),           the most widely used ZHD model as follows (Chen and Liu,
can provide pressure and temperature at any site in the vicin-      2016a):
ity of the Earth’s surface. Lagler et al. (2013) significantly
improved the GPT model, especially for its spatial and tem-         ZHD = 2.2793Ps /(1 − 0.0026 cos 2ϕ − 0.00028h),             (1)
poral variability, and named this new version as GPT2. An
extension version called GPT2w was developed by Boehm               where ϕ is the station latitude (unit: radians) and h is the
et al. (2015) with improved capability to determine ZWD in          height of the station above sea level (unit: km). By sub-
blind mode. Besides the pressure and temperature, the re-           tracting ZHD from ZTD, the remainder ZWD can then be
fined GPT2w model also provides various parameters such             converted to PWV by using the formula below (Askne and
as water vapor pressure, weighted mean temperature and the          Nordius, 1987):
temperature lapse rate.
                                                                                     105
                                                                    PWV =                         ZWD,                          (2)
                                                                              (k3 /Tm + k 0 2 )Rv

                                                                    where k3 = 3.776 × 10⁵ K2 hPa−1 , k 0 2 = 16.52 K hPa−1 and
                                                                    Rv = 461.495 J K kg−1 are physical constants (Rüeger,
                                                                    2002). The weighted mean temperature Tm is defined as fol-

Atmos. Meas. Tech., 11, 5153–5166, 2018                                               www.atmos-meas-tech.net/11/5153/2018/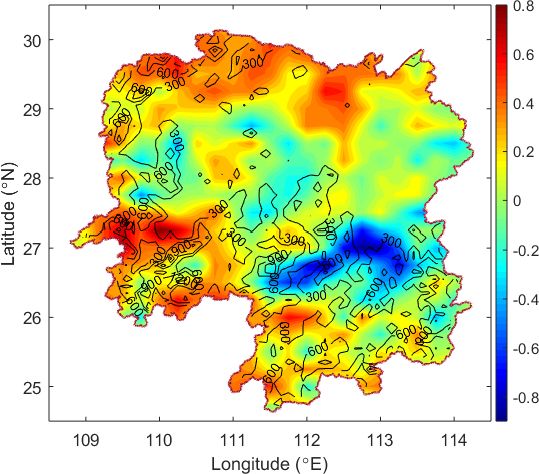
B. Chen et al.: Constructing PWV map regional GNSS network                                                                     5157

lows (Davis et al., 1985):                                       Table 1. Estimated values of a, b, µ and α for the 20 synoptic sites
                                                                 using ERA-I atmospheric profiles over the whole year of 2014.
        R    e(h)
            T (h) dh
Tm = R       e(h)
                      ,                                    (3)             Station                Parameters
            T (h)2
                   dh
                                                                                           a       b           µ         α
where e(h) and T (h) are the water vapor pressure (hPa) and                S01        264.72    0.82   −0.1110      −4.47
temperature (K) at height h, respectively. Since the humid-                S02        264.40    0.83   −0.1112      −4.48
ity and temperature profiles are usually unavailable, a linear             S03        264.90    0.82   −0.1106      −4.25
relationship between surface temperature Ts and Tm is often                S04        267.08    0.75   −0.1102      −3.76
adopted to determine the Tm :                                              S05        265.67    0.79   −0.1111      −4.05
                                                                           S06        266.46    0.78   −0.1104      −3.90
                                                                           S07        265.68    0.79   −0.1103      −4.16
Tm = a + bTs ,                                             (4)
                                                                           S08        266.49    0.77   −0.1108      −3.79
                                                                           S09        267.32    0.73   −0.1101      −3.88
where a and b are coefficients that need to be fitted locally              S10        267.23    0.73   −0.1102      −4.09
using radiosonde or reanalysis profiles.                                   S11        269.07    0.67   −0.1097      −3.66
                                                                           S12        267.99    0.72   −0.1105      −3.66
3.2    Spatial adjustments for Ps and Tm                                   S13        268.40    0.70   −0.1105      −3.64
                                                                           S14        268.74    0.65   −0.1074      −4.06
Because some stations in the Hunan GNSS network are not                    S15        269.02    0.68   −0.1103      −3.69
equipped with meteorological sensors, a method of spatially                S16        269.56    0.66   −0.1099      −3.78
adjusting nearby meteorological observations to the GNSS                   S17        269.43    0.66   −0.1102      −3.70
stations was developed. Adjacent synoptic sites within the                 S18        269.52    0.65   −0.1099      −3.96
100 km radius of a given GNSS station are employed in the                  S19        270.27    0.63   −0.1096      −4.04
adjustments. The adopted radius ensures at least one synoptic              S20        269.82    0.64   −0.1094      −4.14
site being located within the circumference centered on the
GNSS station. For each GNSS site, on average, two synoptic
stations fall into that circumference. First, surface pressure
and mean weighted temperature data at the synoptic sites are
adjusted to the height Hs of the given GNSS station (Zhang       3.3   PWV interpolation from GNSS stations
et al., 2017):
                                                                 With the use of interpolated Ps and Tm , PWV data at the
Ps = Pr eµ(Hs −Hr ) ,                                      (5)   GNSS stations could be obtained in near-real time. In order
Tm = Tmr + α (Hs − Hr ) ,                                  (6)   to construct the PWV map, GNSS PWV data are used to in-
                                                                 terpolate at a 0.25◦ × 0.25◦ grid. Similar to the meteorolog-
where Pr , Tmr and Hr are the pressure (hPa), weighted mean      ical data, PWVs at nearby GNSS stations are interpolated to
temperature (K) and height (km) at the synoptic site, respec-    the given height Hp of the grid point as follows (Dousa and
tively. Here, Tmr is calculated by Eq. (4) using the surface     Elias, 2014):
temperature (K) measured on site. Ps and Tm are the pressure
and weighted mean temperature corresponding to the height
Hs at the synoptic site. µ and α are parameters needed to be                                θ×g
estimated at the synoptic site.                                                 β (Hs − Hr ) β×Rd
                                                                 PWV = PWVr 1 −                   ,                              (8)
   Then the vertically adjusted meteorological data are inter-                      Ts
polated to the location of the GNSS station according to
       n
             exp −di2 × yi

                                                                 where PWVr is the PWV estimated at the GNSS station, β
       P

yG =
       i=1
                                   ,                       (7)   refers to the temperature lapse rate (unit: K km−1 ), θ is a
            n
                                                                 numerical coefficient, g is gravity acceleration (unit: m s−2 ),
                        −di2
            P
                  exp
            i=1                                                  and Rd = 287.053 J K−1 kg−1 is the gas constant for dry air.
                                                                 Both β and θ are required to be determined from local obser-
where n is the number of synoptic sites with a distance less     vations for a better performance. The PWV at the grid point
than 100 km to the given GNSS site, yG is the interpolated       can then be acquired by interpolation using Eq. (7). In this
value, yi is the adjusted meteorological data at synoptic site   study, the height of each grid point is derived from the global
i, and di is the distance between synoptic site i and the GNSS   topography–bathymetry grid that has a 30 arcsec resolution
station.                                                         (SRTM30 PLUS) (Becker et al., 2009).

www.atmos-meas-tech.net/11/5153/2018/                                                Atmos. Meas. Tech., 11, 5153–5166, 2018
5158 B. Chen et al.: Constructing PWV map regional GNSS network
4 Results and discussion derived PWV, the GNSS PWVs are interpolated onto the ra-
diosonde stations according to Eqs. (7) and (8) for a direct
4.1 Evaluation of Ps and Tm interpolated by synoptic comparison with radiosonde-measured ones. As displayed
data in Fig. 4, GNSS-interpolated PWVs agree well with the
radiosonde-measured ones at all the three radiosonde sta-
All the parameters including a and b in Eq. (4), µ in Eq. (5) tions. Mean biases of the PWV differences at RSCS, RSCZ
and α in Eq. (6) are estimated locally at each synoptic site and RSHH station are −0.59, 1.04 and 1.40 mm, respectively
using reanalysis products. In this study, the values of a, b, (see Table 3). In terms of the RMSE, they are 2.47, 2.94
µ and α (their values are given in Table 1) for each site are and 2.69 mm for RSCS, RSCZ and RSHH stations, respec-
fitted from ERA-I atmospheric profiles over the whole year tively. It is notable that for weather nowcasting, the accuracy
of 2014. With the use of the estimated parameters, spatial ad- threshold is 3 mm (Yuan et al., 2014). This indicates that the
justments for Ps and Tm to radiosonde stations are performed GNSS-derived PWVs are accurate enough for the application
throughout the year of 2015. Then the interpolated meteoro- of weather nowcasting. Additionally, the probability density
logical data are directly compared with the radiosonde obser- function (PDF) of PWV differences and the fractional error
vations. as percent by radiosonde 5 mm PWV bins are exhibited in
Figure 2 shows the time series of Ps provided by ra- Fig. 5. As shown in Fig. 5a, about 83 % PWV differences
diosonde, synoptic interpolation and the GPT2w model at are within the range of −5 to 5 mm. The fractional errors
three radiosonde stations over 2015. Surface pressures inter- vary from about −15 % to 6 % as radiosonde PWV increases
polated from synoptic observations have a very good agree- from 0 to 75 mm. When PWV values are less than 10 mm,
ment with radiosonde-measured ones. The GPT2w model there is an obvious wet bias relative to the radiosonde. This is
basically reflects the variation trend of Ps throughout the probably related to the dry bias of Chinese-made GTS1 and
year; however, it is unable to capture the fluctuations which GZZ2 radiosonde sensors caused by solar heating (Moradi
are especially obvious in winter and spring months. Similar et al., 2013), whereas an obvious dry bias can be observed
results can be observed in Fig. 3 for Tm comparison. Detailed for PWV values larger than 65 mm. The dry bias is likely
statistics of the comparison results are given in Table 2. The due to the overestimation of water vapor by radiosonde as
root-mean-square errors (RMSEs) of Ps and Tm derived from the Chinese radiosonde types are known to have a moist bias
synoptic interpolation vary in the range of 1.7–3.0 hPa and for large PWV ranges (Nash et al., 2011). A similar effect
2.5–3.0 K, respectively. In comparison, the RMSEs from the has also been found for other radiosonde types and was as-
GPT2w model are 4.7–5.6 hPa and 3.8–4.2 K, respectively, cribed to the humidity sensors suffering from contamination
for Ps and Tm , which are much larger than the synoptic in- from rain and clouds during radiosonde ascents (Bock et al.,
terpolation method. In terms of maximum and minimum dif- 2005).
ferences, GPT2w-derived values are significantly larger than
those derived from synoptic interpolation, further indicating 4.3 PWV comparison between ERA-I products and
the GPT2w model is less accurate. According to Eq. (1), a GNSS interpolation data
1 hPa error in surface pressure would cause about a 2.3 mm
error in ZHD. Therefore, a 3 hPa error in Ps will result in The ERA-I products are used to further assess the perfor-
an error of about 6.9 mm in ZHD (∼ 1.15 mm in PWV). The mance of PWV maps constructed by the GNSS network data.
relative error of the PWV caused by the Tm error is approx- For the comparison, the GNSS PWVs are interpolated onto
imately equal to the relative error of the Tm (Zhang et al., grid points with a spatial resolution of 0.25◦ in both latitude
2017). Derived from Fig. 3 and Table 2, the relative error and longitude directions to match the ERA-I PWV data. Fig-
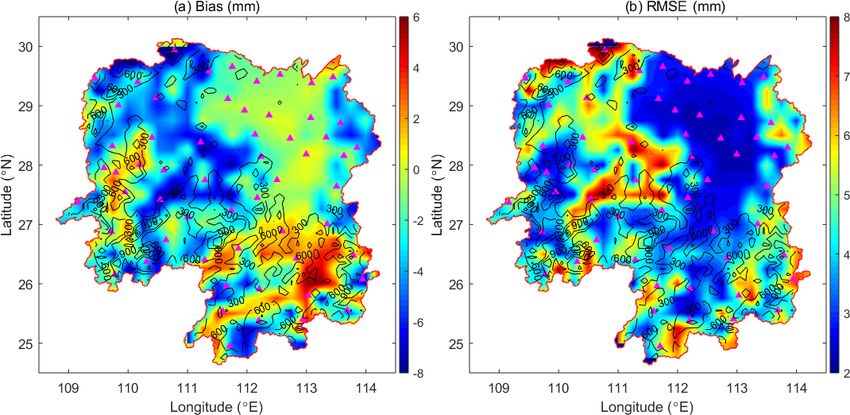
of synoptic-data-interpolated Tm is about 1 %. In the study ure 6 presents the spatial distribution of the bias and RMSE
region, the PWV value is usually less than 80 mm, mean- of the PWV differences between ERA-I and GNSS over the
ing the PWV error caused by the Tm error is within 0.8 mm. Hunan region. As seen in Fig. 6a, the bias varies from −8
In addition, as mentioned in Sect. 2.1, our estimated ZTDs to 6 mm depending upon the location. In general, mountain-
have an accuracy of about 9 mm (∼ 1.45 mm in PWV). On ous regions have a larger bias than plain regions. In terms of
the whole, the accuracy of PWV retrieved from GNSS ZTD RMSE, as shown in Fig. 6b, its values vary in the range of
using Ps and Tm from synoptic interpolation is better than 2–8 mm. Large parts of the studied region are populated with
3.4 mm. Following the same error analysis, the uncertainty RMSEs less than 3 mm. However, relatively large RMSEs of
of PWV caused by the GPT2w model is about 4.6 mm. more than 6 mm are obtained for some mountainous regions.
In addition, the PDF of the PWV differences shown in
4.2 Evaluation of PWV by radiosonde Fig. 7a indicates that there is a higher probability of negative
PWV difference. Negative values account for about 64 % of
At each GNSS station, GNSS-derived ZTDs are converted the total PWV difference. The fractional error as percent by
to PWVs with the use of meteorological parameters inter- ERA-I 5 mm PWV bins varies greatly from about −65 % to
polated from synoptic data. In order to evaluate the GNSS- 10 %. When PWV values are smaller than 10 mm, there is an
Atmos. Meas. Tech., 11, 5153–5166, 2018 www.atmos-meas-tech.net/11/5153/2018/B. Chen et al.: Constructing PWV map regional GNSS network 5159
Figure 3. Time series of weighted mean temperature provided by radiosonde, synoptic adjustment and GPT2w model over the whole year
of 2015 at three radiosonde stations: (a) RSCS, (b) RSCZ and (c) RSHH, all of which are located in the Hunan Province, China.
Table 2. Comparison of Ps and Tm for radiosonde–synoptic and radiosonde–GPT2w at the three radiosonde stations.
RSCS RSCZ RSHH
Comparison
Ps (hPa) Tm (K) Ps (hPa) Tm (K) Ps (hPa) Tm (K)
Radiosonde vs. synoptic Bias 2.91 1.47 −1.66 1.14 −2.58 1.49
RMSE 2.97 2.92 1.74 2.58 2.61 2.76
Max 5.04 9.69 0.48 7.42 −1.33 9.17
Min 1.01 −6.40 −3.82 −5.18 −3.82 −5.40
Radiosonde vs. GPT2w Bias 1.23 1.59 2.02 1.68 3.06 2.23
RMSE 4.70 3.84 4.76 4.02 5.56 4.16
Max 13.75 13.29 12.26 14.21 14.96 14.48
Min −16.13 −7.44 −13.46 −8.08 −14.94 −6.34
Table 3. Comparison between radiosonde-observed and GNSS- obvious wet bias relative to the ERA-I. The largest negative
interpolated PWV at the three radiosonde stations. fractional error occurs at the extremely low (less than 5 mm)
PWV values. When PWV values are larger than 60 mm, dry
Radiosonde Bias RMSE Max Min bias relative to ERA-I can be observed for PWV values. Fig-
station (mm) (mm) (mm) (mm) ure 7c exhibits the relationship between RMSE and eleva-
RSCS −0.59 2.47 7.46 −7.96 tion. It is clearly seen that the RMSE increases generally with
RSCZ 1.04 2.94 10.44 −11.15 increase in elevation. A high correlation coefficient of 0.73
RSHH 1.40 2.69 9.27 −8.59 is achieved between RMSE and elevation. This is consistent
with the bias and RMSE maps in Fig. 6. The high correlation
coefficient is probably due to the following reasons: (1) ver-
tical adjustment for PWV according to Eq. (8) is unable to
www.atmos-meas-tech.net/11/5153/2018/ Atmos. Meas. Tech., 11, 5153–5166, 20185160 B. Chen et al.: Constructing PWV map regional GNSS network Figure 4. Time series of PWV measured by radiosonde and interpolated by GNSS over the whole year of 2015 at three radiosonde stations: (a) RSCS, (b) RSCZ and (c) RSHH. Figure 5. (a) PDF of PWV difference and (b) fractional error as percent by radiosonde 5 mm PWV bins. All the three radiosonde stations are used in the statistics. Atmos. Meas. Tech., 11, 5153–5166, 2018 www.atmos-meas-tech.net/11/5153/2018/
B. Chen et al.: Constructing PWV map regional GNSS network 5161
Figure 6. Map of (a) bias and (b) RMSE of the differences between ERA-I PWV and GNSS-interpolated PWV over the Hunan Province for
the year 2015. Black contours represent the elevation (unit: m).
Figure 7. (a) PDF of PWV difference, (b) fractional error as percent by ERA-I 5 mm PWV bins, and (c) relationship between RMSE and
elevation for the comparison between ERA-I and GNSS.
accurately capture the highly dynamic water vapor variation mulated precipitation over the Hunan Province for 6, 7 and
in the vertical direction and (2) the performance of the ERA- 8 June 2015. The precipitation data are retrieved from the
I PWV product degrades in mountainous regions due to the Tropical Rainfall Measuring Mission (TRMM), a joint mis-
larger errors caused by PWV averaging over cells with highly sion of NASA (National Aeronautics and Space Administra-
variable surface topography (Alshawaf et al., 2017). tion) and the Japan Aerospace Exploration Agency to mea-
sure rainfall for weather and climate research (Kummerow
4.4 Monitoring water vapor variations using et al., 1998; Lau and Wu, 2011). As shown in Fig. 8a, the
GNSS-derived PWV maps accumulated precipitation on 6 June decreased from about
60 mm at the southeast to 0 mm at the northwest. On 7 June,
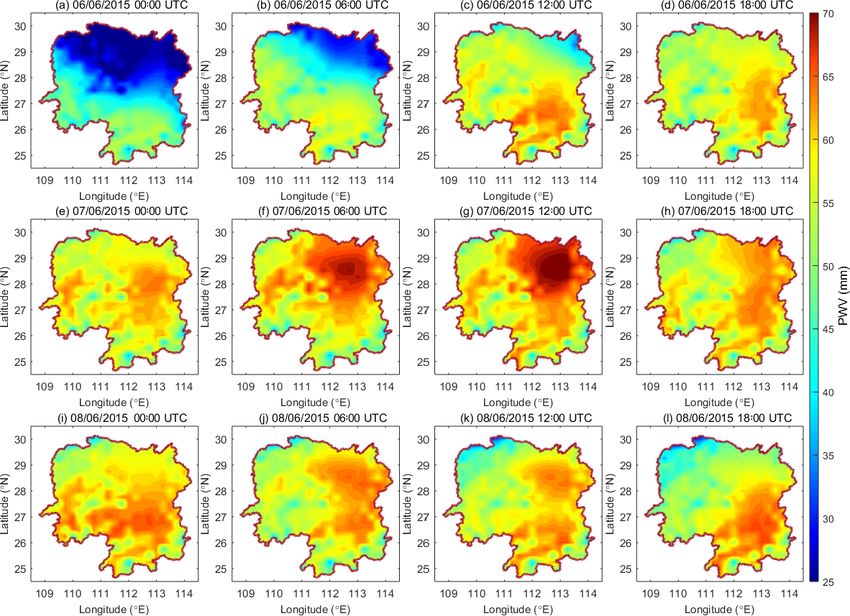
The ultimate goal of this study is to apply the constructed rainfalls were observed over most parts of the province with
PWV maps for the study of weather forecasting. We fur- heavy precipitation mainly occurring in the northern Hunan
ther investigated the water vapor variations during a large- Province. Afterwards, on 8 June, the precipitation weakened
scale heavy-precipitation event using the PWV maps derived on most of the Hunan Province except for an increase in the
from GNSS observations. In June 2015, the Hunan Province northeast.
suffered several large-scale regional torrential rains, which Figure 9 presents the evolution of PWV derived from
caused major floods and massive landslides in some places. GNSS observations for the Hunan Province during the pe-
An average rainfall of 236 mm over the whole province was riod of 6–8 June 2015 with a time interval of 6 h. In addi-
recorded in that month, and the accumulated rainfall ex- tion, the TRMM-derived rain rates over Hunan for the same
ceeded 500 mm in many areas. In this study, we focused on a epochs are displayed in Fig. 10. On 6 June (see Fig. 9a–
heavy rainfall process occurring during 6–8 June 2015. Fig- d), the whole province experienced an obvious increase in
ure 8 exhibits the geographic distribution of the daily accu-
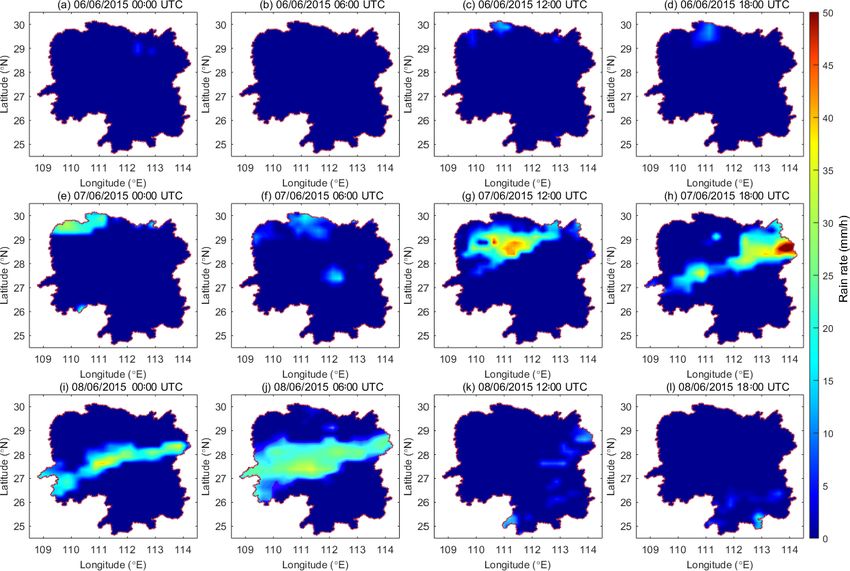
www.atmos-meas-tech.net/11/5153/2018/ Atmos. Meas. Tech., 11, 5153–5166, 20185162 B. Chen et al.: Constructing PWV map regional GNSS network Figure 8. Map of daily accumulated precipitation in the Hunan Province on (a) 6 June 2015, (b) 7 June 2015 and (c) 8 June 2015. The precipitation data were retrieved from the TRMM with a spatial resolution of 0.25◦ × 0.25◦ . Figure 9. Evolution of GNSS-derived PWV maps for the Hunan Province every 6 h from 00:00 UTC, 6 June 2015, to 18:00 UTC, 8 June 2015. PWV from south to north, indicating that a large amount of rienced an increase of 10–15 mm from 00:00 to 12:00 UTC moisture from the south flowed into Hunan. This is consis- of 7 June and then dissipated quickly. On 8 June, obvious tent with the precipitation pattern displayed in Fig. 8a in that PWV decreases were observed in the northwest, whereas the the rainfall gradually decreased from south to north. On 7 southeast experienced a slight increase in PWV. The precip- June, significant PWV changes mainly concentrated in re- itation maps shown in Fig. 8b and c also agree well with the gions north of 28◦ N. Especially in the northeast, PWV expe- PWV variations. From 7 to 8 June, the precipitation areas Atmos. Meas. Tech., 11, 5153–5166, 2018 www.atmos-meas-tech.net/11/5153/2018/
B. Chen et al.: Constructing PWV map regional GNSS network                                                                        5163

Figure 10. Evolution of rain rate maps for the Hunan Province every 6 h from 00:00 UTC, 6 June 2015, to 18:00 UTC, 8 June 2015. The rain
rate data were retrieved from the TRMM with a spatial resolution of 0.25◦ × 0.25◦ .

                                                                      largely decreased in the north whilst they slightly expanded
                                                                      in the south. Referring to the rain rates at the corresponding
                                                                      epochs, as shown in Fig. 10, we cannot observe close corre-
                                                                      lations between the PWV and the rain rate. Larger moisture
                                                                      convergence is not necessarily linked with higher rain rate
                                                                      occurrence. This is because the moisture convergence is not
                                                                      the only cause of precipitation, whilst it is also controlled
                                                                      by many other factors such as wind, temperature and terrain.
                                                                      However, the GNSS-derived PWV maps are able to reveal
                                                                      the moisture advection, transportation and convergence dur-
                                                                      ing the heavy-precipitation event.
                                                                         In addition, Fig. 11 further exhibits the geographic dis-
                                                                      tribution of the correlation coefficient between precipitation
                                                                      and PWV. The correlation coefficients vary greatly from
                                                                      −0.9 to 0.8 depending upon the location. High positive cor-
                                                                      relation coefficients are present in western regions between
                                                                      27 and 27.5◦ N. Precipitation and PWV show a high nega-
                                                                      tive relationship in eastern regions between 26 and 27◦ N. It
Figure 11. Map of the correlation coefficient between precipitation   can be observed from Figs. 1 and 11 that high positive or
and PWV for the heavy rainfall process of 6–8 June 2015 over the      negative correlation coefficients mainly occur in mountain-
Hunan Province. Black contours represent the elevation (unit: m).
                                                                      ous regions, especially in hillsides and valleys. This is be-
The correlation coefficients were calculated for the accumulated
                                                                      cause the mesoscale orography creates favorable conditions
precipitation and PWV for the 6–8 June 2015 period.
                                                                      for precipitation formation by generating moisture conver-
                                                                      gence and the small-scale orography plays an important role

www.atmos-meas-tech.net/11/5153/2018/                                                    Atmos. Meas. Tech., 11, 5153–5166, 2018
5164 B. Chen et al.: Constructing PWV map regional GNSS network
by triggering convective initiation and enhancement (Lab- tion, we also find that the precipitation and PWV correlate
bouz et al., 2013). Therefore, precipitation and PWV corre- more closely in mountainous regions, especially in hillsides
late more closely in mountainous regions than flat terrains, and valleys.
and mountainous regions are often sensitive areas prone to This research demonstrates the potentials of retrieving ac-
high frequency of heavy precipitation. curate PWV from GNSS observations using adjacent syn-
optic data and generating high-quality PWV maps from the
GNSS network for weather prediction in near-real time. Fu-
5 Summary and conclusions ture work will focus on the three following issues: (1) exam-
ining the reliability of the PWV map construction in other
The lack of collocated meteorological data at the GNSS sta- areas with highly dynamic water vapor, (2) assessing the per-
tion makes it difficult to take full advantage of GNSS obser- formance of the constructed PWV maps with higher spatial
vations for weather studies. This paper investigates an alter- and temporal resolutions, and (3) assimilating the PWV maps
native method for accurate determination of PWV for near- into a numerical prediction model to enhance the capability
real-time applications using GNSS data and nearby synop- of extreme weather forecasting.
tic observations. Moreover, we present a method to construct
PWV maps with the use of a GNSS network, which is critical
for improving the forecasting capability of extreme weathers, Data availability. The ECMWF ERA-Interim reanalysis products
e.g., heavy rainfall. are available online (http://apps.ecmwf.int/datasets/) (ECMWF,
The proposed approach for PWV map construction con- 2018). The radiosonde data were obtained from http://weather.
sists of two main steps: (1) the Ps and Tm derived at the uwyo.edu/upperair/sounding.html (University of Wyoming, 2018).
The TRMM rainfall data were provided by https://pmm.nasa.
nearby synoptic sites are interpolated onto the location of
gov/data-access/downloads/trmm (NASA, 2018). The synoptic ob-
the GNSS stations through both vertical and horizontal ad-
servations were provided by http://rda.ucar.edu/datasets/ds336.0/
justments and (2) vertical reduction and horizontal interpola- (NCAR, 2018). The SRTM30 PLUS data were provided by http:
tion are performed to construct PWV map using the retrieved //topex.ucsd.edu/index.html (University of California San Diego,
GNSS PWV. In this study, ERA-I data over the whole year 2018). The GNSS observations of the Hunan GNSS network pre-
of 2014 were employed to estimate all the parameters in- sented in this study are available from the authors upon request
volved in the above two steps. The accuracies of the synoptic- (yeary124@csu.edu.cn).
interpolated and GPT2w-derived Ps and Tm have been evalu-
ated by comparing them against the observed values at three
radiosonde sites in 2015. The RMSEs of Ps and Tm derived Author contributions. BC and WD designed this study, developed
from the GPT2w model vary in the range of 4.7–5.6 hPa and the methodology, performed the analysis and wrote the manuscript.
3.8–4.2 K, respectively. The RMSEs from synoptic interpo- ZL, LW, CK and MAO provided guidance and helped polish the
lation are 1.7–3.0 hPa and 2.5–3.0 K, respectively, which are manuscript.
much better than the GPT2w model.
In addition, GNSS-interpolated PWVs are assessed with
Competing interests. The authors declare that they have no conflict
respect to reference PWV values from radiosonde and ERA-
of interest.
I. GNSS-interpolated PWVs show a good agreement with the
radiosonde-measured ones with RMSEs varying in the range
of 2.4–3.0 mm. In the comparison with ERA-I, the biases
Special issue statement. This article is part of the special issue “Ad-
of their differences vary from −8 to 6 mm over the Hunan vanced Global Navigation Satellite Systems tropospheric products
Province and mountainous regions have a larger bias than for monitoring severe weather events and climate (GNSS4SWEC)
flat regions in general. The RMSEs are within the range of (AMT/ACP/ANGEO inter-journal SI)”. It is not associated with a
2–8 mm, with those for most regions being less than 3 mm. conference.
For PWV values less than 10 mm or more than 60 mm, there
is an obvious wet or dry bias relative to ERA-I. Furthermore,
the RMSEs are found to increase with increased elevation in Acknowledgements. This work was supported by the Research
general, and a high correlation coefficient of 0.73 is obtained Grant for Specially Hired Associate Professor of Central South
between RMSE and elevation. University (project no. 202045005). Zhizhao Liu thanks the Hong
We further apply the constructed PWV maps to moni- Kong Polytechnic University (projects 152149/16E, 152103/14E,
tor the water vapor variability during a large-scale heavy- 152168/15E and 1-BBYH) and the grant supports from the Key
Program of the National Natural Science Foundation of China
precipitation event that occurred during 6–8 June 2015 in the
(project no. 41730109). The European Centre for Medium-Range
Hunan Province. Results demonstrate that it is possible to re- Weather Forecasts is appreciated for providing the ECMWF
veal the moisture advection, transportation and convergence reanalysis data. The TRMM rainfall data were provided by the
during the heavy rainfall using PWV maps. Since the orog- National Aeronautics and Space Administration (NASA), via
raphy provides favorable conditions for precipitation forma-
Atmos. Meas. Tech., 11, 5153–5166, 2018 www.atmos-meas-tech.net/11/5153/2018/B. Chen et al.: Constructing PWV map regional GNSS network 5165
https://pmm.nasa.gov/data-access/downloads/trmm (last access: Boehm, J., Möller, G., Schindelegger, M., Pain, G., and Weber,
March 2018). The synoptic observations were provided by the Na- R.: Development of an improved empirical model for slant de-
tional Center for Atmospheric Research (NCAR), from the website lays in the troposphere (GPT2w), GPS Solut., 19, 433–441,
http://rda.ucar.edu/datasets/ds336.0/ (last access: March 2018). https://doi.org/10.1007/s10291-014-0403-7, 2015.
The SRTM30 PLUS data were provided by the Satellite Geodesy Brenot, H., Neméghaire, J., Delobbe, L., Clerbaux, N., De Meut-
research group at the Institute of Geophysics and Planetary Physics, ter, P., Deckmyn, A., Delcloo, A., Frappez, L., and Van
Scripps Institution of Oceanography, University of California San Roozendael, M.: Preliminary signs of the initiation of deep
Diego, from the website http://topex.ucsd.edu/index.html (last convection by GNSS, Atmos. Chem. Phys., 13, 5425–5449,
access: March 2018). Finally, the authors want to thank the https://doi.org/10.5194/acp-13-5425-2013, 2013.
University of Wyoming for providing the radiosonde data. Chen, B. and Liu, Z.: A Comprehensive Evaluation and Anal-
ysis of the Performance of Multiple Tropospheric Models in
Edited by: Roeland Van Malderen China Region, IEEE Trans. Geosci. Remote Sens., 54, 663–678,
Reviewed by: three anonymous referees https://doi.org/10.1109/TGRS.2015.2456099, 2016a.
Chen, B. and Liu, Z.: Global Water Vapor Variability and
Trend from the Latest 36-Year (1979 to 2014) Data of
ECMWF and NCEP Reanalyses, Radiosonde, GPS and Mi-
References crowave Satellite, J. Geophys. Res.-Atmos., 121, 11442–11462,
https://doi.org/10.1002/2016JD024917, 2016b.
Ahrens, C. and Samson, P.: Extreme weather and climate, 1 Edn., Dach, R., Lutz, S., Walser, P., and Fridez, P.: Bernese GNSS Soft-
22 February 2010, Brooks Cole, United States of America, 2011. ware Version 5.2, https://doi.org/10.7892/boris.72297, 2015.
Alshawaf, F., Fuhrmann, T., Knopfler, A., Luo, X., Mayer, M., Davis, J. L., Herring, T. A., Shapiro, I. I., Rogers, A. E. E., and
Hinz, S., and Heck, B.: Accurate Estimation of Atmospheric Wa- Elgered, G.: Geodesy by radio interferometry: Effects of atmo-
ter Vapor Using GNSS Observations and Surface Meteorolog- spheric modeling errors on estimates of baseline length, Radio
ical Data, IEEE Trans. Geosci. Remote Sens., 53, 3764–3771, Sci., 20, 1593–1607, 1985.
https://doi.org/10.1109/TGRS.2014.2382713, 2015. Dee, D. P., Uppala, S. M., Simmons, A. J., Berrisford, P., Poli,
Alshawaf, F., Balidakis, K., Dick, G., Heise, S., and Wickert, J.: P., Kobayashi, S., Andrae, U., Balmaseda, M. A., Balsamo, G.,
Estimating trends in atmospheric water vapor and temperature Bauer, P., Bechtold, P., Beljaars, A. C. M., van de Berg, L., Bid-
time series over Germany, Atmos. Meas. Tech., 10, 3117–3132, lot, J., Bormann, N., Delsol, C., Dragani, R., Fuentes, M., Geer,
https://doi.org/10.5194/amt-10-3117-2017, 2017. A. J., Haimberger, L., Healy, S. B., Hersbach, H., Hólm, E. V.,
Askne, J. and Nordius, H.: Estimation of tropospheric delay for mi- Isaksen, L., Kållberg, P., Köhler, M., Matricardi, M., McNally,
crowaves from surface weather data, Radio Sci., 22, 379–386, A. P., Monge-Sanz, B. M., Morcrette, J.-J., Park, B.-K., Peubey,
1987. C., de Rosnay, P., Tavolato, C., Thépaut, J.-N., and Vitart, F.: The
Becker, J. J., Sandwell, D. T., Smith, W. H. F., Braud, J., Binder, ERA-Interim reanalysis: configuration and performance of the
B., Depner, J., Fabre, D., Factor, J., Ingalls, S., Kim, S.- data assimilation system, Q. J. Roy. Meteorol. Soc., 137, 553–
H., Ladner, R., Marks, K., Nelson, S., Pharaoh, A., Trim- 597, https://doi.org/10.1002/qj.828, 2011.
mer, R., Von Rosenberg, J., Wallace, G., and Weatherall, Dousa, J. and Elias, M.: An improved model for calculating
P.: Global Bathymetry and Elevation Data at 30 Arc Sec- tropospheric wet delay, Geophys. Res. Lett., 41, 4389–4397,
onds Resolution: SRTM30_PLUS, Mar. Geod., 32, 355–371, https://doi.org/10.1002/2014GL060271, 2014.
https://doi.org/10.1080/01490410903297766, 2009. Durre, I., Vose, R. S., and Wuertz, D. B.: Overview of the integrated
Bevis, M., Businger, S., Herring, T. A., Rocken, C., Anthes, R. A., global radiosonde archive, J. Climate, 19, 53–68, 2006.
and Ware, R. H.: GPS meteorology: Remote sensing of atmo- ECMWF: European Centre for Medium-Range Weather Forecasts
spheric water vapor using the Global Positioning System, J. Geo- (ECMWF) ERA-Interim reanalysis, available at: http://apps.
phys. Res.-Atmos., 1984–2012, 97, 15787–15801, 1992. ecmwf.int/datasets, last access: March 2018.
Bevis, M., Businger, S., Chiswell, S., Herring, T., Anthes, R., Guerova, G., Jones, J., Douša, J., Dick, G., de Haan, S., Pottiaux, E.,
Rocken, C., and Ware, R. H.: GPS Meteorology: Mapping zenith Bock, O., Pacione, R., Elgered, G., Vedel, H., and Bender, M.:
wet delays onto precipitable water, J. Appl. Meteorol., 33, 379– Review of the state of the art and future prospects of the ground-
386, 1994. based GNSS meteorology in Europe, Atmos. Meas. Tech., 9,
Bock, O., Keil, C., Richard, E., Flamant, C., and Bouin, M.: Vali- 5385–5406, https://doi.org/10.5194/amt-9-5385-2016, 2016.
dation of precipitable water from ECMWF model analyses with Kummerow, C., Barnes, W., Kozu, T., Shiue, J., and Simpson, J.:
GPS and radiosonde data during the MAP SOP, Q. J. R. Me- The tropical rainfall measuring mission (TRMM) sensor pack-
teorol. Soc., 131, 3013–3036, https://doi.org/10.1256/qj.05.27, age, J. Atmos. Ocean. Tech., 15, 809–817, 1998.
2005. Labbouz, L., Van Baelen, J., Tridon, F., Reverdy, M., Hagen, M.,
Boehm, J., Niell, A., Tregoning, P., and Schuh, H.: Global Map- Bender, M., Dick, G., Gorgas, T., and Planche, C.: Precipita-
ping Function (GMF): A new empirical mapping function based tion on the lee side of the Vosges Mountains: Multi-instrumental
on numerical weather model data, Geophys. Res. Lett., 33, study of one case from the COPS campaign, Meteorol. Z., 22,
https://doi.org/10.1029/2005GL025546, 2006. 413–432, https://doi.org/10.1127/0941-2948/2013/0413, 2013.
Boehm, J., Heinkelmann, R., and Schuh, H.: Short Note: A global Lagler, K., Schindelegger, M., Boehm, J., Krásná, H., and Nils-
model of pressure and temperature for geodetic applications, J. son, T.: GPT2: Empirical slant delay model for radio space
Geod., 81, 679–683, https://doi.org/10.1007/s00190-007-0135-
3, 2007.
www.atmos-meas-tech.net/11/5153/2018/ Atmos. Meas. Tech., 11, 5153–5166, 20185166 B. Chen et al.: Constructing PWV map regional GNSS network geodetic techniques, Geophys. Res. Lett., 40, 1069–1073, Rüeger, J. M.: Refractive index formulae for radio waves, in Inte- https://doi.org/10.1002/grl.50288, 2013. gration of Techniques and Corrections to Achieve Accurate En- Lau, K.-M. and Wu, H.-T.: Climatology and changes in tropi- gineerin, p. 13, Washington, D.C. USA., 2002. cal oceanic rainfall characteristics inferred from Tropical Rain- Saastamoinen, J.: Atmospheric correction for the troposphere and fall Measuring Mission (TRMM) data (1998–2009), J. Geophys. stratosphere in radio ranging of satellites, Geophys. Monogr. Res., 116, https://doi.org/10.1029/2011JD015827, 2011. Ser., 15, 247–251, 1972. Li, L., Wu, S., Wang, X., Tian, Y., He, C. and Zhang, K.: Sea- University of Wyoming: Radiosonde data, Department of Atmo- sonal Multifactor Modelling of Weighted-Mean Temperature for spheric Science of the University of Wyoming, http://weather. Ground-Based GNSS Meteorology in Hunan, China, Adv. Mete- uwyo.edu/upperair/sounding.html, last access: March 2018. orol., 1–13, https://doi.org/10.1155/2017/3782687, 2017. Van Baelen, J., Reverdy, M., Tridon, F., Labbouz, L., Dick, Li, L., Wu, S.-Q., Wang, X.-M., Tian, Y., He, C.-Y. and Zhang, K.- G., Bender, M., and Hagen, M.: On the relationship be- F.: Modelling of weighted-mean temperature using regional ra- tween water vapour field evolution and the life cycle of pre- diosonde observations in Hunan China, Terr. Atmos. Ocean. Sci., cipitation systems, Q. J. Roy. Meteorol. Soc., 137, 204–223, 29, 187–199, https://doi.org/10.3319/TAO.2017.05.26.01, 2018. https://doi.org/10.1002/qj.785, 2011. Lu, C., Li, X., Li, Z., Heinkelmann, R., Nilsson, T., Dick, Wang, J., Zhang, L., Dai, A., Van Hove, T., and Van Baelen, J.: A G., Ge, M., and Schuh, H.: GNSS tropospheric gradi- near-global, 2-hourly data set of atmospheric precipitable water ents with high temporal resolution and their effect on pre- from ground-based GPS measurements, J. Geophys. Res., 112, cise positioning, J. Geophys. Res.-Atmos.„ 121, 912–930, D11107, https://doi.org/10.1029/2006JD007529, 2007. https://doi.org/10.1002/2015JD024255, 2016. Wang, X., Zhang, K., Wu, S., He, C., Cheng, Y., and Li, X.: De- Lu, N., Qin, J., Gao, Y., Yang, K., Trenberth, K. E., Gehne, M., termination of zenith hydrostatic delay and its impact on GNSS- and Zhu, Y.: Trends and variability in atmospheric precipitable derived integrated water vapor, Atmos. Meas. Tech., 10, 2807– water over the Tibetan Plateau for 2000–2010, Int. J. Climatol., 2820, https://doi.org/10.5194/amt-10-2807-2017, 2017. 35, 1394–1404, https://doi.org/10.1002/joc.4064, 2015. Yao, Y., Shan, L., and Zhao, Q.: Establishing a method of short- Mohanakumar, K.: Stratosphere troposphere interactions: An intro- term rainfall forecasting based on GNSS-derived PWV and its duction, Springer, New York, USA, 2008. application, Sci. Rep., 7, 12465, https://doi.org/10.1038/s41598- Moradi, I., Soden, B., Ferraro, R., Arkin, P., and Vömel, H.: As- 017-12593-z, 2017. sessing the quality of humidity measurements from global oper- Yao, Y. B., Zhang, B., Yue, S. Q., Xu, C. Q., and Peng, W. F.: Global ational radiosonde sensors, J. Geophys. Res.-Atmos., 118, 8040– empirical model for mapping zenith wet delays onto precipitable 8053, https://doi.org/10.1002/jgrd.50589, 2013. water, J. Geod., 87, 439–448, https://doi.org/10.1007/s00190- Musa, T. A., Amir, S., Othman, R., Ses, S., Omar, K., Abdullah, 013-0617-4, 2013. K., Lim, S. and Rizos, C.: GPS meteorology in a low-latitude Yuan, Y., Zhang, K., Rohm, W., Choy, S., Norman, R., and Wang, region: Remote sensing of atmospheric water vapor over the C.-S.: Real-time retrieval of precipitable water vapor from GPS Malaysian Peninsula, J. Atmos. Sol.-Terr. Phys., 73, 2410–2422, precise point positioning, J. Geophys. Res.-Atmos., 119, 10044– https://doi.org/10.1016/j.jastp.2011.08.014, 2011. 10057, https://doi.org/10.1002/2014JD021486, 2014. NASA: National Aeronautics and Space Administration (NASA) Zhang, H., Yuan, Y., Li, W., Ou, J., Li, Y., and Zhang, B.: TRMM precipitation data, available at: https://pmm.nasa.gov/ GPS PPP-derived precipitable water vapor retrieval based data-access/downloads/trmm, last access: March 2018. on Tm/Ps from multiple sources of meteorological data Nash, J., Oakley, T., Vömel, H., and Li, W.: WMO Intercomparison sets in China, J. Geophys. Res.-Atmos., 122, 4165–4183, of high quality radiosonde systens, World Meteorological Orga- https://doi.org/10.1002/2016JD026000, 2017. nization, Instruments and observations, Yangjiang, China, 2011. Zhang, K., Manning, T., Wu, S., Rohm, W., Silcock, D., NCAR: National Center for Atmospheric Research (NCAR) synop- and Choy, S.: Capturing the signature of severe weather tic data, available at: http://rda.ucar.edu/datasets/ds336.0/T, last events in Australia using GPS measurements, IEEE J. access: March 2018. Sel. Top. Appl. Earth Obs. Remote Sens., 8, 1839–1847, Pacione, R., Araszkiewicz, A., Brockmann, E., and Dousa, https://doi.org/10.1109/JSTARS.2015.2406313, 2015. J.: EPN-Repro2: A reference GNSS tropospheric data set over Europe, Atmos. Meas. Tech., 10, 1689–1705, https://doi.org/10.5194/amt-10-1689-2017, 2017. Atmos. Meas. Tech., 11, 5153–5166, 2018 www.atmos-meas-tech.net/11/5153/2018/
You can also read