Designing Deep-Based Learning Flood Forecast Model With ConvLSTM Hybrid Algorithm
←
→
Page content transcription
If your browser does not render page correctly, please read the page content below

Received February 28, 2021, accepted March 10, 2021, date of publication March 15, 2021, date of current version April 8, 2021.
Digital Object Identifier 10.1109/ACCESS.2021.3065939

Designing Deep-Based Learning Flood Forecast
Model With ConvLSTM Hybrid Algorithm
MOHAMMED MOISHIN 1 , RAVINESH C. DEO 1 , (Senior Member, IEEE),
RAMENDRA PRASAD 2 , NAWIN RAJ 1 , AND SHAHAB ABDULLA 3
1 School
       of Sciences, University of Southern Queensland–Springfield, Springfield, QLD 4300, Australia
2 Departmentof Science, School of Science and Technology, The University of Fiji, Lautoka, Fiji
3 USQ College, University of Southern Queensland, Toowoomba, QLD 4350, Australia

Corresponding authors: Ravinesh C. Deo (ravinesh.deo@usq.edu.au) and Mohammed Moishin (mmoishin@gmail.com)
This work was supported by the Australian Government’s Department of Foreign Affairs and Trade through the Australia Awards
Scholarship scheme for Fiji under Grant 2020-2021.

  ABSTRACT Efficient, robust, and accurate early flood warning is a pivotal decision support tool that can
  help save lives and protect the infrastructure in natural disasters. This research builds a hybrid deep learning
  (ConvLSTM) algorithm integrating the predictive merits of Convolutional Neural Network (CNN) and Long
  Short-Term Memory (LSTM) Network to design and evaluate a flood forecasting model to forecast the future
  occurrence of flood events. Derived from precipitation dataset, the work adopts a Flood Index (IF ), in form
  of a mathematical representation, to capture the gradual depletion of water resources over time, employed
  in a flood monitoring system to determine the duration, severity, and intensity of any flood situation. The
  newly designed predictive model utilizes statistically significant lagged IF , improved by antecedent and
  real-time rainfall data to forecast the next daily IF value. The performance of the proposed ConvLSTM
  model is validated against 9 different rainfall datasets in flood prone regions in Fiji which faces flood-driven
  devastations almost annually. The results illustrate the superiority of ConvLSTM-based flood model over the
  benchmark methods, all of which were tested at the 1-day, 3-day, 7-day, and the 14-day forecast horizon. For
  instance, the Root Mean Squared Error (RMSE) for the study sites were 0.101, 0.150, 0.211 and 0.279 for the
  four forecasted periods, respectively, using ConvLSTM model. For the next best model, the RMSE values
  were 0.105, 0.154, 0.213 and 0.282 in that same order for the four forecast horizons. In terms of the difference
  in model performance for individual stations, the Legate-McCabe Efficiency Index (LME) were 0.939, 0.898,
  0.832 and 0.726 for the four forecast horizons, respectively. The results demonstrated practical utility of
  ConvLSTM in accurately forecasting IF and its potential use in disaster management and risk mitigation in
  the current phase of extreme weather events.

  INDEX TERMS ConvLSTM, deep learning, flood forecasting, flood index, flood risk management.

I. INTRODUCTION                                                                                robust and cost-effective solutions for disaster risk and flood
Early detection of natural disasters such as floods can greatly                                event management.
assist humans in reducing the extent of the damage caused by                                      One simple, yet a robust mathematical tool used to deter-
such events. In the Fiji Islands, where this study is focused,                                 mine the flood state at a particular time for a given area is
recent flood events resulted in major damages amounting to                                     the Flood Index (IF ) [3]. This approach represents the stan-
millions of dollars [1]. The loss of at least 225 lives during                                 dardized form of ‘Effective Precipitation’ (PE ) based on the
the 1931 flood event in Fiji was primarily due to the unavail-                                 rationale that a flood event on any particular day is dependent
ability of efficient flood warning systems [2]. Although there                                 on the current and the previous day’s precipitation with the
have been improvements in early warning systems since then,                                    effect of previous day’s precipitation on current day’s flood
many other emerging technologies, which are somewhat con-                                      state gradually reducing due to the effect of hydrological fac-
strained in developing nations, have strong potential to deliver                               tors [4]. IF has been applied at various locations globally and
                                                                                               is generally accepted as an accurate data-driven mechanism
                                                                                               to monitor flood state and, to determine the duration, severity,
   The associate editor coordinating the review of this manuscript and                         and intensity of flood situations [5]–[8]. However, as a flood
approving it for publication was Bo Pu            .                                            monitoring index, IF cannot be currently used to determine

                     This work is licensed under a Creative Commons Attribution 4.0 License. For more information, see https://creativecommons.org/licenses/by/4.0/
50982                                                                                                                                                                 VOLUME 9, 2021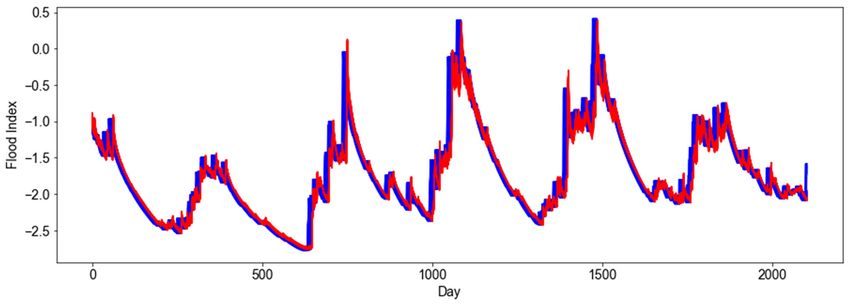
M. Moishin et al.: Designing Deep-Based Learning Flood Forecast Model With ConvLSTM Hybrid Algorithm

the flood state ahead of time unless a predictive model for                    to provide a suitable tool for efficient flood forecasting in
this index is built and tested. If a model is successful in                    developing and developed nations.
predicting the flood event, the exploration of its predictive                     By making significant contribution to disaster risk miti-
skill for multiple forecast horizons is paramount so that early                gation, the purpose of this article is to design an AI-based
warning of the flood state can be dissimilated, setting up flood               predictive model trained as a practical and highly accurate
risk mitigation and adaptation measures. This is the subject of                tool in forecasting the onset of flood state using daily IF and
the present research paper.                                                    precipitation data. The research objectives, which advance the
   To make practical use of IF in forecasting future flood                     application of data-driven methods, make significant contri-
situations, an Artificial Intelligence (AI) based predictive                   butions to flood forecasting and mitigation, as follows:
model can be developed to accurately forecast the future                          (1) Build flood monitoring and validation system by deriv-
values of IF based on antecedent (lagged) values over a                        ing daily IF from rainfall data obtained from Fiji Meteoro-
given period. Notably, AI models have shown good poten-                        logical Service at nine flood-prone sites in Fiji over a 30-year
tial in forecasting floods based on metrics other than IF ,                    period.
with continuous improvement in AI-based methods over the                          (2) Develop multi-step predictive model using ConvL-
past decade. A study on classifying flood severity based on                    STM, as an objective model, with alternative methods of
weather radar and rainfall data showed that Artificial Neu-                    LSTM, CNN-LSTM and SVR that can also determine the
ral Network (ANN) which is an AI-based machine learning                        flood state at 1-day, 3-day, 7-day, and 14-day forecast
algorithm, had good potential to deliver major improvement                     horizons.
in the speed compared with conventional hydraulic simula-                         (3) Evaluate the performance of predictive models using
tors [9]. A more recent AI approach that uses representation                   a diverse range of statistical score metrics, infographics, and
learning with several levels of feature representation is deep                 visual analysis of forecasted and ground-truth dataset.
learning [10]. One popular deep learning approach used for                        (4) Compare the evaluation results of objective model
time-series forecasts is Long Short-Term Memory Network                        with benchmark models and elaborate on the suitability of
(LSTM) [11]. LSTM is a type of Recurrent Neural Network                        the ConvLSTM model in accurately forecasting future flood
(RNN) that can address the vanishing gradient problems                         situations.
in RNNs [12]. This approach has been applied in applica-                          The structure of the paper is as follows. In next section, the
tions e.g., short-term fog forecasting and language process-                   related works are presented. Then in section 3 this research
ing [13], [14]. When LSTM was compared with ANN, the                           presents the problem and motivation for this study and a
former performed better and was relatively stable to simulate                  theoretical overview of ConvLSTM and IF . In section 4,
rainfall-runoff process [15]. Therefore, when compared with                    this study presents experimental methods where the study
conventional machine learning algorithms such as ANN, deep                     area and data used for this study are presented briefly. Next,
learning LSTM seems to be a better option to forecast flood                    the method employed to develop flood forecast models are
events especially using time-series flood monitoring data,                     explained. After this, the results are presented, and this is
such as the current research using IF .                                        followed by the discussion of the limitations, practicality,
   In AI-based methods, multiple deep learning models are                      and contributions of the proposed method. Finally, the paper
normally integrated to deliver a better performance accuracy.                  concludes by presenting insights from this study.
One common model known to provide effective performance
when combined with LSTM is Convolutional Neural Net-                           II. RELATED WORKS
work (CNN) [16]. In Liu, et al. [17], a ConvLSTM module                        Over the years, several data-driven early flood forecasting
was used to predict short-term traffic flow, combining con-                    systems have been developed. These have made use of
volution and LSTM models, outperforming the benchmark                          machine learning algorithms to develop models that show
models. ConvLSTM was applied for precipitation nowcasting                      promising results. Some of these studies are presented in this
to show excellent performance [18]. These studies generally                    section.
illustrate the good performance of ConvLSTM compared                              In one of the earliest examples, Campolo, et al. [20]
with others in similar machine learning problems. It is thus                   developed a neural network river flood forecasting model
expected that ConvLSTM may deliver a better performance                        illustrating promising results at short timescales. However,
in forecasting future flood events using daily IF and rainfall                 a rapid decrease in forecasting performance was evident with
data but no previous study has built this approach into real-                  a longer time horizon. Another short-term flood forecast-
time, multiple-step flood prediction problems.                                 ing approach was presented by Nayak, et al. [21] using
   As an AI-based deep learning model has not been used                        neuro-fuzzy technique. The results illustrated the viabil-
to forecast floods using IF , this novel technique adopted to                  ity of their models for short-term river flow forecasting.
forecast the occurrence of future events is expected to provide                Moving on, Han, et al. [22] applied Support Vector Machine
an alternative to traditional mathematical means such as using                 (SVM) for flood forecasting. However, they mentioned that
the Standardized Precipitation Index (SPI) for early flood                     although their objective model performed better than the
warnings [19]. The cost-effectiveness and accuracy of deep                     benchmark models, it required considerable amount of efforts
learning approaches explored in this paper, is also expected                   to ensure the better performance of the objective model

VOLUME 9, 2021                                                                                                                            50983
M. Moishin et al.: Designing Deep-Based Learning Flood Forecast Model With ConvLSTM Hybrid Algorithm

Sit and Demir [23] explored the use of artificial deep neural          without sophisticated flood monitoring technologies. In a
networks for flood prediction and mentioned the usefulness of          previous paper, IF applied in Fiji was shown to be an effective
neural networks for flood forecasting using time-series data.          tool for flood monitoring at short timescales [7]. In many
   The approaches presented so far have made use of conven-            other related works [4]–[6], [27], [28], IF has already been
tional machine learning to forecast flood situations. A study          adopted for flood monitoring studies but none of these studies
by Tran and Song [24], however, used deep learning algo-               have built a deep learning forecast model using the IF . Hence
rithms i.e., RNN and LSTM to forecast water levels as a                IF -based data-driven models trained over multiple forecast
practical means to develop a solution for flood forecasting            horizons, as undertaken in this study, is a proactive step in
in urban areas. Their results indicated that all deep learning         estimating the flood extent of any day-ahead period, based
models had high accuracy. Therefore, in this paper, hybrid             on which flood risk mitigation and disaster response can be
deep learning approaches are used to forecast floods at both           implemented.
short and long timescales, expecting that these newly devel-              The objective model in this study adopts hybrid ConvL-
oped models are a step forward in data-driven-based early              STM algorithm, a dual combination of deep learning method.
flood warning systems.                                                 ConvLSTM is a hybrid variant of LSTM architecture that
                                                                       uses convolutional operators instead of matrix multiplication
III. METHODOLOGY
                                                                       for its input to the state and the state-to-state transition.
                                                                       This enables the algorithm to handle spatiotemporal data
A. PROBLEMS AND MOTIVATIONS
                                                                       and determine the upcoming state(s) of a particular cell in
Owing to the insidious and ‘creeping’ nature of flood events,
                                                                       grids using local neighbours’ inputs and previous states [18].
designing robust systems for early flood warnings is a chal-
                                                                       Equations 1 to 5, retrieved from earlier studies of Medel [29]
lenge. This is because the design of early warning systems
                                                                       and Xingjian, et al. [18], expresses the operational mecha-
requires expertise in different technologies [25]. It is under-
                                                                       nisms of ConvLSTM. In these equations, ‘∗’ and ‘◦’ denotes
standable that this could be a bigger challenge for developing
                                                                       convolution operator and Hadamard product, respectively.
nations e.g., Fiji. Therefore, a cost-effective solution that
                                                                       The i, f and o represents each timestamp’s input, forget and
requires a minimum investment in such technologies is desir-
                                                                       output gates, separately. H denotes each timestamp’s hidden
able for flood forecasting purposes. The new flood modeling
                                                                       state, C represents each timestamp’s cell outputs, and X
method presented in this research will address these prob-
                                                                       denotes all the inputs. The activation is denoted by σ while
lems. A data-driven model that requires only the daily rainfall
                                                                       W is used to denote the weighted connections between the
data to deliver an accurate result is expected to be a cost-
                                                                       states.
effective solution for nations with limited resources where
technological advancements has not penetrated yet. Further-              it   =   σ (Wxi ∗ Xt + Whi ∗ Ht−1 + Wci ◦ Ct−1 + bi )               (1)
more, another motivation behind this study is the recurrent                       σ Wxf ∗ Xt + Whf ∗ Ht−1 + Wcf ◦ Ct−1 + bf

                                                                         ft   =                                                              (2)
destructions that flood events have caused in the present study
                                                                        Ct    =   ft ◦ Ct−1 +it ◦ tanh (Wxc ∗ Xt +Whc ∗ Ht−1 +bc )           (3)
area over many years. Through this study, the authors hope
to develop and validate a new flood forecasting model that              ot    =   σ (Wxo ∗ Xt + Who ∗ Ht−1 + Wco ◦ Ct + bo )                 (4)
can be used to mitigate the impact of floods not only in                Ht    =   ot ◦ tanh (Ct )                                            (5)
island nations but also elsewhere by enabling the people and
                                                                         Theoretical explanations of benchmark models,
organizations to be better prepared for future flood events.
                                                                       LSTM [30], CNN-LSTM [31] and SVR [32] (Support Vector
                                                                       Regression), are available in studies elsewhere.
B. THEORETICAL OVERVIEW
To date, there are only a handful of flood monitoring indices          C. OVERVIEW OF THE PROPOSED PREDICTIVE MODEL
that can determine the flood state for any day based on                In previous sub-sections, an overview of IF and ConvLSTM
antecedent day’s rainfall [3], [26]. These are categorised into        is provided. In this section the overall architecture of the
data-driven mathematical models and have generally been                proposed model is presented. As evident in Figure 1, the main
accepted to produce accurate results. As mentioned previ-              information needed to build the predictive model is daily
ously, IF is adopted for this study as it conforms to the              rainfall. The antecedent raw rainfall data and rainfall derived,
rationale of Lu [26]. Basically, IF uses current and antecedent        daily IF data are used as two inputs to the selected algorithm.
day’s rainfall data to determine the flood state of current            The algorithm is used to forecast IF for 1-, 3-, 7- and 14-day
day. The contributory influence of previous day’s precipita-           forecast horizons.
tion on current day’s possibility of a flood decreases gradu-
ally in agreement with a time-dependent reduction function.            IV. EXPERIMENTS
Through this, the flood index can account for the loss of              A. STUDY AREA
water due to hydrological factors e.g., evaporation, percola-          The focus of this study is on towns and cities in Fiji. The
tion, evapotranspiration and surface run-off [3]. This makes           Fiji group covers an area of 18,270 km2 in the South Pacific
the flood index a practical tool to determine the flood state          Ocean [33]. Fiji has an oceanic tropical climate with the South
solely using daily rainfall data that is advantageous in regions       Pacific Convergence Zone (SPCZ) having a strong influence

50984                                                                                                                              VOLUME 9, 2021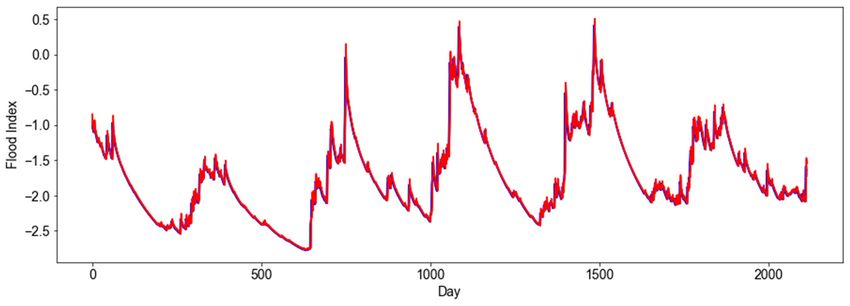
M. Moishin et al.: Designing Deep-Based Learning Flood Forecast Model With ConvLSTM Hybrid Algorithm

                                                                               by dividing the PE over the accumulative weight (W ) of
                                                                               the antecedent period and this is shown in equation 7. Next,
                                                                               the IF is calculated [3]. As shown in equation 9, IF is the
                                                                               standardized version of PE . In this equation, σ (2019    ¯
                                                                                                                                         max
                                                                                                                                   1991 PE )
                                                                                          ¯
                                                                                    2019 max
                                                                               and 1991 PE denote the standard deviation and mean of
                                                                               the yearly maximum daily PE during the study period. The
                                                                               duration, severity and intensity of floods can be successively
                                                                               determined using equations presented in earlier studies [7].
                                                                                                         "P           #
                                                                                                             N
                                                                                                             m=1 Pm
                                                                                                XD
                                                                                        PEi =                           (1 ≤ m ≤ 365)     (6)
                                                                                                    N =1       N
                                                                                                PE
FIGURE 1. Overview of proposed experimental architecture.                              AWRI =                                               (7)
                                                                                                W
                                                                                                Xn=D 1
                                                                                           W =                                              (8)
                                                                                                   n=1 n
on the climate of this small island nation [34]. The wet season
                                                                                                PE − 2019   ¯
                                                                                                            max
in Fiji is usually between November and April and during                                              1991 PE
                                                                                           IF =                                             (9)
this time, the SPCZ is positioned over Fiji. As heavy rain                                       σ (2019 Pmax
                                                                                                          ¯ )
                                                                                                       1991 E
is experienced during this time, this results in regular flood
situations around the flood prone areas in the country [35].                   D. PREDICTIVE MODEL DESIGN
This study covers nine towns and cities from the two largest                   To develop an AI-based flood forecast model, Python [38]
islands in Fiji. These are Viti Levu and Vanua Levu and they                   programming language was used. As Python offers an effi-
have an area of 10,400 and 5,540 km2 , respectively [34].                      cient environment for machine learning data analysis, it was
As seen in Figure 2, due to the small area of the Fiji group,                  selected to design the forecast model [39]. Some machine
this study has covered most of the major towns and cities of                   learning packages for Python included Scikit-Learn [40],
the archipelagic nation.                                                       Tensorflow [41] and Keras [42], as these are popular packages
                                                                               solving machine learning problems that have also been used
B. DATASET                                                                     in previous studies to build efficient forecast models [43]. The
The daily rainfall data for eleven sites from 1st January                      scope of this study was to develop flood-forecasting models
1990 to 31st December 2019 (30 Years) was successfully                         using deep ConvLSTM models and to compare the suitabil-
acquired from Fiji Meteorological Services. These sites are                    ity of the algorithm in forecasting of flood situations using
illustrated in the map from Figure 2. During data pre-                         daily IF .
processing, the following actions were taken for simpler com-                     Prior to data pre-processing, analysis of available data was
putations and more accurate results. Firstly, calendar mean                    done. The IF for all the nine study sites were analysed. Firstly,
was used to fill in the values for missing data points. Two                    the D’Agostino’s K2 Test (DKT) [44] was done to perform the
sites, Navua and Tavua, which had high proportion of missing                   statistical normality (or otherwise) test. The results showed
values, were excluded.                                                         that none of the data were Gaussian. Next, the Dickey-Fuller
   These two sites did not record precipitation for extended                   Test (DFT) [45] was performed to test for stationarity in
duration of the study period. For leap year the rainfall for 29th              data. The IF data were stationary for all study sites. The
of February was added to 1st March following other works                       next step for data analysis was to figure out the number
[6], [27], [28]. This resulted in all years having 365 data                    of lag inputs that would be significant for the time-series
points to facilitate the computation of IF . To visualize, in                  forecasting. Partial Autocorrelation Function (PACF) was
Figure 3, the trend of precipitation using data from Ba site                   used for this purpose. After the impact of other variables are
over a 30-year period is presented.                                            eliminated, the supplementary information given by lagged
                                                                               data is explained by PACF [46]. As seen in Table 1, two and
C. FLOOD INDEX COMPUTATION                                                     three days of lagged inputs were significant for five and four
The computation of IF and relevant metrics associated with                     study sites, respectively. This table also presents the results
IF was performed using MATLAB [36] software. In comput-                        of other data analysis.
ing the IF , the first step was to obtain Effective Precipitation                 In the data pre-processing stage, the data was divided into
(PE ) [4]. The mathematical formula used to obtain the PE is                   training, validation, and testing subsets. 29 years (10,585 data
presented in equation 6. In this equation, N is the duration                   points at daily time-steps) of IF were calculated for each study
of antecedent period and Pm is the recorded precipitation for                  site. The features used as model inputs included antecedent
day m. PE accounts for the depleting earlier days precipitation                IF and precipitation. 80% of these data were assigned for
using a time-dependent reduction function. Moving on, once                     model training with 20% of the training data used for model
the PE is computed, it can be used to get the Available Water                  validation purposes. The remaining data were used for testing
Resource Index (AWRI ) [37]. The AWRI is obtained simply                       the model’s implementation. As there is no specific rule for

VOLUME 9, 2021                                                                                                                            50985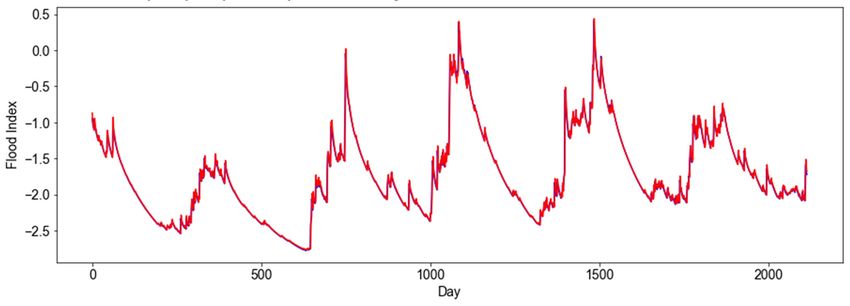
M. Moishin et al.: Designing Deep-Based Learning Flood Forecast Model With ConvLSTM Hybrid Algorithm

 FIGURE 2. Map of the Fiji Islands showing study sites where the ConvLSTM model was developed.

                                                                                TABLE 1. Results from statistical tests.

FIGURE 3. Daily Rainfall for the study site (Ba) over 1991 to 2019.

the splitting ratio, the study adopted 80% for training data                    Multi-Step Output model was determined to be the most
based on a study that used a similar ratio [47]. To verify                      suitable for this use case. The data were first structured to
this ratio, the effect of having 10%, 20% and 30% of data                       make them appropriate for Multiple Input Multi-Step Output
in the testing set was later compared. Upon comparison,                         supervised learning. Input feature set consisted of IF and P
all three ratios had relatively similar performance, and this                   at t − 1 and the target consisted of IF at t. After this, all
verified the adoption of 20% of data as testing data during                     variables in these data were scaled between [0, 1]. Scaling
the experiments.                                                                these data before running the model led to an improvement
   The ConvLSTM model type used for the experiment was                          in speed and accuracy during training and testing phases.
Multiple Input Multi-Step Output model [48]. As more than                       Next, the data were reshaped to the format to be accepted
one feature was to be used as input and the model had to                        by the predictive model. This shape was adjusted based on
forecast IF at multiple forecast horizons, the Multiple Input                   forecast horizon for which the model was being built for and

50986                                                                                                                                       VOLUME 9, 2021
M. Moishin et al.: Designing Deep-Based Learning Flood Forecast Model With ConvLSTM Hybrid Algorithm
TABLE 2. Optimal parameters of the developed model. was a dense layer. As the inputs consisted of only two fea-
tures, this simple configuration was enough to achieve the
optimal model. Furthermore, a batch size of 100 was chosen,
with Adam as the optimizing algorithm.
Several statistical metrics were used for thorough eval-
uation of models developed in this study. These perfor-
mance metrics included Root Mean Squared Error (RMSE),
Pearson’s Correlation Coefficient (r), Mean Absolute Error
(MAE), Coefficient of Determination (r2 ), Willmott’s Index
(Index of Agreement; d), Nash-Sutcliffe Efficiency Index
(NSE), and Legate-McCabe Efficiency Index (LME). Apart
from Sci-Kit Learn, two other Python packages, HydroE-
val [49] and HydroErr [50] were used to apply these per-
formance metrics. The mathematical representation of these
metrics is presented from Equations 10 to 15, respectively.
s
Pn 2
i=1 (Si − Oi )
RMSE = (10)
n
Pn
i=1 (Oi − Ō)(Si − S̄)
r = q q (11)
Pn 2 Pn 2
i=1 (O i − Ō) i=1 (Si − S̄)
1 Xn
MAE = |Si − Oi | (12)
n i=0
Pn 2
TABLE 3. Architecture of the deep learning models. i=1 (Si − Oi )
d = 1− P 2
(13)
n
i=1 ( Si − Ō + Oi − Ō )
Pn
(Si − Oi )2
NSE = 1 − Pi=1 2
(14)
n
i=1 (Oi − Ō)
Pn
|Si − Oi |
LME = 1 − Pi=1 n (15)
i=1 |Oi − Ō|
where S is the forecasted value of IF , S̄ is the mean of the
forecasted values of IF , O is the observed value of IF and
Ō is the mean of the observed values of IF .
E. RESULTS
This section presents the results of performance evaluation
of AI-based models (ConvLSTM, CNN-LSTM, LSTM and
SVR) adopted to forecast future flood situations in Fiji,
and these are shown for different flood forecasting periods
(i.e., 1-day, 3-day, 7-day, and 14-day). The evaluation results
the number of lagged days considered. Once the data was from four forecast horizons and nine study sites expectedly
prepared, the models were trained using different combina- verifies the robustness of the objective ConvLSTM model in
tions of hyperparameters. These combinations of parameters forecasting future flood situations. The results are aggregated
were adjusted manually until the most optimal set of hyper- to enable the paper to deliver an extensive comparative out-
parameters were attained. As the same set of parameters were come for all locations and forecast horizons.
the most optimal for all sites and horizons, this assisted in a To begin with, the results from the nine sites were averaged
more effective comparison of the performance of the models so that the performance of the models can be easily compared.
at different forecast horizons. The performance evaluation of the models using RMSE and
Table 2 presents optimal parameters of all models. MAE is presented in Table 4. It can be clearly seen from
Table 3 shows the architecture of deep learning models. this table that ConvLSTM demonstrated the minimum errors
The objective model, ConvLSTM consisted of three feature when compared with the benchmark models for all the four
layers. The first was a ConvLSTM2D layer with 128 filters forecast horizons. In addition, as expected, the error measure
and rectified linear unit (ReLU) as the activation function. increases as the forecasting period increases. For instance,
The second layer was a flattening layer, and the final layer the average RMSE for 1-day forecasting using ConvLSTM
VOLUME 9, 2021 50987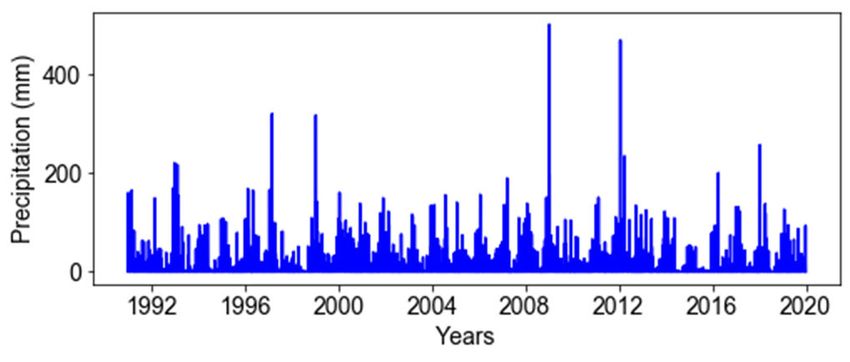
M. Moishin et al.: Designing Deep-Based Learning Flood Forecast Model With ConvLSTM Hybrid Algorithm

TABLE 4. The performance of ConvLSTM with benchmark models in                 TABLE 5. Comparing the performance of ConvLSTM with the benchmark
terms of average RMSE and MAE for nine sites for 1-day, 3-day, 7-DAY,         models in terms of LME for Rakiraki site for 1-day, 3-day, 7-DAY, and
and 14-day flood forecasting.                                                 14-day flood forecasting.

FIGURE 4. The performance of ConvLSTM with benchmark model in terms
of average LME for nine sites for 1-day, 3-day, 7day and 14-day Flood
Forecasts.

was 0.101, whereas for 14-days, it was 0.279. Similar trend is
seen with MAE. Therefore, based on RMSE and MAE mea-
sures, the performance of ConvLSTM for flood forecasting
is the optimal. This is followed by LSTM, CNN-LSTM and
SVR.
   In accordance with Equation (15) LME was used to eval-
uate the accuracy of models. Figure 4 illustrates average
LME for all sites at all forecast horizons. Again, these results              FIGURE 5. Evaluating the performance of ConvLSTM using average r, NSE
                                                                              and d values for 1-day, 3-day, 7-day and 14-day Flood Forecasting.
clearly demonstrated the better performance of ConvLSTM.
The performance of the objective model is significantly better
than the other models for all the forecast horizons. However,
like error measures, the accuracy of all the models decrease                  model performances are similar with non-aggregated data.
as the forecast horizons is extended to 14-days. Also, after                  This table shows similar trends in performance as with the
ConvLSTM, the best performing models in terms of LME                          aggregated data whereby ConvLSTM performs the best for
were LSTM, CNN-LSTM and SVR, respectively. As seen                            all forecast horizons, followed by LSTM, CNN-LSTM and
in Figure 4, for the benchmark models, LSTM and CNN-                          SVR. Also, as the forecast horizons increases, the perfor-
LSTM’s performance were reasonable but the performance                        mance accuracy drops. As the trends and measures with the
of SVR was below 0.5 for all the forecast horizons.                           non-aggregated data is close to the aggregated data, it verifies
   In addition to the results from the aggregated data being                  the use of aggregated data when presenting the performance
used to show the show the performance of the four algo-                       evaluation results.
rithms at the four forecast horizons, the LME analysis for                       Based on the previous results, it can be clearly established
Rakiraki site is presented in Table 5 to compare if the                       that ConvLSTM performs the best out of the four models.

50988                                                                                                                                     VOLUME 9, 2021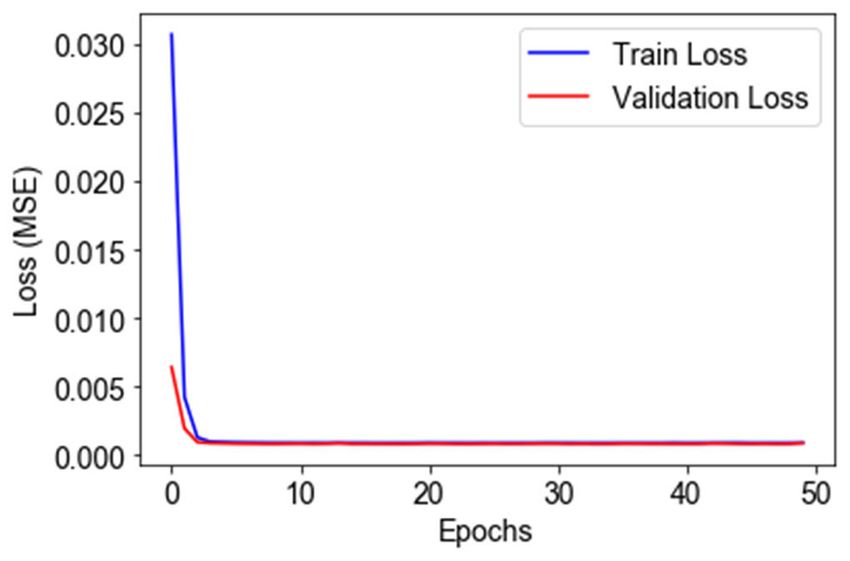
M. Moishin et al.: Designing Deep-Based Learning Flood Forecast Model With ConvLSTM Hybrid Algorithm
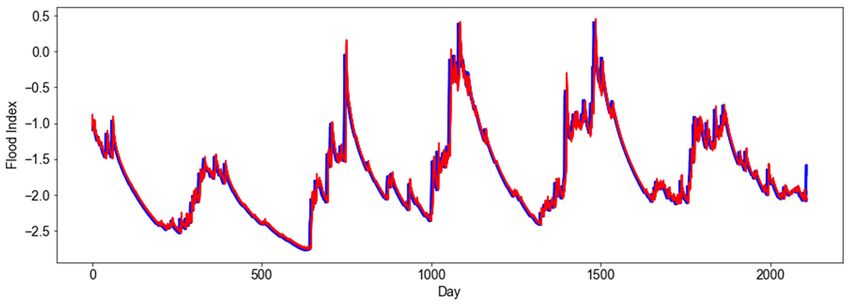
FIGURE 6. (a) Actual versus 1 -day forecasted IF for Ba Site using ConvLSTM. (b) Actual versus 3-day forecasted IF for Ba Site
using ConvLSTM. (c) Actual versus 7 -day forecasted IF for Ba Site using ConvLSTM. (d) Actual versus 14 -day forecasted IF for Ba
Site using ConvLSTM.
VOLUME 9, 2021 50989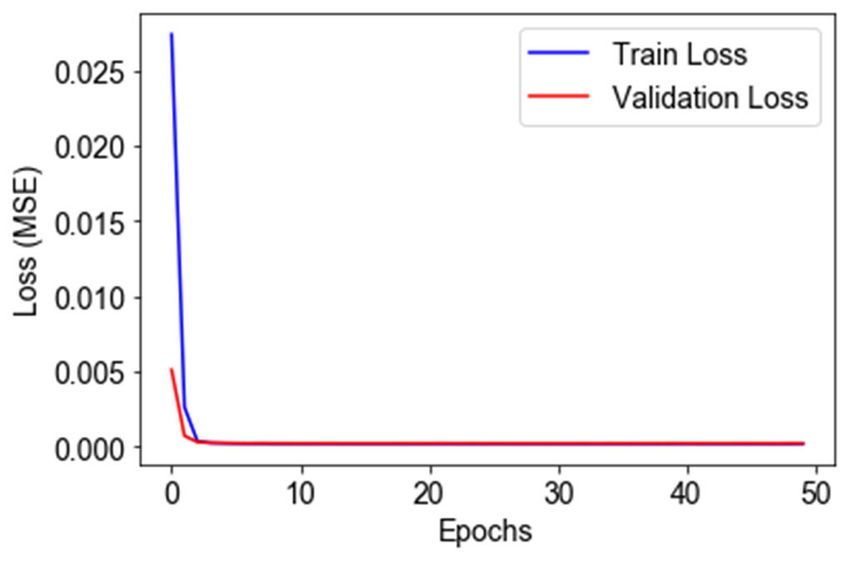
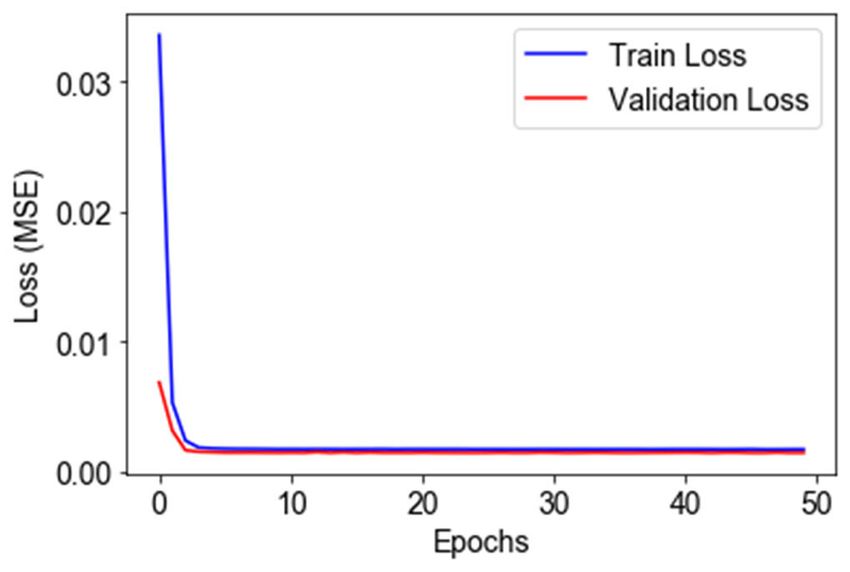
M. Moishin et al.: Designing Deep-Based Learning Flood Forecast Model With ConvLSTM Hybrid Algorithm

 FIGURE 7. (a) Model Loss for 1 -Day IF Forecasting using ConvLSTM for Ba Site. (b) Model Loss for 3-Day IF Forecasting using ConvLSTM for Ba Site.
 (c) Model Loss for 7 -Day IF Forecasting using ConvLSTM for Ba Site. (d) Model Loss for 14 -Day IF Forecasting using ConvLSTM for Ba Site.

Next, r, NSE and d were used to further evaluate the per-                     As seen in these figures, the models achieve minimum train-
formance of ConvLSTM for flood forecasting. As seen                           ing and validation losses in less than 5 epochs. This is poten-
in Figure 5, for all the forecast horizons, the measures of r,                tially due to only two features being used for the forecasting
NSE and d were greater than 0.93, 0.85 and 0.95, respectively.                task. This further affirms the results, which showed good
This clearly shows that ConvLSTM can be used to forecast                      performance of the ConvLSTM model. Despite having only
IF at longer timescales without a significant impact on its                   two input features, the proposed hybrid deep learning IF
performance. Considering that only two features are used                      forecasting model, i.e., ConvLSTM, provided very good fore-
for building the forecasting model, these results illustrated                 casting performances at four forecasting horizons that can
the good performance of the model despite the usage of few                    serve as the core of an early flood warning system.
variables.
   Moving on, Figures 6 a-d shows the graphical view of                       F. DISCUSSION
1-day, 3-day, 7-day, and 14-day IF forecasting using testing                  The results presented in the previous section illustrate the
results from Ba site and ConvLSTM algorithm. This view                        feasibility of the ConvLSTM based I F forecasting model to
assists in understanding how close the forecasted values of IF                determine the possibility of flood situations at 1, 3, 7 and
are with the actual values. As the forecast horizons increase,                14 day ahead forecast horizons. In this section, the limita-
the difference in the forecasted and actual values of IF                      tions, restrictions, and recommendations for future research
also increased. However, even with this increase, the graphs                  regarding the proposed flood forecast system is presented.
clearly illustrate that the forecasted results are very close to                 To begin with, one of the major limitations of this study
the actual IF for all the forecast horizons.                                  is that the predictive model that was developed during this
   Finally, the model loss in terms of Mean Squared Error                     research only used two input features. Even though, only
(MSE) during training and validation of the ConvLSTM                          two features were used, good forecasting performance was
for 1-day, 3-day, 7-day and 14-day flood forecasting using                    achieved, it is expected that adding more useful features as
data from Ba site is presented in Figures 7 a-d, respectively.                input will assist in developing a more robust model with

50990                                                                                                                                    VOLUME 9, 2021
M. Moishin et al.: Designing Deep-Based Learning Flood Forecast Model With ConvLSTM Hybrid Algorithm

better forecasting accuracy at extended forecast horizons. It is               for flood situations and therefore saving lives and protecting
recommended in future studies, that the model is enhanced by                   infrastructure resources.
identifying and applying additional relevant features.
   Another limitation of the study is in terms of the I F . I F has            ACKNOWLEDGMENT
been previously applied in Fiji and has shown suitability as a                 Mohammed Moishin is an Australia Awards Scholar sup-
means of quantifying floods [7]. Therefore, it was acceptable                  ported by the Australian Government. He is grateful to the
to develop I F based forecasting system for Fiji. However, for                 Australian Department of Foreign Affairs and Trade for
areas where the suitability of I F has not been established yet,               funding this study through the Australia Awards Scholar-
the forecasting method presented in this paper may not be                      ship scheme 2020–2021. Disclaimer: The views and opinions
appropriate for those areas. It is recommended that during the                 expressed in this article are those of the authors and do
application of the proposed method in new study areas the                      not represent the views of the Australian Government. The
suitability of I F for that location should be evaluated before                authors would like to thank Fiji Meteorological Service for
the development of the forecasting model.                                      providing the rainfall data required for this project.
   Furthermore, another limitation is in terms of applying the
proposed model at the study site for regular flood forecasting.
                                                                               REFERENCES
Even though it is expected that the model can be easily
incorporated into the workflow replacing classical forecast-                    [1] P. Brown, A. Daigneault, and D. Gawith, ‘‘Climate change and the eco-
                                                                                    nomic impacts of flooding on fiji,’’ Climate Develop., vol. 9, no. 6,
ing techniques, the major challenge surrounding this would                          pp. 493–504, Sep. 2017, doi: 10.1080/17565529.2016.1174656.
be regularly obtaining accurate data and finding expertise to                   [2] S. W. Yeo and R. J. Blong, ‘‘Fiji’s worst natural disaster: The
implement these advanced techniques in the relevant organi-                         1931 hurricane and flood,’’ Disasters, vol. 34, no. 3, pp. 657–683,
                                                                                    Jul. 2010.
zations. Therefore, it is recommended that in future research                   [3] R. C. Deo, H.-R. Byun, J. F. Adamowski, and D.-W. Kim, ‘‘A real-
more user-friendly tools for flood forecasting be developed                         time flood monitoring index based on daily effective precipitation and its
and other deep learning and machine learning algorithms be                          application to brisbane and lockyer valley flood events,’’ Water Resour.
                                                                                    Manage., vol. 29, no. 11, pp. 4075–4093, Sep. 2015, doi: 10.1007/s11269-
tested for I F forecasting. The results from this research can                      015-1046-3.
be set as a comparison benchmark for the newly build models.                    [4] H.-R. Byeon and J.-S. Jeong, ‘‘Quantified diagnosis of flood possibility by
                                                                                    using effective precipitation index,’’ J. Korea Water Resour. Assoc., vol. 31,
                                                                                    no. 6, pp. 657–665, 1998.
V. CONCLUSION
                                                                                [5] R. C. Deo, H. R. Byun, J. F. Adamowski, and D. W. Kim, ‘‘Diagnosis of
In this paper, a hybrid deep learning based flood forecasting                       flood events in Brisbane (Australia) using a flood index based on daily
approach was presented. This novel approach made use of                             effective precipitation,’’ in Proc. Int. Conf., Anal. Manage. Changing Risks
daily lagged IF and precipitation time series data to determine                     Natural Hazards, Eur. Commission, 7th Framework Programme, Marie
                                                                                    Curie Actions, 2014, p. AP20-1.
flood situations at multiple forecast horizons. The practicality                [6] R. C. Deo, J. F. Adamowski, K. Begum, S. Salcedo-Sanz, D.-W. Kim,
of the model was tested using datasets from nine locations in                       K. S. Dayal, and H.-R. Byun, ‘‘Quantifying flood events in Bangladesh
Fiji. Among the deep learning models evaluated, ConvLSTM,                           with a daily-step flood monitoring index based on the concept of
                                                                                    daily effective precipitation,’’ Theor. Appl. Climatol., vol. 137, nos. 1–2,
which was the objective model showed the best performance.                          pp. 1201–1215, Jul. 2019, doi: 10.1007/s00704-018-2657-4.
The following are the main contributions of this paper:                         [7] M. Moishin, R. C. Deo, R. Prasad, N. Raj, and S. Abdulla, ‘‘Development
   1. This research was the first to use IF with a hybrid deep                      of flood monitoring index for daily flood risk evaluation: Case studies in
                                                                                    fiji,’’ Stochastic Environ. Res. Risk Assessment, pp. 1–16, Oct. 2020, doi:
       learning algorithm to develop an AI-based model for                          10.1007/s00477-020-01899-6.
       flood forecasting.                                                       [8] K. Nosrati, M. M. Saravi, and A. Shahbazi, ‘‘Investigation of flood event
   2. The robustness of the objective model, ConvLSTM, was                          possibility over Iran using flood index,’’ in Survival and Sustainability.
       presented during this research whereby it illustrated                        Cham, Switzerland: Springer, 2010, pp. 1355–1361.
                                                                                [9] A. Duncan, A. S. Chen, E. Keedwell, S. Djordjevic, and D. Savic, ‘‘Urban
       better performance when compared with deep learning                          flood prediction in real-time from weather radar and rainfall data using
       (LSTM and CNN-LSTM) and machine learning models                              artificial neural networks,’’ in Proc. Weather Radar Hydrol. Int. Symp.
       (SVR) for 1-day, 3-day, 7-day and 14-day flood situa-                        (WRAH). Exeter, U.K.: Univ. Exeter, Apr. 2011.
                                                                               [10] Y. LeCun, Y. Bengio, and G. Hinton, ‘‘Deep learning,’’ Nature, vol. 521,
       tion forecasting using datasets from nine sites.                             pp. 436–444, May 2015.
   3. Using various statistical score metrics, the accuracy of                 [11] S. Hochreiter and J. Schmidhuber, ‘‘Long short-term memory,’’ Neural
       the model for multi-step flood situation forecasting was                     Comput., vol. 9, no. 8, pp. 1735–1780, 1997.
       clearly established.                                                    [12] A. Graves, ‘‘Long short-term memory,’’ in Supervised Sequence Labelling
                                                                                    With Recurrent Neural Networks. Cham, Switzerland: Springer, 2012,
   4. The application of the model at various sites in Fiji                         pp. 37–45.
       illustrated the practicality of the approach in accurately              [13] K.-C. Miao, T.-T. Han, Y.-Q. Yao, H. Lu, P. Chen, B. Wang, and J.
       forecasting floods at multiple timescales in a cost-                         Zhang, ‘‘Application of LSTM for short term fog forecasting based
                                                                                    on meteorological elements,’’ Neurocomputing, vol. 408, pp. 285–291,
       effective manner.                                                            Sep. 2020.
   To conclude, the approach presented in this paper could be                  [14] D. Soutner and L. Müller, ‘‘Application of LSTM neural networks in
further enhanced to forecast flood situations at hourly time                        language modelling,’’ in Proc. Int. Conf. Text, Speech Dialogue. Cham,
                                                                                    Switzerland: Springer, 2013, pp. 105–112.
scales. Accurate forecasting at shorter timescales is expected
                                                                               [15] C. Hu, Q. Wu, H. Li, S. Jian, N. Li, and Z. Lou, ‘‘Deep learning with a long
to result in more time for informed decision making by gov-                         short-term memory networks approach for rainfall-runoff simulation,’’
ernments, organizations, and individuals to be better prepared                      Water, vol. 10, no. 11, p. 1543, Oct. 2018.

VOLUME 9, 2021                                                                                                                                             50991
M. Moishin et al.: Designing Deep-Based Learning Flood Forecast Model With ConvLSTM Hybrid Algorithm
[16] T.-Y. Kim and S.-B. Cho, ‘‘Predicting residential energy consump- [38] M. F. Sanner, ‘‘Python: A programming language for software integration
tion using CNN-LSTM neural networks,’’ Energy, vol. 182, pp. 72–81, and development,’’ J. Mol. Graph Model., vol. 17, no. 1, pp. 57–61, 1999.
Sep. 2019. [39] A. Boschetti and L. Massaron, Python Data Science Essentials. Birming-
[17] Y. Liu, H. Zheng, X. Feng, and Z. Chen, ‘‘Short-term traffic flow predic- ham, U.K.: Packt, 2015.
tion with conv-LSTM,’’ in Proc. 9th Int. Conf. Wireless Commun. Signal [40] F. Pedregosa, G. Varoquaux, A. Gramfort, V. Michel, B. Thirion, O. Grisel,
Process. (WCSP), Oct. 2017, pp. 1–6. M. Blondel, P. Prettenhofer, R. Weiss, V. Dubourg, J. Vanderplas,
[18] S. Xingjian, Z. Chen, H. Wang, D.-Y. Yeung, W.-K. Wong, and A. Passos, D. Cournapeau, M. Brucher, M. Perrot, and E. Duchesnay,
W.-C. Woo, ‘‘Convolutional LSTM network: A machine learning ‘‘Scikit-learn: Machine learning in Python,’’ J. Mach. Learn. Res., vol. 12,
approach for precipitation nowcasting,’’ in Proc. Adv. Neural Inf. Process. pp. 2825–2830, Oct. 2011.
Syst., 2015, pp. 802–810. [41] M. Abadi et al., ‘‘Tensorflow: A system for large-scale machine learning,’’
[19] B. Faulkner, ‘‘Practical applications of the standardised precipitation index in Proc. 12th USENIX Symp. Oper. Syst. Design Implement. (OSDI), 2016,
(SPI) as a tool for very early warning of droughts and floods in the Balkans pp. 265–283.
region,’’ in Proc. EGU General Assembly Conf. Abstr., vol. 18, 2016, p. 1. [42] N. Ketkar, ‘‘Introduction to Keras,’’ in Deep Learning With Python. Cham,
[20] M. Campolo, P. Andreussi, and A. Soldati, ‘‘River flood forecasting with a Switzerland: Springer, 2017, pp. 97–111.
neural network model,’’ Water Resour. Res., vol. 35, no. 4, pp. 1191–1197, [43] S. Ghimire, R. C. Deo, N. Raj, and J. Mi, ‘‘Deep solar radiation forecasting
Apr. 1999. with convolutional neural network and long short-term memory network
[21] P. C. Nayak, K. P. Sudheer, D. M. Rangan, and K. S. Ramasastri, ‘‘Short- algorithms,’’ Appl. Energy, vol. 253, Nov. 2019, Art. no. 113541.
term flood forecasting with a neurofuzzy model,’’ Water Resour. Res., [44] R. D’Agostino and E. S. Pearson, ‘‘Tests for √ departure from normality.
vol. 41, no. 4, pp. 1–16, Apr. 2005. Empirical results for the distributions of b2 and b1,’’ Biometrika, vol. 60,
[22] D. Han, L. Chan, and N. Zhu, ‘‘Flood forecasting using support vector no. 3, pp. 613–622, 1973.
machines,’’ J. Hydroinformatics, vol. 9, no. 4, pp. 267–276, Oct. 2007. [45] Y.-W. Cheung and K. S. Lai, ‘‘Lag order and critical values of the
[23] M. Sit and I. Demir, ‘‘Decentralized flood forecasting using deep augmented dickey-fuller test,’’ J. Bus. Econ. Statist., vol. 13, no. 3,
neural networks,’’ 2019, arXiv:1902.02308. [Online]. Available: pp. 277–280, 1995.
http://arxiv.org/abs/1902.02308 [46] R. Prasad, L. Joseph, and R. C. Deo, ‘‘Modeling and forecasting
[24] Q.-K. Tran and S.-K. Song, ‘‘Water level forecasting based on deep learn- renewable energy resources for sustainable power generation: Basic con-
ing : A use case of trinity river-texas-the United States,’’ J. KIISE, vol. 44, cepts and predictive model results,’’ in Translating the Paris Agree-
no. 6, pp. 607–612, Jun. 2017. ment Into Action in the Pacific. Cham, Switzerland: Springer, 2020,
[25] V. V. Krzhizhanovskaya, G. S. Shirshov, N. B. Melnikova, R. G. Belleman, pp. 59–79.
F. I. Rusadi, B. J. Broekhuijsen, B. P. Gouldby, J. Lhomme, B. Balis, [47] F. K. Boadu, ‘‘Rock properties and seismic attenuation: Neural net-
M. Bubak, A. L. Pyayt, I. I. Mokhov, A. V. Ozhigin, B. Lang, and work analysis,’’ Pure Appl. Geophysics, vol. 149, no. 3, pp. 507–524,
R. J. Meijer, ‘‘Flood early warning system: Design, implementation and Jun. 1997.
computational modules,’’ Procedia Comput. Sci., vol. 4, pp. 106–115, [48] J. Brownlee. How to Develop LSTM Models for Time Series
Jan. 2011. Forecasting. Accessed: Feb. 17, 2021. [Online]. Available:
[26] E. Lu, ‘‘Determining the start, duration, and strength of flood and drought https://machinelearningmastery.com/how-to-develop-lstm-models-
with daily precipitation: Rationale,’’ Geophys. Res. Lett., vol. 36, no. 12, for-time-series-forecasting/
pp. 1–5, 2009, doi: 10.1029/2009gl038817. [49] T. Hallouin, ‘‘ThibHlln/hydroeval: General enhancements,’’ Hydroeval,
[27] R. C. Deo, H.-R. Byun, J. F. Adamowski, and D.-W. Kim, ‘‘A real- Zenodo, Tech. Rep., 2019, doi: 10.5281/zenodo.2591217.
time flood monitoring index based on daily effective precipitation and its [50] W. Roberts, G. P. Williams, E. Jackson, E. J. Nelson, and D. P. Ames,
application to brisbane and Lockyer valley flood events,’’ Water. Resour. ‘‘Hydrostats: A Python package for characterizing errors between
Manag., vol. 29, no. 11, pp. 4075–4093, 2015. observed and predicted time series,’’ Hydrology, vol. 5, no. 4, p. 66,
[28] R. C. Deo, H.-R. Byun, G.-B. Kim, and J. F. Adamowski, ‘‘A real-time Dec. 2018.
hourly water index for flood risk monitoring: Pilot studies in Brisbane,
Australia, and Dobong Observatory, South Korea,’’ Environ. Monitor.
Assessment, vol. 190, no. 8, p. 450, Aug. 2018. MOHAMMED MOISHIN received the bache-
[29] J. R. Medel, ‘‘Anomaly detection using predictive convolutional long short lor’s degree in software engineering from The
term memory units,’’ M.S. thesis, Univ. Rochester Inst. Technol., Tech. University of the South Pacific, Fiji, in 2019.
Rep., Nov. 2016. He is currently pursuing the Master of Science
[30] X. H. Le, H. V. Ho, G. Lee, and S. Jung, ‘‘Application of long short-term Research degree with the Advanced Data Ana-
memory (LSTM) neural network for flood forecasting,’’ Water, vol. 11, lytics Group, School of Sciences, University of
no. 7, 2019. Southern Queensland–Springfield, Australia. His
[31] I. E. Livieris, E. Pintelas, and P. Pintelas, ‘‘A CNN-LSTM model for research interests include flood risk mitigation,
gold price time-series forecasting,’’ Neural Comput. Appl., vol. 32, no. 23, artificial intelligence and machine learning, and
pp. 17351–17360, 2020. software development.
[32] H. Drucker, C. J. Burges, L. Kaufman, A. J. Smola, and V. Vapnik,
‘‘Support vector regression machines,’’ in Proc. Adv. Neural Inf. Process.
RAVINESH C. DEO (Senior Member, IEEE) is
Syst., 1997, pp. 155–161.
currently a Professor with research interests in
[33] V. Sutton, ‘‘Fiji: Climate change, tradition and Vanua,’’ in Climate Change
artificial intelligence and deep learning. He was
and Indigenous Peoples. Cheltenham, U.K.: Edward Elgar Publishing,
awarded internationally competitive Queensland
2013.
Smithsonian, JSPS, Chinese Academy, Australia-
[34] J. Feresi, G. J. Kenny, N. de Wet, L. Limalevu, J. Bhusan, and I. Ratukalou,
‘‘Climate change vulnerability and adaptation assessment for Fiji,’’ Int. India Strategic Fellowship, and Endeavour Fel-
Global Change Inst., Univ. Waikato., Hamilton, New Zealand, Tech. lowships and supervised 20 Ph.D./M.Sc. degrees,
Rep., 2000. received employee excellence awards, Faculty
[35] S. McGree, S. W. Yeo, and S. Devi, ‘‘Flooding in the Fiji Islands Research Excellence, Elsevier Highly Cited Paper,
between 1840 and 2009,’’ Risk Frontiers, pp. 1–69, Oct. 2010, doi: Publication Excellence, and Teaching Commen-
10.13140/RG.2.2.24364.67202. dation. He is also an academic and industry mentor through grants worth
[36] (2019). MATLAB. [Online]. Available: https://au.mathworks. $2.6M and services editorial boards of Stochastic Environmental Research
com/products/matlab.html and Risk Assessment, IEEE ACCESS, Remote Sensing, Energies, and Jour-
[37] H.-R. Byun and D.-K. Lee, ‘‘Defining three rainy seasons and nal of Hydrologic Engineering. He has published 220 articles, including
the hydrological summer monsoon in Korea using available water 150 journals (85% Quartile 1), and six books in Elsevier, Springer, IGI, with
resources index,’’ J. Meteorological Soc. Jpn., vol. 80, no. 1, pp. 33–44, 23 Book Chapters. His work has cumulative citations exceeding 6200 with
2002. an H-index 43.
50992 VOLUME 9, 2021M. Moishin et al.: Designing Deep-Based Learning Flood Forecast Model With ConvLSTM Hybrid Algorithm
RAMENDRA PRASAD received the B.Sc. degree SHAHAB ABDULLA is currently a Senior
in mathematics and physics and the M.Sc. degree Lecturer of (Mathematics/Communication). His
in physics from The University of the South interdisciplinary interests include artificial intelli-
Pacific, Fiji, and the Ph.D. degree in modeling gence models and bioinformatics (health, energy,
and simulations from the University of Southern biomedical, control systems, control science,
Queensland, Australia, in 2019. Since 2018, he has and sustainable agriculture) under these Codes
been a Lecturer with The University of Fiji. He has (0103) Numerical and Computational Mathemat-
authored 15 articles in peer-reviewed journals and ics, (0502) Environmental Science and Man-
reputed conferences. His research interests include agement, (0701) Agriculture, (01) Mathematical
advanced machine learning approaches, data ana- Sciences, and (08) Information and Computing
lytics, hydrological modeling, energy modeling, energy management, envi- Sciences. Designing expert systems to his research interests, including
ronmental, atmospheric modeling, and ocean wave modeling. deep learning, convolutional neural, and long- short-term memory net-
works. His leadership was recognized by many awards. He has served on
several committees. He was the Chair of IEEE conference. He collabo-
rates with researchers in Middle East, USA, Japan, Europe, China, and
Canada, delivered over 30 seminars. In last three years, his articles were
NAWIN RAJ received the B.Sc., B.Ed., PGDMA, cited more than 200 times. With more than 25 publications (largely in
and M.Sc. degrees in computational fluid dynam- Q1 journals), he leads the Advanced Data Analytics Modeling Research
ics from The University of the South Pacific, and Simulation Group, as a Principal Supervisor and an Associate Supervisor of
the Ph.D. degree from the University of South- more than ten Ph.D./master’s/HDR students. He has supervised more than
ern Queensland, Australia, in 2015. From 2007 to five Ph.D./master’s thesis/dissertations and examined a number of theses
2010, he was a Lecturer with Fiji National Uni- locally and overseas.
versity. He is currently a Lecturer with USQ. His
research interests include artificial intelligence,
deep learning, non-linear oscillation, computa-
tional fluid dynamics, and oceanography. He is
also a member of the Australian Mathematical Society and the Queensland
College of Teachers.
VOLUME 9, 2021 50993You can also read