Polynomial Texture Maps - Tom Malzbender, Dan Gelb, Hans Wolters
←
→
Page content transcription
If your browser does not render page correctly, please read the page content below
Polynomial Texture Maps
                                      Tom Malzbender, Dan Gelb, Hans Wolters
                                                                                       1
                                                   Hewlett-Packard Laboratories
                                                    http://www.hpl.hp.com/ptm

                Figure 1: Top: Lighting changes across a polynomial texture map, bottom: across a conventional texture map.

Abstract                                                                1    Introduction
In this paper we present a new form of texture mapping that             Polynomial Texture Mapping enables greatly improved realism
produces increased photorealism. Coefficients of a biquadratic          over conventional methods. Traditional texture mapping is used to
polynomial are stored per texel, and used to reconstruct the            give the impression of geometric detail in a model using an image.
surface color under varying lighting conditions. Like bump              For example, a photograph of a brick wall may be used as a
mapping, this allows the perception of surface deformations.            texture map on a planar surface to avoid modeling the complex
However, our method is image based, and photographs of a                surface detail of the brick. However, if the lighting in the
surface under varying lighting conditions can be used to construct      synthetic environment where the texture map is used is different
these maps. Unlike bump maps, these Polynomial Texture Maps             from the lighting the texture map was captured under, the
(PTMs) also capture variations due to surface self-shadowing and        resulting rendering will appear incorrect and unrealistic. Worse
interreflections, which enhance realism. Surface colors can be          yet, when the texture is blended with the calculated lighting of a
efficiently reconstructed from polynomial coefficients and light        geometric surface, the resulting rendering will look very flat and
directions with minimal fixed-point hardware. We have also              smooth to the viewer.
found PTMs useful for producing a number of other effects such
as anisotropic and Fresnel shading models and variable depth of         Bump mapping [Blinn 78] is one proposed solution to this
focus. Lastly, we present several reflectance function                  problem where the surface normals of underlying geometry are
transformations that act as contrast enhancement operators. We          allowed to vary per texture element (texel). Introducing variations
have found these particularly useful in the study of ancient            in the surface normals causes the lighting method to render the
archeological clay and stone writings.                                  surface as though it had local surface variations instead of just a
                                                                        smooth surface. As a result, when the light is moved around the
CR Categories: I.3.3 [Computer Graphics]: Picture/Image                 object, highlights appear due to the bump map and the surface
Generation; I.3.7 [Computer Graphics] Three-Dimensional                 appears to be rough, grooved or similarly modified as desired.
Graphics and Realism - Color, shading, shadowing and texture;           Bump maps can be either hand modeled or, more typically,
I.4.1 [Image Processing and Computer Vision] Digitization and           calculated procedurally. Creating a bump map to be used with real
Image Capture - Reflectance                                             world textures from photographs is generally difficult. Methods
                                                                        have been developed that attempt to automatically generate bump
Keywords: Graphics Hardware, Illumination, Image Processing,            maps from a set of input images under known light directions
Image-Based Rendering, Reflectance & Shading Models, Texture            [Rushmeier 97]. These methods have difficulty with generating
Mapping                                                                 bump maps for objects with large surface variations that cause
                                                                        self-shadowing and intra-object interreflections. In addition,
1
    {malzbend,dgelb,wolters}@hpl.hp.com                                 current bump map rendering techniques do not render shadows
                                                                        due to surface variation or brightened regions due to
                                                                        interreflections.

                                                                        In contrast, our method is an image-based technique that requires
                                                                        no modeling of complex geometry or bump maps. The input data
                                                                        required is a set of images of the desired object to be used as a
                                                                        texture, each one under illumination from a different known
                                                                        direction, all captured from the same view point. The input light
directions need not be uniformly spaced in the hemispherical set        for a static scene, in particular human faces for those references.
of possible light directions. We choose to represent the variation      In our work we advocate polynomial models for these reflectance
in surface color for each pixel independently with a simple             functions and their application in real-time rendering as texture
biquadratic       polynomial.     Although      approximate,   this     maps. The per pixel reflectance maps that we collect have the
representation is compact and allows fast color reconstruction          following dependence,
during rendering. One implementation of our method uses a
polynomial to approximate the luminance of each texel, keeping                                  I r,g,b(Θi , Φi ,u,v)                   (3)
the chromaticity constant. The result of our method is a texture
map that properly reproduces the effects of variations in the
illuminant direction relative to the object, whether due to the         namely two spatial coordinates u,v and two parameters, Θi , Φi
surface orientation of the texture-mapped object, or to changing of     encoding the direction of the incident illumination. By not
the location of the source. Intensity and color variations that are     including the exitant direction dependence, we sacrifice the ability
also due to self shadowing, sub-surface scattering and                  to capture view dependent effects such as specularity, but retain
interreflections are also captured and modeled by PTMs. Figure 1        the ability to represent arbitrary geometric shadowing and diffuse
compares our method to conventional texture mapping as lighting         shading effects across a surface. For the remainder of the paper,
varies. Renderings using our method are very realistic, and require     we assume that the surfaces being photographed are either diffuse,
little or no user input once the input images are acquired.             or their specular contributions have been separated out through
                                                                        the use of polarizers on both the light sources and cameras
                                                                        [Debevec 00]. Although the acqusition methodology we will
2    Background and Previous Work                                       present is limited to diffuse objects, PTMs can be used to render
                                                                        specular as well as diffuse effects. This is described in Section
                                                                        3.5.
The characterization of surface reflectance properties is essential
to achieving photorealistic renderings. The Bidirectional               Other image-based relighting methods have been developed that
Reflectance Distribution Function [Nicodemus 77] characterizes          also allow a scene to be rendered under novel lighting conditions,
the color of a surface as a function of incident light (Θi, Φi) and     based on a set of input images acquired under known illuminants.
exitant view (Θe, Φe) directions.                                       These methods take advantage of the linearity of light to generate
                                                                        output renderings. [Nimeroff 94] and [Teo 97] showed how basis
                     BRDF(Θi, Φi, Θe, Φe, λ)                     (1)    images can be linearly combined to generate rerendered synthetic
                                                                        scenes. [Nishino 99] describes a method where input range and
The BRDF is the ratio of the reflected intensity in the exitant         color images are compressed in eigenspace. Images under novel
direction to the incident energy per unit area along the incident       lighting conditions are generated by interpolating in eigenspace
direction. It does contain a dependence on wavelength, λ, but in        and subsequent mapping from eigenspace into image space.
practice this is often approximated by independent BRDFs per            [Wood 00] applies surface light fields inferred from photographs
color channel. [Marschner 99] presents an efficient method of           and laser range scans to generate view dependent effects.
collecting BRDFs from samples of curved surfaces with uniform           [Georghiades 99] applies image-based relighting to real human
reflectance properties. There have been a large number of               faces, adding the constraint that the surface reflectance is
techniques developed to accurately and compactly represent the          Lambertian to eliminate the requirement that the input lighting
4D (per discrete wavelength) BRDF. These include linear basis           conditions are known. [Debevec 00] is able to render faces with
functions such as spherical harmonics [Cabral 87], [Sillion 91],        more general reflectance functions after acquiring a large number
[Wong 97], physically based analytic models [He 91], [Stam 99],         of images under known lighting. Employing high dynamic range
and empirical models [Phong 75], [LaFortune 97].                        imaging, this method is extended to render arbitrary objects under
                                                                        novel illumination conditions. [Wong 97] creates a 6D image-
[Dana 99] defines the Bidirectional Texture Function (BTF) by           based representation, an extension to [Levoy 96][Gortler 96], to
allowing the BRDF to vary spatially across a surface                    render objects with novel lighting from new viewpoints. [Epstein
parameterized by u,v.                                                   95] points out that low dimensional lighting models are adequate
                                                                        to model many objects, a result confirmed in this work as well as
                   BTFr,g,b(Θi , Φi ,Θe , Φe ,u,v)               (2)    [Ramamoorthi 01].

The BTF as defined by [Dana 99] does not actually store the ratio
of exitant to incident energy like the BRDF. Instead, the BTF           3     Polynomial Texture Maps
captures the pre-integrated lighting condition for a particular light
source. They provide samples of the BTF from photographs, but           3.1 Photographic Acquisition of PTMs
face two difficulties due to the high dimensionality of the model.
First, each photograph of a texture patch can be seen spanning u,v,     As done by [Debevec 00], [Georghiades 99], [Epstein 96] and in
but only point sampling the remaining four dimensions.                  the field of photometric stereo in general, we collect multiple
Numerous photographs will be required to adequately sample this         images of a static object with a static camera under varying
space. Second, camera pose must be accurately calibrated to allow       lighting conditions. Figure 2 shows two devices we have
measurements across the viewing dimensions. We avoid these              constructed to assist with this process. The first is a simple once-
difficulties by holding two of these dimensions constant, namely        subdivided icosahedral template that assists in manually
the exitant direction. Each photograph now becomes a sample of a        positioning a light source in 40 positions relative to a sample.
2-dimensional space, and the need for camera calibration is
avoided entirely since the viewpoint does not change.

This is similar to the approach taken by both [Debevec 00] and
[Georghiades 99] where a per pixel reflectance model is acquired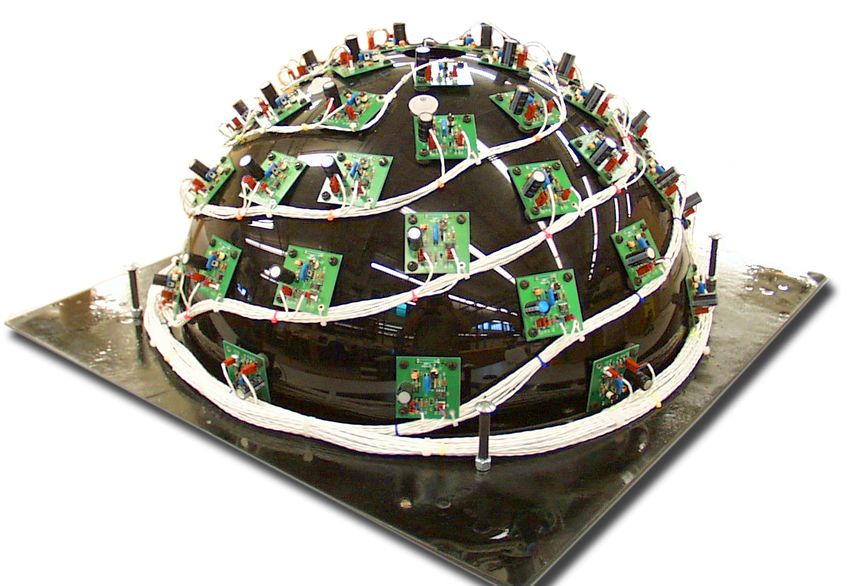
L(u,v;lu ,lv ) = a0(u,v)lu 2 + a1(u,v)lv 2 +
(5)
a2(u,v)lulv + a3(u,v)lu + a4(u,v)lv + a5(u,v)
where (lu,lv) are projections of the normalized light vector into the
local texture coordinate system (u,v) and L is the resultant surface
luminance at that coordinate. The local coordinate system is
defined per vertex, based on the normal and on the tangent and
binormal derived from the local texture coordinates. Coefficients
(a0-a5) are fit to the photographic data per texel and stored as a
spatial map referred to as a Polynomial Texture Map. Given N+1
images, for each pixel we compute the best fit in the L2 norm
using singular value decomposition (SVD) [Golub 89] to solve the
following system of equations for a0-a5.
lu20 lv20 lu 0lv 0 lu 0 lv 0 1 a0 L0
2
lu1 lv21 lu1lv1 lu1 lv1 1 a1 L1
= (6)
M M M M M M M M
2 2
luN lvN luN lvN luN lvN 1 a5 LN
Note that the SVD needs to be computed only once given an
arrangement of light sources and then can be applied per pixel.
The quadratic model proposed in Eq. 5 provides only an
approximate fit to the observed color values. Note however that
the resultant smoothing that occurs due to this approximation
manifests itself only across the space of light directions and does
not introduce any spatial blurring. This light space smoothing can
have the effect of muting sharp specularities, softening hard
Figure 2: Two devices for collecting PTMs. shadows and essentially changing point light sources to area
lights. However, arbitrarily high spatial frequencies in the original
Although very simple, this method is capable of achieving good source photographs are preserved. Furthermore, we have verified
results, such as the archeological samples shown later in the that the general shape of the function described by the input data
paper. The second device allows fully automated acquisition of 50 is well preserved. We have computed the root mean square error
source images, each illuminated with an individual strobe light over all the pixels, and obtained a maximum error of roughly 10
source. In both cases the camera (not shown) is mounted in the per 8-bit color channel for typical examples such as the seeds
apex of the dome and samples are placed on the floor. In this shown in Figure 1 using the RGB PTM described below. Figures
manner multiple registered images are acquired with varying light 5a-b and 6a-b show examples of a source photograph and a PTM
source direction. Note that since the camera is fixed we avoid the reconstruction for the same light direction. Note the minimal loss
need for any camera calibration or image registration. in quality.
3.2 Polynomial Color Dependence The representation just described is called an LRGB PTM since it
explicitly separates and models luminance per texel. We have
Interpolating these input images to create textures from arbitrary found that representing each color channel directly with a
light directions would be very costly both in memory and biquadratic polynomial is useful as well, especially for
bandwidth. For each texel in our texture map we would be applications where we are modeling variations of pixel color due
required to store a color sample for each input light position. One to other parameters besides incident lighting direction. We call
source of redundancy among these images is that the chromaticity this format an RGB PTM and a specific application is the depth of
of a particular pixel is fairly constant under varying light source focus PTMs described in Section 4.2.
direction; it is largely the luminance that varies. We take
advantage of this redundancy by computing an unscaled color per 3.3 Scale and Bias
texel (Rn(u,v),Gn(u,v),Bn(u,v)) that is modulated by a luminance
model, L(u,v) again dependent on the texel: The results of the fitting operation described above are six
floating-point coefficients per texel. We would like to store these
R(u,v) = L(u,v)Rn(u,v);
as 8 bit integers for evaluation speed and so that all polynomial
G(u,v) = L(u,v)Gn(u,v); (4) coefficients can be stored compactly. This is a non-trivial problem
since there are typically several orders of magnitude difference
B(u,v) = L(u,v)Bn(u,v); between high and low order coefficients. To eliminate this
We prefer this simple but redundant representation over color problem we store 6 scale (λ ) and bias (Ω) values with each PTM,
spaces such as LUV and YCbCr due to the low cost of evaluation, one for each coefficient. During reconstruction these values are
although we have implemented the method in these color spaces applied to the stored 8 bit coefficients, ai', to recover their final
as well. For diffuse objects, we have also found the dependence of values ai :
luminance on light direction to be very smooth, even for very ai = λ(ai '− Ω) (7)
textured objects with high spatial frequencies. We choose to
model this dependence with the following biquadratic per texel: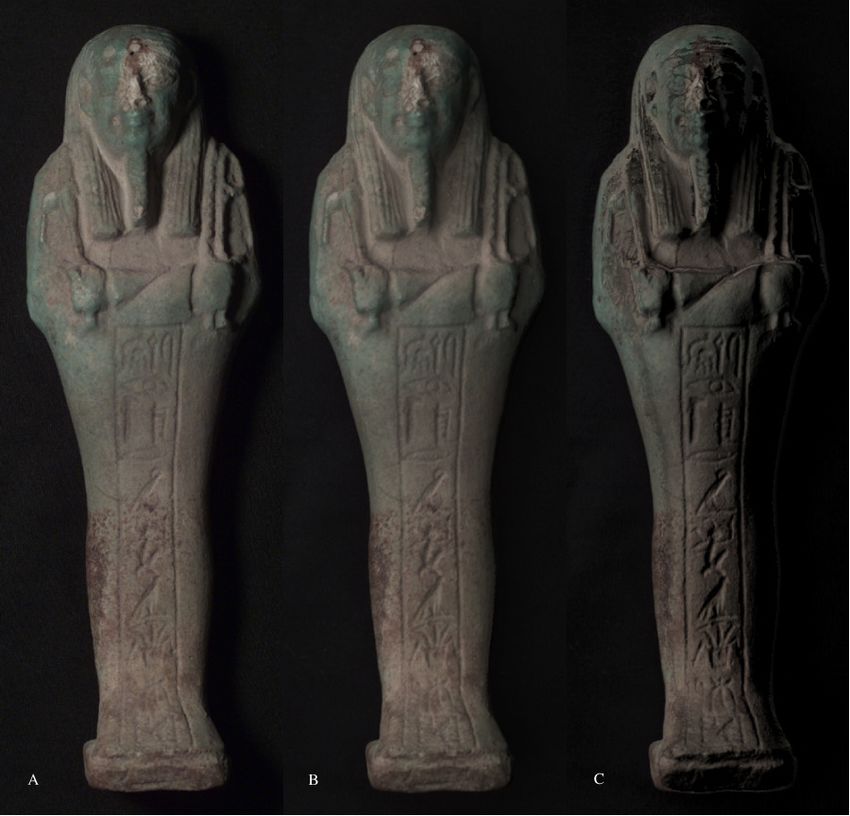
3.4 Hardware Implementations                                                     which is the square of the continuous L2 norm. Note that for
                                                                                 simplicity, we are minimizing over the domain [-1,1]2 even
PTMs were specifically designed to be implemented in VLSI. It is                 though we are only interested in the smaller domain C={lu,lv :
well known that fixed point operations generally require a smaller               lu2+lv2
reproduce effects such as shadowing where texels do not exhibit
                                                                                          specular highlights due to shadowing by small scale surface
                                                                                          variations.

                                                                                          Many surfaces exhibit increased specularity for low angles of
                                                                                          incidence due to decreases in the apparent roughness [Lafortune
                                                                                          97], a case of off-specular reflections. This can be reproduced
                                                                                          using our technique by modulating a Phong specular lobe with a
                                                                                          PTM whose magnitude increases as the incident angle approaches
                                                                                          grazing.

                                                                                          Incident illumination dependence can also be used to approximate
  Figure 3: Bump Mapping with PTMs, two light positions.                                  Fresnel effects. Fresnel effects are important for many surfaces,
                                                                                          such as metals and glass where reflectance increases greatly for
4) Render the PTM: For each pixel we have computed a
                                                                                          grazing incident angles. The reflectance of glass and other
polynomial that approximates the dot product of the bump map
                                                                                          dielectrics are low when the incident illumination direction is near
normal with any other given normalized vector. That means that
                                                                                          the surface normal. Metals also exhibit Fresnel reflectance,
we can render the bump map by evaluating this polynomial for
                                                                                          including wavelength dependence [Hall 89]. The color of
light vector (diffuse) as well as halfway vector (specular). This is
                                                                                          reflected light changes as the incident angle changes due to
illustrated in Figure 3. It shows two images of a bump map
                                                                                          reflectance variation for different wavelengths. These
textured onto a sphere. The original data is a height field capturing
                                                                                          dependencies can be approximated by the polynomial function
data simulating the surface of Mars. The sphere is lighted with
                                                                                          stored at each texel. If color changes over varying incident angles
specular and diffuse terms under varying light positions.
                                                                                          need to be captured, then RGB PTMs may be necessary. The
                                                                                          combination of the illumination dependent effects that we
3.6 PTM Filtering                                                                         described can all be stored in a single PTM. In addition, since
                                                                                          texel polynomials in the PTM are independent, these properties
One of the difficulties with using traditional bump maps to display
                                                                                          can vary across the surface. A PTM can represent different
surface detail is filtering them to match a particular sampling rate.
                                                                                          materials in a single texture map.
Approximate solutions are discussed in [Kilgard 00]. The naive
approach using mip-maps winds up smoothing the effective
                                                                                          Anisotropic materials can also be modeled using PTMs.
surface, removing the bumps themselves [Schilling 97]. The
                                                                                          Techniques to render anisotropy such as [Banks 94], [Stalling 97]
function that we would like to integrate over is the light radiated
from a bumpy patch, instead of surface perturbations themselves.                          and [Heidrich 99] define normal planes for surface points aligned
Since PTMs are image-based representations, we can achieve this                           with the direction of anisotropy. The projection of the incident
effect by mip-mapping the polynomial coefficients (a0-a5)                                 light direction into the normal plane is then used in the lighting
directly. At first this may seem odd, but a glance at Eq. 5 reveals                       calculations. This then drops off as the incident light direction
that the light dependence is linear in the polynomial coefficients.                       moves away from the preferred direction. For our technique each
Integrating over a patch Ω with n samples, we have:                                       texel in the PTM stores the magnitude of the light vector projected
                                                                                          onto the normal plane as a function of incident light direction.
      1                                                    1                              When the incident light direction is aligned near the preferred
         ∑
      n i, j∈Ω
               L r,g,b (a 0 − 5 (u i , v j ) ) = L r,g,b (   ∑
                                                           n i, j∈Ω
                                                                    a0 −5 (u i , v j ))   direction of anisotropy the evaluated PTM polynomial has a large
                                                                                          magnitude. The result of evaluating the PTM is then modulated
                                                              (14)                        with calculated specular lighting so that specular highlights occur
This states that accumulating polynomial coefficients over a patch                        only in regions where the incident light direction aligns with the
and then evaluating the sum is equivalent to accumulating the                             direction of anisotropy. Our technique allows us to render
colors each texel contributes when independently evaluated. Not                           anisotropic surfaces under perspective views with local light
only does this allow us to mip-map the coefficients directly, but                         sources, and spatially variant BRDFs in hardware. Figure 4 shows
nonisotropic filtering techniques that yield improved image                               an example of a disc rendered with a synthetic anisotropic PTM.
quality such as footprint assembly [Schilling 96] can be
supported.

3.7 Anisotropic / Fresnel / Off-Specular
The light vector dependent PTMs that we have described can be
combined with existing per-vertex or per-pixel lighting hardware
to generate a variety of useful effects. One method is to modulate
the specular component of standard lighting computations by the
result of evaluating the PTM. The existing Phong lighting
equation becomes:

I = I a k a + I d kd (N ⋅ L) + I s k s(N ⋅ H)n PTM(u,v,lu ,lv )                  (15)

In the trivial case where the PTM varies spatially but is constant
for all incident light directions this is equivalent to specular maps
or gloss maps [Blythe 99]. The dependence on light direction that                                           Figure 4: Anisotropic Disc
is not available with standard specular maps could be used to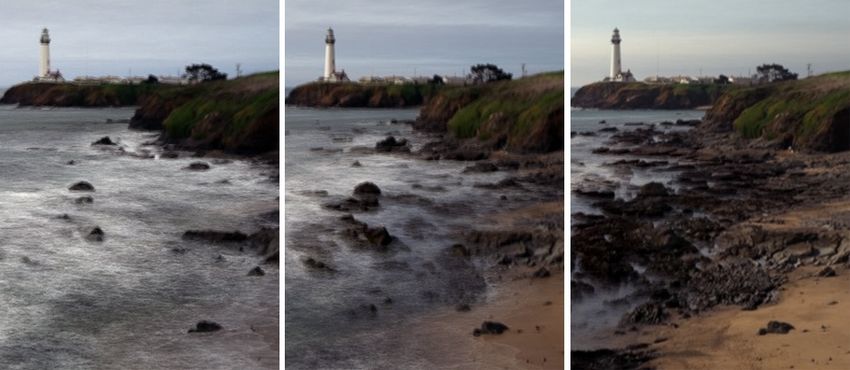
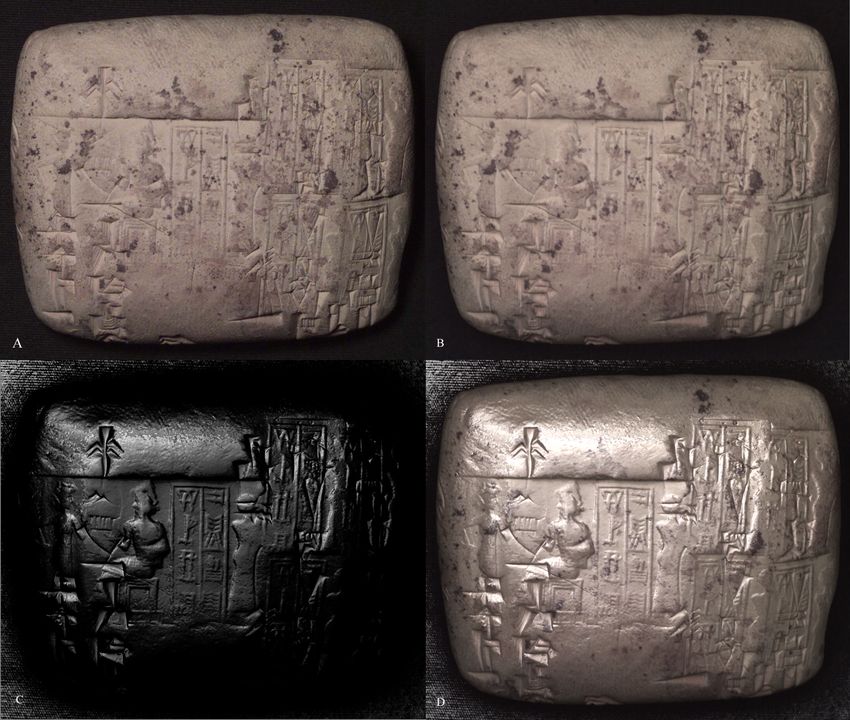
Figure 5: Specular enhancement: (A) Original Photograph (B) Reconstruction from PTM. (C) An image computed by extracting surface
normals for each pixel and applying a specular lighting model per pixel. (D) Highlights computed in (C) added to (B). Light direction is the
same for all four images. This artifact is a 4000 year old neo-Sumerian tablet.

4     2D Applications of PTMs                                            4.1      PTMs for Contrast Enhancement
                                                                         We have found that PTMs provide a valuable representation for
Although PTMs were developed as an extension to texture                  the study and archiving of ancient artifacts, in particular early clay
mapping, we have found them to have a number of uses in 2-               writings [Malzbender 00]. PTMs allow interactive control of
dimensional applications where images are commonly employed.             lighting conditions that enable greatly increased perception of
The next section discusses new contrast enhancement mechanisms           surface structure compared to photographs of these artifacts. In
and their application in the study of ancient writings. Additionally     addition, we have developed three novel contrast operators, two of
we demonstrate photographic depth of focus effects using PTMs            which rely on surface normals extracted from the coefficients
and the mapping of short image sequences to PTMs.
                                                                         themselves. Assuming a diffuse surface being photographed under
                                                                         the variable lighting apparatus shown in Figure 2, we can extract
                                                                         an estimate of the surface normal per pixel by solving for the
Figure 6: Diffuse gain shown on a 3000 year old Egyptian funerary statuette: (A) Original photograph. (B) Reconstruction from PTM. (C)
Diffuse gaina transformation that exaggerates the diffuse reflectance properties by a gain factor (g = 1.9 here), keeping the surface
normal estimate constant. These images have identical light directions and intensities.
∂L ∂L Method 1: Specular enhancement. For every texel (u,v), the
maximum luminance of Equation 5. Setting = = 0 , we normal vector can be used in a lighting equation (such as Eq. 8) to
∂u ∂v add either diffuse or specular shading effects to the image.
arrive at: Simulation of specularity is particularly effective at enhancing the
a2 a4 − 2a1a3 perception of surface shape. We are free to change the properties
lu 0 = (16)
4a0 a1 − a2 2 of the surface (specularity ks, specular exponent n) and simulated
light source (position, color) under interactive control. Our
a 2 a3 − 2a0 a 4 method is demonstrated in Figure 5 on a 4000 year old neo-
lv 0 = (17)
4a0 a1 − a2 2 Sumerian tablet. We have effectively modified the reflectance
properties of the tablet to enhance perception of surface shape,
making the inscription more readable.
for the values of the projected surface normal (lu0,lv0) that
maximizes the biquadratic of Eq. 5. The full estimated surface Method 2: Diffuse gain. For diffuse objects, the original
normal is then simply: photographed surfaces typically exhibit a gently varying change in
v surface intensity across light direction that we have fit with a 2-
N = ( lu 0 , l v 0 , 1 − lu 0 2 − l v 0 2 ) (18) dimensional convex parabola. The Gaussian curvature of this
parabola (its second spatial derivative) can be increased arbitrarily
Photometric stereo methods from computer vision would provide by a gain factor g by computing new luminance coefficients using
an alternate approach to this stage of surface normal recovery the following transformation:
[Rushmeier 97] and would also be affected by the presence of
self-shadowing, as is our method.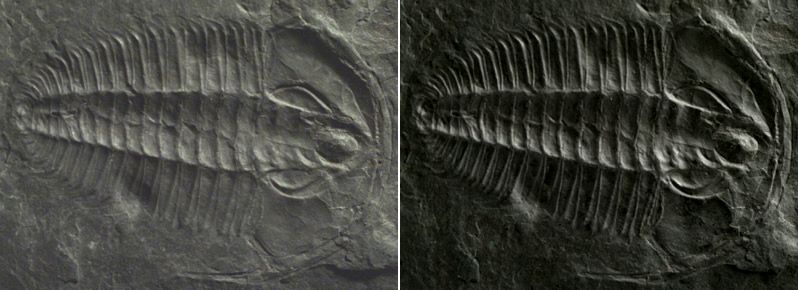
Figure 8: A single PTM can be used to provide views at continuously variable focus depths.
a 0 ' = ga0 4.2 Depth of Focus / Time Varying PTMs
a1 ' = ga1
The free parameters lu,lv in Equation 5 can be used to interpolate
a 2 ' = ga 2 (19) between a number of related images. One useful application is
a 3 ' = (1 − g )(2a 0lu 0 + a 2lv 0 ) + a3 representing a static scene under varying focus conditions. Figure
a 4 ' = (1 − g )(2a1lu 0 + a 2 lv 0 ) + a 4 8 demonstrates this capability. First we photographed the scene 6
times across a range of focus depths. Next we assigned each
a5 ' = (1 − g )(a 0lu 0 2 + a1lv 0 2 + a 2lu 0lv 0 ) + image a value spanning (–1.0 < lu < 1.0) holding lv constant, and
( a3 − a3 ' ' )lu 0 + (a 4 − a4 ' )lv 0 + a5 fit Eq. 5 for each color channel in each pixel. The resultant RGB
PTM now offers a continuously variable depth of field. Note that
This keeps the luminance maximum at the same location, namely in this case we have only used one of the two available free
(lu0,lv0), thereby retaining the surface normal direction. It also variables, lu, hence fitting only a univariate quadratic PTM. We
maintains the luminance at (lu0,lv0) retaining the surface albedo have found it useful to tie the other variable, lv, to the camera
and color in this direction. However, the directional sensitivity of aperture, allowing control of the spatial extent that is in focus as
the surface to light is increased by this transformation, enhancing well as the specific depth that is maximally focused. This
the reflectance properties of the sample. Figure 6 shows the capability allows the graphics artist to specify the focus
method on a 3000 year old funerary statuette called an ushabti parameters of an image during final composition, not when it is
from ancient Egypt. Made out of a glazed frit material (faience), originally photographed. We will see shortly that the additional
its purpose was to carry out work on behalf of the deceased in the storage required for this capability is not substantial compared
netherworld. Note the enhanced definition of the inscription. with an individual conventional image.
Method 3: Light direction extrapolation. Light source direction is This capability is not restricted to images that vary by focus
a normalized quantity encoded by the projected light direction parameters. Shown in Figure 9 are 3 reconstructions from a PTM
lu,lv. Physically realizable light sources are limited to whose input was a sequence of 40 images taken throughout the
course of the day as the tide was going out. This RGB PTM is
also computed as a univariate quadratic.
lu 2 + lv 2 ≤ 1 (20)
since the light direction is described by a normalized vector with
three real components, as shown in Eq. 18. However, this
constraint need not be applied when evaluating PTMs, allowing
one to extrapolate the reflectance model beyond what is
geometrically achievable. This extrapolation does not have an
exact physical analog, but it provides lighting that is more oblique
than any used in the original source images, providing enhanced
contrast. An example is shown in Figure 7 on a trilobite fossil.
Figure 9: Three reconstructions from a single PTM. Input images
from Sundial California published by Aladdin Systems Inc.
Copyright 1996 John M. Neil. Used with permission.
5 Compression / Palletization
The PTMs discussed in this paper are either LRGB or RGB
PTMs. For LRGB PTMs we store 9 bytes per pixel (3 colors plus
6 polynomial coefficients) and for RGB PTMs we store 18 bytes
Figure 7: Light Direction Extrapolation. Left: Source photo. per pixel (6 polynomial coefficients per color channel). We have
Right: Reconstruction with extrapolated light source direction. found that both of these representations are highly compressible,
due to both spatial correlation and correlations between byte-
planes. Compression methods developed for multispectral images
can be directly applied.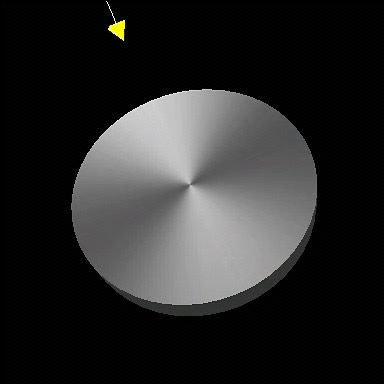
Our first compression method is to simply palletize the PTMs         PTMs were originally developed to model the dependence of
much as one palletizes images, by computing a color lookup table.    surface color on a parameterization of the light direction for
Using K-means clustering we compute a lookup table for an            interactive applications. We have shown extensions that allow
LRGB PTM that includes the 6 polynomial coefficients per entry.      Fresnel, anisotropic, off-specular, depth of focus and contrast
We have found that a 256 entry table is sufficient to be             enhancement effects to be realized. Several unexplored uses
indistinguishable from the original. This representation allows a    remain. One possibility is to allow rudimentary modeling of
one byte value to index the lookup table, with the 3 remaining       occlusion effects due to camera or object motion by indexing a
bytes of color all packed into a 32 bit field. Since 24 bit images   PTM by the view vector instead of the light direction vector.
are often packed into a 32 bit format anyway, the size of this       Another is the application of PTMs to model surface opacity in
representation compared to a conventional image grows only by a      addition to color. Both of these methods would allow modeling
small amount, the size of the lookup table (1.5 K). The analogous    geometry in image-based manner. Lastly, the method presented
representation for RGB PTMs requires 18 fields (bytes) in the        here could be generalized to higher order polynomials or non-
lookup table and we have found that 12 bit indices yield             polynomial basis functions.
indistinguishable results compared to the original PTMs. Note that
this method allows random access and individual PTM textels can
be evaluated independently.                                          Acknowledgements
                                                                     Many thanks to Religious Studies scholar Bruce Zuckerman who
Although decoding is simple and fast with this lookup table          provided access to the ancient texts imaged at the Yale
approach, we have gotten better results by decorrelating the         Babylonian Collection, as well as the USC archaeology lab.
polynomial coefficients into planes and applying JPEG or JPEG-       Thanks to Kevin Wu for Mesa implementations and developing
LS to the results [Motta 00]. Visual inspection of the polynomial    the light vector projection approach. Irwin Sobel suggested the
coefficient planes and RGB planes makes it apparent that strong      approach of palletizing PTMs to reduce storage and Giovanni
dependencies and correlations exist between these planes, and that   Motta produced the results on compression using JPEG and
further room for compression exists. Inter-plane prediction is       JPEG-LS. Paul Debevec provided thoughtful comments on the
employed to reduce this dependency. Given a reference plane,         paper. We also greatly appreciate Fred Kitson’s constant support.
pixel values in planes being encoded are estimated, resulting in
residual images. These are further compressed by intra-plane
methods that estimate pixels values based on their causal            References
neighbors. Table 1 below overviews the results for the lossless
and perceptually lossless JPEG-LS cases for the intra-pane           [Banks 94] Banks, D.C., “Illumination in Diverse Codimensions”,
prediction. Note that this includes both color and polynomial        Computer Graphics (SIGGRAPH 94 Proceedings), July 1994, pp.
coefficients.                                                        327-334.

 Dataset        lossless    loss = 1     loss = 2    loss = 4        [Blinn 78] Blinn, J.F., “Computer Display of Curved Surfaces”,
 seeds          30.3 bits   19.2 bits    15.7 bits   12.6 bits       Ph.D. Thesis, University of Utah, 1978.
 ushabti        31.3 bits   19.8 bits    15.9 bits   12.3 bits
                                                                     [Blythe 99] Blythe, D., McReynolds, T., “Lighting and Shading
 tablet         33.8 bits   21.3 bits    16.9 bits   13.0 bits       Techniques for Interactive Applications”, Course Notes (Siggraph
 lighthouse     14.6 bits   8.61 bits    6.33 bits   4.27 bits       99 Course 12), August, 1999, p. 101.
 trilobite      34.0 bits   21.6 bits    17.1 bits   13.0 bits
 focus          20.5 bits   12.3 bits    9.30 bits   5.67 bits       [Born 80] Born, Max, Wolf, Emil, “Principles of Optics”, 6th
 average        27.4 bits   17.1 bits    13.5 bits   10.1 bits       edition, Appendix VII, Cambridge University Press, Cambridge,
                                                                     1980.
Table 1: PTM Compression: Number of bits per texel for varying
amounts of imprecision tolerated in each color channel during        [Cabral 87] Cabral, B., Max, N., Springmeyer, R., “Bidirectional
reconstruction (out of 256 levels). These levels of loss are all     Reflection Functions from Surface Bump Maps”, Computer
imperceptible. Empirically we have found that visible artifacts      Graphics (SIGGRAPH 87 Proceedings), July 1987, pp. 273-281.
start appearing at approximately 4 bits per pixel.
                                                                     [Dana 99] Dana, K., Van Ginneken, B., Nayar, S., Koenderink, J.,
6 Conclusions                                                        “Reflectance and Texture of Real-World Surfaces”, ACM
                                                                     Transactions on Graphics, Vol. 18, No. 1, January 1999, pp. 1-34.

We have presented a method that requires only images to generate     [Debevec 00] Debevec, P., Hawkins,T., Tchou, C., Duiker, H.,
high quality photorealistic renderings of a textured surface. Our    Sarokin, W., Sagar, M., “Acquiring the Reflectance Field of a
method captures light dependent effects, whether they are due to     Human Face”, Computer Graphics (SIGGRAPH 2000
changes in the illuminant direction, or surface orientation of the   Proceedings), July 2000, pp. 145-156.
texture mapped object. It can render changes in brightness due to
shadows and indirect lighting that cannot be reproduced with         [Epstein 95] Epstein, R., Hallinan, P., Yuille, A., “5 +/- 2
existing bump mapping hardware, or Phong illuminated geometric       Eigenimages Suffice: An Empircal Investigation of Low-
objects. Our technique could be integrated into non-programmable     Dimensional Lighting Models, IEEE Workshop on Physics-Based
graphics hardware with minor additional hardware requirements.       Vision: 108-116, 1995.
It can be efficiently implemented using modern programmable
shading hardware. Sample PTMs and an interactive browser             [Epstein 96] Epstein, R., Yuille, A.L., Belhumeur, P.N.,
program for viewing them are available for downloading at            “Learning Object Representations from Lighting Variations”,
http://www.hpl.hp.com/ptm .                                          Object Representation in Computer Vision II Workshop,
                                                                     ECCV96, April 1996, pp.179-199.
[Georghiades 99] Georghiades, A., Belhumeur, P., Kriegman, Computer Vision and Pattern Recognition, June 23-25 1999, Vol.
“Illumination-Based Image Synthesis: Creating Novel Images of 1, pp.618-624.
Human Faces Under Differing Pose and Lighting”, IEEE
Workshop on Multi-View Modeling and Analysis of Visual Scenes, [Phong 75] Phong, B.-T., “Illumination for Computer Generated
1999, pp. 47-54. Images”, Communications of the ACM 18, 6, June 1975, pp. 311-
317.
[Golub 89] Golub, G., van Loan, C., “Matrix Computations”,
Johns Hopkins University Press, Baltimore, 1989. [Ramamoorthi 01], Ramamoorthi, R. and Hanrahan, P., “An
Efficient Representation for Environment Irradiance Maps”,
[Gortler 96] Gortler, S., Grzeszczuk, R., Szeliski, R., Cohen, M., Computer Graphics (SIGGRAPH 01 Proceedings), August 2001.
“The Lumigraph”, Computer Graphics (SIGGRAPH 96
Proceedings), August 1996, pp. 43-54. [Rushmeier 97] Rushmeier, H., Taubin, G., Gueziec, A.,
“Applying Shape from Lighting Variation to Bump Map
[Hall 89] Hall, R. Illumination and Color in Computer Generated Capture”, Eurographics Rendering Workshop Proceedings 1997,
Imagery, Springer-Verlag New York Inc., New York, 1989, pp. pp. 35-44, 1997.
193-197.
[Schilling 96] Schilling, A., Knittel, G., Strasser, W., “Texram: A
[He 91] He, X., Torrance, K., Sillion, F., Greenberg, D., “A Smart Memory for Texturing”, IEEE Computer Graphics and
Comprehensive Physical Model for Light Reflection”, Computer Applications, Vol. 16, No. 3, May 1996, pp. 32-41.
Graphics (SIGGRAPH 91 Proceedings), July 1991, pp.175-186.
[Schilling 97] Schilling, A., “Towards Real-Time Photorealistic
[Heidrich 99] Heidrich, W., Seidel, H., “Realistic, Hardware- Rendering: Challenges and Solutions”, Proceedings of the 1997
accelerated Shading and Lighting”, Computer Graphics Siggraph/Eurographics Workshop on Graphics Hardware, Aug.
(SIGGRAPH 99 Proceedings), August 1999, pp.171-178. 3-4, 1997, pp.7-15.
[Kilgard 00] Kilgard. M.,”A Practical and Robust Bump-mapping [Sillion 91] Sillion, F., Arvo, J., Westin, S., Greenberg, D., “A
Technique for Today’s GPUs”, Game Developers Conference Global Illumination Solution for General Reflectance
(GDC) 2000: Advanced OpenGL, also available at nvidia.com. Distributions”, Computer Graphics (SIGGRAPH 91 Proceedings),
July 1991, pp.187-196.
[Lafortune 97] Lafortune, E., Foo, S.-C., Torrance, K., Greenberg,
D., “Non-Linear Approximation of Reflectance Functions”, [Stalling 97] Stalling, D., Zöckler, M., Hege, H.-C., “Fast Display
Computer Graphics (SIGGRAPH 97 Proceedings), August 1997, of Illuminated Field Lines”, IEEE Transactions on Visualization
pp. 117-126. and Computer Graphics, 3(2):118-128, 1997.
[Levoy 96] Levoy, M., Hanrahan, P., “Light Field Rendering”, [Stam 99] Stam, J., “Diffraction Shaders”, Computer Graphics
Computer Graphics (SIGGRAPH 96 Proceedings), August 1996, (SIGGRAPH 99 Proceedings), August 1999, pp.101-110.
pp. 31-42.
[Teo 97] Teo, P., Simoncelli, E., Heeger, D., “Efficient Linear Re-
[Malzbender 00] Malzbender, T., Gelb, D., Wolters, H., rendering for Interactive Lighting Design”, Stanford Computer
Zuckerman, B., “Enhancement of Shape Perception by Surface Science Department Technical Report STAN-CS-TN-97-60.
Reflectance Transformation”, Hewlett-Packard Technical Report October 1997.
HPL-2000-38, March 2000.
[Watson 80] Watson, G.A., “Approximation Theory and
[Marschner 99] Marschner, S., Westin, S., Lafortune, E., Numerical Methods”, A.J.Wiley & Sons, Chichester, 1980.
Torrance, K., Greenberg, D., “Image-Based BRDF Measurement
Including Human Skin”, Rendering Techniques 99: Proceedings [Wood 00] Wood, D., Azuma, D., Aldlinger, K., Curless, B.,
of the 10th Eurographics Workshop on Rendering, June 1999, Duchamp, T., Salesin, D., Stuetzle, W., “Surface Light Fields for
ISBN 3-211-83382-X, pp. 131-144. 3D Photography”, Computer Graphics (Siggraph 2000
Proceedings), July 2000, pp. 287-296
[Motta 00] Motta, G., “Compression of Polynomial Texture
Maps”, Hewlett-Packard Laboratories Technical Report, HPL- [Wong 97] Wong, T., Heng, P, Or, S, Ng, W., “Image-based
2000-143, October 30, 2000. Rendering with Controllable Illumination”, Rendering Techniques
97: Proceedings of the 8th Eurographics Workshop on Rendering,
[Nicodemus 77] Nicodemus, F.E., Richmond, J.C., Hsai, J.J., June 16-18, 1997, ISBN 3-211-83001-4, pp. 13-22.
“Geometrical Considerations and Nomenclature for Reflectance”,
U.S. Dept. of Commerce, National Bureau of Standards, October
1977.
[Nimeroff 94] Nimeroff, J., Simoncelli, E., Dorsey, J., “Efficient
Re-rendering of Naturally Illuminated Environments”,
Eurographics Rendering Workshop Proceedings 1994, pp. 359-
374.
[Nishino 99] Nishino, K., Sato, Y., Katsushi, I., “Eigen-texture
Method – Appearance Compression based on 3D Model”, IEEEYou can also read