Static laser speckle contrast analysis for noninvasive burn diagnosis using a camera-phone imager
←
→
Page content transcription
If your browser does not render page correctly, please read the page content below
Static laser speckle contrast analysis
                 for noninvasive burn diagnosis using
                 a camera-phone imager

                 Sigal Ragol
                 Itay Remer
                 Yaron Shoham
                 Sivan Hazan
                 Udi Willenz
                 Igor Sinelnikov
                 Vladimir Dronov
                 Lior Rosenberg
                 Alberto Bilenca

Downloaded From: https://www.spiedigitallibrary.org/journals/Journal-of-Biomedical-Optics on 17 Sep 2021
Terms of Use: https://www.spiedigitallibrary.org/terms-of-use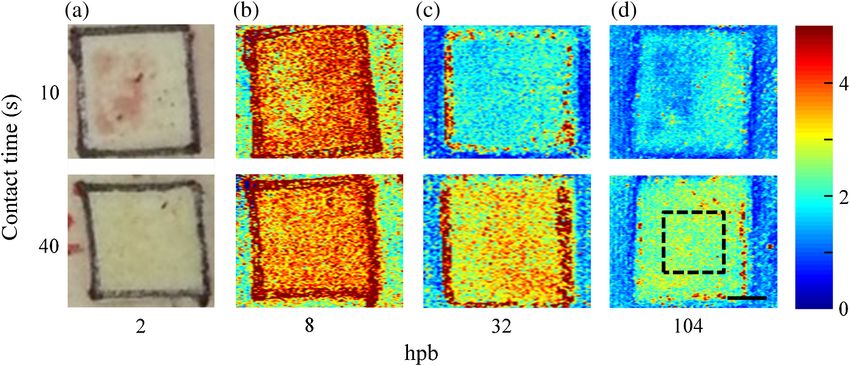
Journal of Biomedical Optics 20(8), 086009 (August 2015)

                Static laser speckle contrast analysis for noninvasive
                burn diagnosis using a camera-phone imager
                Sigal Ragol,a Itay Remer,a Yaron Shoham,b Sivan Hazan,a Udi Willenz,c Igor Sinelnikov,d Vladimir Dronov,d
                Lior Rosenberg,b and Alberto Bilencaa,e,*
                a
                  Ben-Gurion University of the Negev, Biomedical Engineering Department, 1 Ben Gurion Blvd, POB 653, Beer-Sheva 8410501, Israel
                b
                  Soroka University Medical Center, Ben Gurion University of the Negev, Faculty of Health Sciences, Department of Plastic and Reconstructive
                Surgery, Rager Blvd, POB 151, Beer Sheva 8410101, Israel
                c
                  Lahav CRO Research Unit, POB Negev, Kibbutz Lahav, 8533500, Israel
                d
                  Soroka University Medical Center, Institute of Pathology, POB 151, Beer-Sheva 8410101, Israel
                e
                  Ben-Gurion University of the Negev, Ilse Katz Institute for Nanoscale Science and Technology, 1 Ben Gurion Boulevard, P.O. Box 653, Beer-
                Sheva 8410501, Israel

                              Abstract. Laser speckle contrast analysis (LASCA) is an established optical technique for accurate widefield
                              visualization of relative blood perfusion when no or minimal scattering from static tissue elements is present, as
                              demonstrated, for example, in LASCA imaging of the exposed cortex. However, when LASCA is applied to
                              diagnosis of burn wounds, light is backscattered from both moving blood and static burn scatterers, and
                              thus the spatial speckle contrast includes both perfusion and nonperfusion components and cannot be straight-
                              forwardly associated to blood flow. We extract from speckle contrast images of burn wounds the nonperfusion
                              (static) component and discover that it conveys useful information on the ratio of static-to-dynamic scattering
                              composition of the wound, enabling identification of burns of different depth in a porcine model in vivo within the
                              first 48 h postburn. Our findings suggest that relative changes in the static-to-dynamic scattering composition of
                              burns can dominate relative changes in blood flow for burns of different severity. Unlike conventional LASCA
                              systems that employ scientific or industrial-grade cameras, our LASCA system is realized here using a camera
                              phone, showing the potential to enable LASCA-based burn diagnosis with a simple imager. © The Authors. Published by
                              SPIE under a Creative Commons Attribution 3.0 Unported License. Distribution or reproduction of this work in whole or in part requires full attribution of
                              the original publication, including its DOI. [DOI: 10.1117/1.JBO.20.8.086009]

                              Keywords: medical optics; medical instrumentation; speckle; imaging.
                              Paper 150038RR received Jan. 23, 2015; accepted for publication Jul. 6, 2015; published online Aug. 13, 2015.

                1    Introduction                                                                      and nonperfusion information inherent in the spatial laser
                Laser speckle contrast analysis (LASCA) is a relatively simple                         speckle contrast recorded for samples that contain both dynamic
                imaging method that utilizes spatial statistics of time-integrated                     and static scatterers. One such method is dynamic laser speckle
                speckle to obtain two-dimensional spatial maps of relative blood                       imaging (LSI) that evaluates the fraction of statically scattered
                flow speed over a wide field-of-view with no scanning. In                              light from the total detected intensity using a standard LASCA
                LASCA, the speckle contrast, defined as the ratio of the spatial                       imaging system and a novel processing scheme in order to
                standard deviation to the mean speckle intensity, is measured to                       improve estimation of the perfusion rate from the measured spa-
                quantify the degree of local blurring in the speckle image, which                      tial speckle contrast.9 Dynamic LSI was used for in vivo hemo-
                is directly related to tissue blood perfusion when no or minimal                       dynamic brain imaging through thinned and intact skulls of
                scattering from static tissue elements is present.1 As a result,                       rodents and showed improved assessment of relative cerebral
                LASCA has been proven effective in estimating relative                                 perfusion levels.10 Another technique is multiexposure speckle
                blood flow in the retina2–4 and exposed brain5–7 and skin8 micro-                      imaging that fits multiple-exposure spatial speckle contrast data
                circulation. However, LASCA imaging in the presence of static                          to a novel speckle model that includes both perfusion and non-
                scattering (from the skull or burn layer of skin, for instance)                        perfusion components to provide accurate flow measurements
                yields a spatial speckle contrast that includes contributions from                     in the presence of static scattering.11 Multiexposure speckle im-
                both dynamic and static scatterers in the sample. This requires                        aging was employed to more accurately evaluate in vivo blood
                the use of novel methods that can improve estimation of the                            flow changes in mice brain through thinned skull12 and skin
                dynamic (perfusion) and static (nonperfusion) speckle compo-                           perfusion.13
                nents from the measured speckle contrast; otherwise, interpre-                             In this work, we use the processing scheme of dynamic LSI
                tation of the speckle contrast as an accurate estimate of relative                     to improve estimation of the dynamic (perfusion) and static
                blood flow speed can be confounding.1,9–13                                             (nonperfusion) speckle contrast components from the speckle
                    Over the past several years, a few laser speckle-based imag-                       contrast measured by LASCA in burn phantoms and in a porcine
                ing techniques have been devised to enable access to perfusion                         burn model. In contrast to typical LASCA imaging systems that
                                                                                                       utilize scientific or industrial-grade cameras, we realize here
                                                                                                       a LASCA imaging instrument with a simple camera-phone
                *Address all correspondence to: Alberto Bilenca, E-mail: bilenca@bgu.ac.il             imager.14 Importantly, recent LASCA imaging systems using

                Journal of Biomedical Optics                                                  086009-1                                                    August 2015     •   Vol. 20(8)

Downloaded From: https://www.spiedigitallibrary.org/journals/Journal-of-Biomedical-Optics on 17 Sep 2021
Terms of Use: https://www.spiedigitallibrary.org/terms-of-use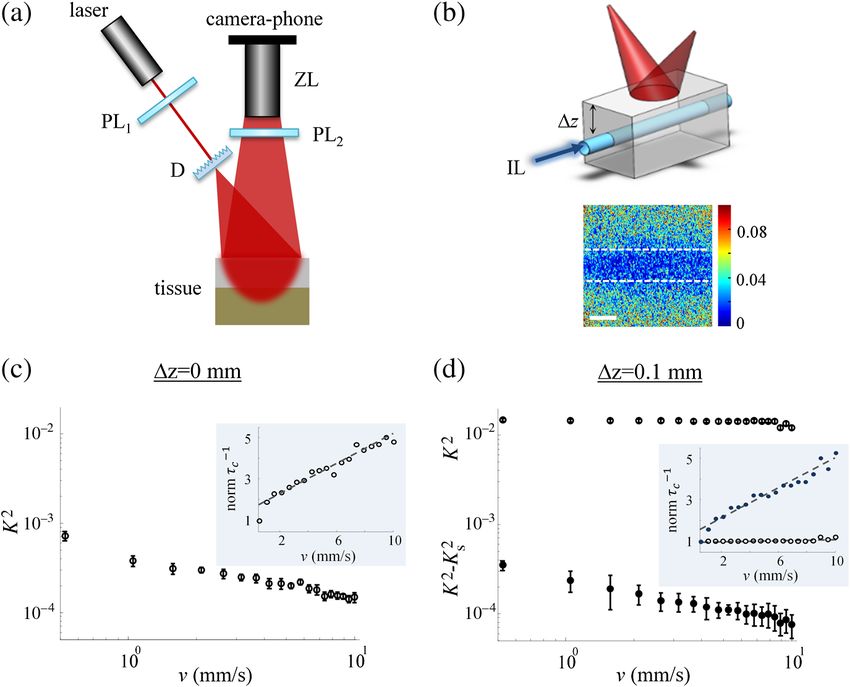
Ragol et al.: Static laser speckle contrast analysis for noninvasive burn diagnosis using a camera-phone imager

                simple imagers, including consumer-grade color cameras, web-                       2       Methods and Materials
                cams, and camera phones, have been shown to be useful
                for blood perfusion imaging of the human palm and mouse                            2.1      Camera-Phone Laser Speckle Contrast
                brain.15–17 From the perfusion and nonperfusion speckle contrast                            Analysis Imaging Instrument
                components, we extract the reciprocal of the speckle correlation
                                                                                                   The camera-phone LASCA imaging system employed in this
                time, τ−1c , and the statically-to-dynamically scattered light ratio
                                                                                                   work is shown in Fig. 1(a). A linearly polarized red He–Ne laser
                (SDR), which provide corrected estimates for blood perfusion
                                                                                                   beam (CVI Melles-Griot), reshaped by an engineered diffuser
                and static-to-dynamic scattering composition ratio of burn
                                                                                                   (Thorlabs) to a ∼5-cm diameter circle beam, illuminated the
                wounds, respectively. We then show that the SDR, rather                            sample with an intensity of 0.2 mW∕cm2 , well below the maxi-
                than τ−1c , can largely control the ability of the speckle contrast                mum permissible exposure of skin at 633 nm, as indicated by the
                to distinguish burns of different severity with statistical signifi-               American National Standards Institute.18 Backscattered light
                cance. Hence, we termed the processing scheme static laser                         from the sample was then projected onto a back-illuminated
                speckle contrast analysis (stLASCA).                                               CMOS sensor of an eight megapixel camera phone with a bit
                    The paper is organized as follows. Section 2 describes the                     depth of 8 bits per color channel (Sony-Ericsson)19 through a
                camera-phone LASCA imaging instrument and outlines meth-                           polarizer with its polarization axis perpendicular to the illumi-
                ods for stLASCA processing, preparation of the burn phantoms,                      nation polarization and a 10× zoom lens (Computar).14 The
                and use of the porcine burn model including histopathology and                     crossed polarizers rejected specular reflections from the sample
                statistical analysis of porcine burn depth. In Sec. 3, we present                  surface, and the zoom lens was set to a magnification of 0.07
                results and discussion of stLASCA in flow and burn phantoms                        and an f-stop of 8, yielding ∼12 to 16 pixels∕speckle with ∼3 to
                and in a porcine model in vivo over 104 hours postburn (hpb).                      4 red Bayer pixels and ∼9 to 12 red interpolated pixels. Note that
                Finally, conclusions are drawn in Sec. 4.                                          for our application of LASCA with a red He–Ne laser and

                                       Fig. 1 Camera-phone laser speckle contrast analysis imaging. (a) Experimental arrangement. PL1/2,
                                       crossed polarizers; D, engineered diffuser; ZL, 10× zoom lens. (b) Top panel: schematics of the
                                       flow/burn phantom used in this work. The phantom consisted of Intralipid (IL) flowing in a polycarbonate
                                       tube at speed v . The tube was embedded within a statically scattering Teflon slab at various depths, Δz,
                                       or, alternatively, was exposed to air (that is, Δz ¼ 0 mm) to obtain phantoms with insignificant static
                                       scattering. Bottom panel: representative K 2 -map of a flow phantom with v ¼ 10 mm∕s and
                                       Δz ¼ 0.1 mm. The perfused region is outlined with dashed lines. High and low K 2 values are indicated
                                       in red and blue colors, respectively. The solid bar corresponds to 1 mm. (c) K 2 versus v in a double-
                                       logarithmic scale obtained from flow phantoms with insignificant static scattering. The mean (circles) and
                                       standard deviation (error bars) of K 2 calculated over 30 successive speckle frames are shown. The inset
                                       presents normalized τ−1                    2                    2      2
                                                              c against v . (d) K (open circles) and K − K s (solid circles) versus v in a double-
                                       logarithmic scale obtained from flow phantoms with larger static scattering (Δz ¼ 0.1 mm). The mean
                                       (circles) and standard deviation (error bars) of K 2 and K 2 − K 2s calculated over 30 successive speckle
                                       frames are shown. The inset displays normalized τ−1    c against v without (open circles) and with (solid
                                       circles) correction for static scattering. Normalization of τ−1                                   −1
                                                                                                    c was performed with respect to τc at the
                                       lowest flow speed (v ¼ 0.5 mm∕s).

                Journal of Biomedical Optics                                              086009-2                                          August 2015   •   Vol. 20(8)

Downloaded From: https://www.spiedigitallibrary.org/journals/Journal-of-Biomedical-Optics on 17 Sep 2021
Terms of Use: https://www.spiedigitallibrary.org/terms-of-use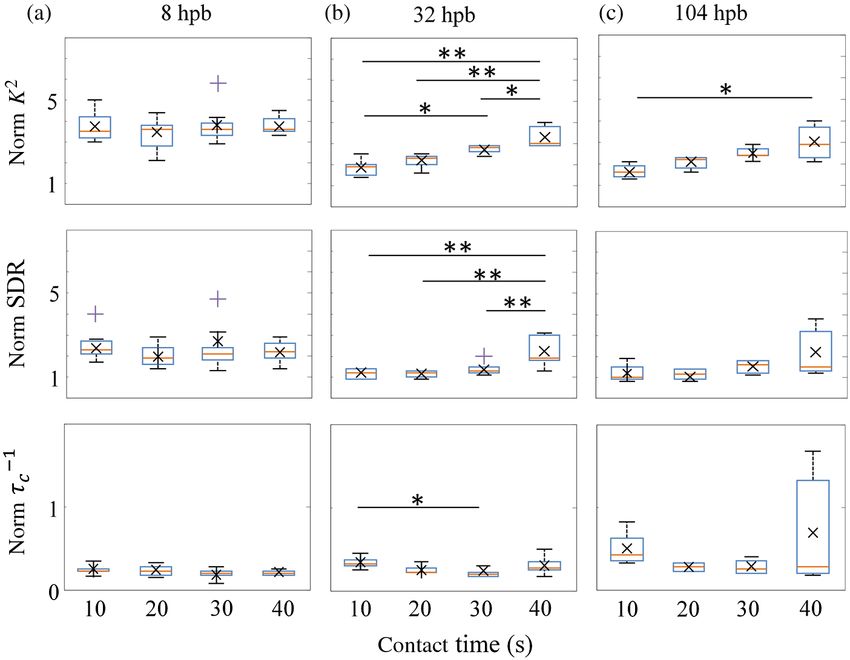
Ragol et al.: Static laser speckle contrast analysis for noninvasive burn diagnosis using a camera-phone imager
throughout all experiments, we only utilized the red channel of windows of 200 × 1000 pixels (for the flow and burn phantoms)
the demosaiced (interpolated) Bayer data provided by the cam- and 200 × 200 pixels (for the porcine burns) at zero spatial shift
era-phone sensor. Finally, the instrument was mounted on a sup- (see Appendix). The estimation of K s was further improved by
port arm that allowed appropriate orientation placement and averaging multiple K s values calculated over 15 to 30 time-suc-
stabilization of the system over the sample, thereby eliminating cessive frames.
undesired motion of the instrument during data acquisition. The dynamic (perfusion) part, K d , of the speckle contrast, K,
is given by (see Appendix)9,10
Z
2.2 Laser Speckle Contrast Analysis and Static 2β T τ
EQ-TARGET;temp:intralink-;e004;326;675
Laser Speckle Contrast Analysis K d ¼ ð1 − ρÞ2 1 − jgd ðτÞj2 dτ
T 0 T
Z T 1∕2
Videos of speckle patterns were captured with 720p resolution 2β τ
at 30 frames∕s by the camera-phone imager. The videos were þ 2ρð1 − ρÞ 1 − jgd ðτÞjdτ ; (4)
compressed using H.264, which is a lossy video compression
T 0 T
technique that attempts to eliminate duplicate image data
where T is the camera integration time. Here, the electric field
between frames (e.g., background information) while estimating
autocorrelation function gd ðτÞ represents the temporal fluctua-
image motion data from neighboring frames.20 The acquired
tions of the speckle field (due to backscattering off moving scat-
sequence of speckle images was subsequently processed
terers in the medium) with characteristic decay time of τc .
using MATLAB (Mathworks) on a standard personal computer
Assuming T ≫ τc and a medium with backscattering ballistic
to quantify the spatial laser speckle contrast and its nonperfusion
or diffusive dynamics and strong multiple scattering, τ−1 c , in
and perfusion components, from which we recovered the
the medium can be expressed as (see Appendix)
SDR and the reciprocal of the speckle correlation time, τ−1 c ,
of the scattering medium, respectively.
1 ðβ1∕2 − K s Þ2 þ 4K s ðβ1∕2 − K s Þ
The spatial laser speckle contrast, K, is given by1 τ−1
c ¼ ; (5)
K 2 − K 2s
EQ-TARGET;temp:intralink-;e005;326;525
T
σ
K¼ ; (1)
μ where β and K s were defined in Eq. (2). To recover τ−1c from the
EQ-TARGET;temp:intralink-;e001;63;502
speckle data, Eq. (5) was used with the estimates of K and K s
where μ and σ denote the local mean and standard deviation of described above. Because τ−1 c is generally assumed to be propor-
the speckle intensity pattern, respectively. In LASCA, the esti- tional to the speed of the moving scatterers in the medium,1,21
mations for μ and σ (and hence K) were computed as the sample Eq. (5) provides corrected recovery of flow speed from K 2 in the
mean and the square root of the sample variance of the speckle presence of static scatterers. Note that Eq. (5) converges (up to a
image, respectively, over spatial windows of 200 × 1000 pixels proportional constant) to simplified LASCA equations with no
(for the flow and burn phantoms) and 200 × 200 pixels (for the or minimal static scattering (that is, K s ≅ 0) reported by Cheng
porcine burns). To reduce measurement noise, the final spatial and Duong,3 Cheng et al.,4 and Ramirez-San-Juan et al.22
speckle contrast was obtained by averaging 15 to 30 K 2 values
evaluated over successive speckle frames. To produce K 2 -maps, 2.3 Flow and Burn Phantoms
a sliding window of 5 × 5 pixels was applied to 15 to 30 con-
secutive speckle frames, which were then averaged for noise Flow phantoms with and without significant static scattering
reduction. Importantly, in the in vivo porcine model study, 15 were produced by flowing Intralipid solution (Simga; 9% in
speckle contrast values were acquired over 0.5 s during exha- absolute concentration) in a 0.6-mm diameter polycarbonate
lation intervals of ∼1.25 s. The data exhibited a steady level tube (Paradigm Optics) embedded Δz ¼ 0.1 mm in a statically
of contrast in these time intervals and were further averaged scattering Teflon slab or exposed to air, respectively, as shown in
for noise reduction, thus minimizing breathing artifacts. the upper panel of Fig. 1(b). A range of flow speeds from 0.5 to
The static (nonperfusion) speckle contrast component, K s , of 10 mm∕s was generated using a digital syringe pump (New Era
the spatial laser speckle contrast, K, reads as (see Appendix)9,10 Pump Systems).
To mimic skin burn wounds of different depth and blood
Is flow conditions, we fabricated phantoms comprising a statically
K s ¼ β1∕2 ρ; ρ¼ ; (2)
Is þ Id
EQ-TARGET;temp:intralink-;e002;63;264
scattering Teflon slab within which a 9% Intralipid solution was
flowing at 3 and 10 mm∕s through a 0.6-mm diameter polycar-
where ρ is the fraction of total light that is statically scattered, I s bonate tube embedded at a depth of Δz ¼ 0.1 to 1.7 mm below
and I d are the mean intensities of light scattered from the static the Teflon–air interface, as illustrated in the upper panel of
and dynamic scatterers in the imaged medium, respectively, and Fig. 1(b). The Teflon slab, having a reduced scattering coeffi-
β is a normalization coefficient (so-called coherence factor) cient of ∼35 cm, emulated the upper static burn layer, whereas
calibrated here to a value of 0.05 using a Teflon slab with the 9% Intralipid solution with a reduced scattering coefficient
ρ ¼ 1.9,10 The SDR of the medium can directly be derived of ∼25 cm−1 simulated blood in the viable tissue underlying the
from Eq. (2) to be burn layer.23 The reduced scattering coefficients of the Teflon
and Intralipid solution were measured by oblique-incidence
Is ρ K s ∕β1∕2 optical reflectometry.24
SDR ¼ ¼ ¼ : (3)
I d 1 − ρ 1 − K s ∕β1∕2
EQ-TARGET;temp:intralink-;e003;63;143
2.4 Porcine Burn Model
To retrieve the SDR from the speckle data, Eq. (3) was
employed with the estimator for K s computed by cross-correlat- An in vivo experiment using a porcine skin burn model was per-
ing two time-sequential speckle frames across observation formed at Lahav CRO research unit (Kibbutz Lahav, Israel). The
Journal of Biomedical Optics 086009-3 August 2015 • Vol. 20(8)
Downloaded From: https://www.spiedigitallibrary.org/journals/Journal-of-Biomedical-Optics on 17 Sep 2021
Terms of Use: https://www.spiedigitallibrary.org/terms-of-useRagol et al.: Static laser speckle contrast analysis for noninvasive burn diagnosis using a camera-phone imager
study protocol was approved by the National Animal Care monitored throughout the experiment (VitaLogic™ 6000, Men-
and Use Committee (#IL-13-05-098) and was executed in accor- nen Medical, Pennsylvania).
dance with the Guide for the Care and Use of Laboratory Forty-eight partial-thickness burns were inflicted by varying
Animals. The porcine skin model was selected due to the high the contact time between a brass block heated in boiling water to
resemblance of porcine skin to human skin in terms of structure 100°C and the animal skin.25,26 Specifically, twelve 3 × 3 cm2
and wound healing.25 In addition, this model has the advantage burns were created on the pig dorsum at each of the four contact
of allowing comparison to histopathology which, in most cases, time of 10, 20, 30, and 40 s, yielding four burn groups. As
is unavailable in human injuries. shown in Fig. 2(a), burns of each group were uniformly distrib-
One domestic female pig (Sus scrofa domestica), crossbred uted across the animal dorsum to reduce the relationship
between Mixed Landrace and Large White, weighing 33 kg between burn group and position, enabling a longitudinal
and approximately two months old was used in this experiment. study with a statistically adequate number of burn biopsies col-
The pig was individually housed, had access to water, and lected from the central field-of-view of the LASCA images. To
acclimated to the facilities for 5 days prior to use. The pig was ensure a contact temperature of 100°C immediately prior to each
fasted for 12 h before anesthesia, and hair was removed from the infliction, the temperature of the brass block was monitored
pig dorsum immediately prior to experiment. All burn procedures using a thermocouple threaded into the bottom of the block.
were performed under general anesthesia, induced by intramus- For each burn site, the brass block was first gently touched
cular injection of Ketamine HCl (Clorketam® 1 g∕10 ml, to a towel to remove water drops and was subsequently placed
Vetoquinol, Lure, France) 10 mg∕kg, Xylazine HCl (Thiazine® on the animal skin. Only the weight of the block was used to
100 mg∕ml, Ceva Animal Health Pty LTD, New South Wales, form the burns and no additional pressure was applied, as
depicted in Fig. 2(b). Furthermore, to avoid variations in creat-
Australia) 2.0 mg∕kg, and IV after vein flow insertion of Diaz-
ing the burns, one person (Y.S.) created all burns.
epam (Assival® 10 mg∕2 ml, Teva Pharmaceutical Industries
Ltd, Hungary) 5 mg∕pig. An endotracheal tube was used for
mechanical ventilation with 2% to 3% Isoflurane (Ohmeda 2.5 Histopathology
7900, Datex-Ohmeda, Inc., Wisconsin). Electrocardiogram, For a blinded histologic analysis, four 4-mm biopsy punches of
heart rate, O2 saturation, and body temperature were continuously each burn group (corresponding to contact times of 10, 20, 30,
and 40 s) were collected from different locations across the
entire animal dorsum at 8, 32, and 104 hpb. Burn regions were
punched at the center and were then excluded from subsequent
imaging measurements. All biopsies were processed and stained
using hematoxylin and eosin (H&E), which darkens in the pres-
ence of denatured dermal collagen, yielding histology images,
as those shown in Figs. 2(c) and 2(d). To assess burn depth, his-
tological slides were evaluated independently by two patholo-
gists against predetermined histologic criteria,27,28 including,
for example, disorganization of the basal layer, vascular col-
lapse, eosinophilia (or blurring pattern) of collagen fibers,
and empty cavity of the pilosebaceous unit. The burn thickness
was determined to be corresponding to the deepest identified
histologic feature within the burn under examination. Burn
depth was reassessed by both pathologists together in cases
where their blind assessment resulted in depth differences larger
than 0.1 mm.
2.6 Statistical Analysis
To test the significant difference between the burn groups, a one-
way analysis of variance followed by Tukey’s post-hoc test was
performed on histologic burn depth and normalized K 2 , SDR,
Fig. 2 Porcine skin burn model and histopathology. (a) 48 partial-
and τ−1
c measured for four burn groups of contact times of 10,
thickness thermal burns on pig dorsum on either side of the spine
are shown at 2 hpb, where the solid lines outline the region of 20, 30, and 40 s at biopsy times of 8, 32, and 104 hpb. K 2 , SDR,
each burn. Contact times between the burn infliction probe and the and τ−1 2
c were normalized by the corresponding K , SDR, and
−1
τc values of normal porcine skin measured in a control region
animal skin are written along the spine of the pig. (b) The infliction
probe, made of a brass block, was preheated in boiling water to on the animal dorsum at the time of biopsy.
100°C. A thermocouple threaded into the bottom of the probe was
used to monitor the block-skin contact temperature. Only the weight 3 Results and Discussion
of the block was used to create the burns and no additional pressure
was applied. (c) and (d) Representative hematoxylin and eosin
3.1 Validation of the Camera-Phone Laser Speckle
stained histology images of (c) 10-s and (d) 40-s burns at 8 hpb.
The asterisk points to an empty cavity of the pilosebaceous unit in Contrast Analysis Imaging Instrument for
the 10-s burn, and the arrowhead points to eosinophilic collagen fibers Perfusion Measurements
in the 40-s burn tissue. The thickness of the burn was determined to
be corresponding to the deepest identified histologic feature within the To validate the camera-phone LASCA system for perfusion
burn wound as indicated by the vertical double arrows. The scale bars measurements, we studied flow phantoms with and without
are 1 mm. significant static scattering (see Sec. 2.3). The lower panel of
Journal of Biomedical Optics 086009-4 August 2015 • Vol. 20(8)
Downloaded From: https://www.spiedigitallibrary.org/journals/Journal-of-Biomedical-Optics on 17 Sep 2021
Terms of Use: https://www.spiedigitallibrary.org/terms-of-useRagol et al.: Static laser speckle contrast analysis for noninvasive burn diagnosis using a camera-phone imager
Fig. 1(b) shows a typical speckle contrast map (K 2 -map) of a previously noted, to provide corrected estimates for the relative
flow phantom with significant static scattering as measured static-to-dynamic scattering composition ratio and flow speed in
by the system. The embedded perfused region, outlined in samples consisting of both dynamic and static scatterers.
dashed lines, is clearly observed. Figure 1(c) presents the results
of K 2 and relative speckle correlation time, τ−1c , against actual
flow speed, v, in a phantom with insignificant static scattering. 3.2 Camera-Phone Static Laser Speckle Contrast
Here, τ−1
Analysis Imaging of Burn Phantoms
c was retrieved using Eq. (5) with K s ¼ 0. Note that K
2
versus v is plotted in a double-logarithmic scale and that error To explore the applicability of the camera-phone stLASCA
bars represent standard deviations. The linear relationship of K 2 prototype in burn diagnosis, burn phantoms of different depth
and relative τ−1
c with flow speed is evidently visible (R ¼ 0.943
2
and perfusion rate conditions were studied (see Sec. 2.3).
−1
for τc ). Despite K values being extracted from H.264 video
2
Figure 3(a) shows the behavior of the normalized K 2 versus
compressed data (possibly with reduced precision due to the thickness of the simulated burn, Δz, at flow speeds of
lossy raw data compression), these results validate the cam- v ¼ 3 mm∕s (solid circles) and v ¼ 10 mm∕s (up-pointing tri-
era-phone LASCA imaging prototype for accurate perfusion angles) in the phantoms. From Fig. 3(a), we can clearly see that
measurements when no or insignificant static scattering is K 2 increases with thickness of the simulated burn for both flow
present. Figure 1(d) depicts K 2 and relative τ−1 c versus v in a speeds, validating the known result that speckle contrast
phantom with significant static scattering prior to (open circles) increases with burn severity.29 However, K 2 increases differently
and following (solid circles) correction of K 2 and τ−1c for static for the two flow speeds as indicated by the gap between the
scattering. Note that K 2 versus v is plotted in a double-logarith- solid and dashed lines in Fig. 3(a). In particular, while relative
mic scale and error bars are standard deviations. The SDR of this changes in flow speed were detectable by K 2 at simulated burn
phantom, which quantifies the static-to-dynamic scattering com- depths as low as Δz ¼ 0.3 mm, no relative changes in flow
position ratio of the sample, was calculated using Eq. (3) to be speed were reliably measured by K 2 at larger depths. The
20-fold larger than that of the phantom with insignificant static increase in speckle contrast for the deeper burn phantoms should
scattering. The data clearly show that the linearity of K 2 and therefore be due to higher static scattering in these phantoms,
relative τ−1
c measurements obtained by traditional LASCA rather than reduced perfusion as typically assumed for an
(which does not correct for static scattering) breaks down in increase in speckle contrast in the absence of static scatterers.1,21
the presence of static scatterers (R2 ¼ 0.414 for τ−1 c ), whereas These results reinforce the fact that interpretation of the spatial
LASCA with correction of K 2 and τ−1 c for static scattering [via laser speckle contrast as an accurate estimate of relative flow
K 2 → K 2 − K 2s and Eq. (5), respectively] preserves the linearity speed can be confounded by the presence of static scattering.
of K 2 and relative τ−1c even when static scatterers are present To obtain improved information on the nonperfusion and
(R2 ¼ 0.946 for τ−1c ). Although speckle contrast data were com- perfusion components in the burn phantoms, we extracted
puted from H.264 compressed videos (possibly with reduced from the measured speckle contrast, the SDR and τ−1 c , for
precision compared to uncompressed video data), these results each phantom using Eqs. (3) and (5), respectively. Figures 3(b)
confirm the ability of the camera-phone LASCA imaging sys- and 3(c) depict the normalized SDR against thickness of the
tem with correction for static scattering, termed stLASCA as simulated burn, Δz, and a bar graph of the relative τ−1 c values,
Fig. 3 Camera-phone static laser speckle contrast analysis imaging of burn phantoms. (a) Dependence
of normalized K 2 on simulated burn layer depth, Δz, for perfusion rates of v ¼ 3 mm∕s (solid circles) and
v ¼ 10 mm∕s (up-pointing triangles). K 2 was normalized to the lowest K 2 value obtained at
Δz ¼ 0.1 mm and v ¼ 10 mm∕s. Solid and dashed lines are drawn to guide the eyes for K 2 values mea-
sured at v ¼ 3 and 10 mm∕s, respectively. Repeated measurement standard deviations were negligible
and are not presented for clarity. (b) Dependence of the normalized statically-to-dynamically scattered
light ratio (SDR) of the burn phantoms on Δz for perfusion rates of v ¼ 3 mm∕s (solid circles) and v ¼
10 mm∕s (up-pointing triangles). Normalized SDR values are also shown for Intralipid concentrations of
3% (orange diamond) and 15% (cyan square) at Δz ¼ 1.1 mm and v ¼ 3 mm∕s. SDR values were nor-
malized to the SDR obtained at Δz ¼ 0.1 mm and v ¼ 10 mm∕s. Dashed line is drawn to guide the eyes.
Repeated measurement standard deviations were negligible and are not presented for clarity. (c) Bar
graph of normalized τ−1 c values obtained from burn phantoms of Δz ¼ 0.1 to 1.7 mm and v ¼ 3 and
10 mm∕s. Normalization of τ−1 c was performed with respect to its average value at v ¼ 3 mm∕s.
Journal of Biomedical Optics 086009-5 August 2015 • Vol. 20(8)
Downloaded From: https://www.spiedigitallibrary.org/journals/Journal-of-Biomedical-Optics on 17 Sep 2021
Terms of Use: https://www.spiedigitallibrary.org/terms-of-useRagol et al.: Static laser speckle contrast analysis for noninvasive burn diagnosis using a camera-phone imager
respectively. Figure 3(b) clearly shows that the normalized SDR stem from the limited burns thickness and relatively large vari-
increases identically with the thickness of the simulated burn for ability of burn depth within each burn group obtained by the
the two flow speeds used in the experiments. Furthermore, infliction technique used here. Burn wounds created with devi-
reduction and increase of the Intralipid concentration in the ces designed to apply a controlled, reproducible pressure to the
1.1-mm burn phantom raised and lowered the normalized animal skin could probably improve the statistical significance
SDR at v ¼ 3 mm∕s, respectively, as shown in Fig. 3(b), for between burn groups of different contact time.29 Nevertheless,
Intralipid concentrations of 3% (orange diamond) and 15% statistically significant correlations between probe contact time
(cyan square). Similar results were obtained at flow speed of and histologic burn depth were found over the entire course of
v ¼ 10 mm∕s but are not shown for clarity of the plot. the experiment (r ¼ 0.75, 0.7, 0.66 at 8, 32, and 104 hpb,
These findings suggest that the SDR of a burn wound can con- respectively; n ¼ 16). Note that the progressive decrease in
vey useful information on the static-to-dynamic scattering correlation over time may be due to the dynamic evolution
composition ratio of the burn regardless of blood perfusion of the burns.30
irregularities in the wound, thereby providing a novel nonper- To study the ability of the camera-phone stLASCA imaging
fusion measure for discriminating burns of different severity. instrument to distinguish burns of different depths (and hence
Finally, we note from Fig. 3(c) that the corrected estimator for severity), we measured the speckle contrast for the different
relative τ−1
c [Eq. (5)] can detect the difference between the two burns at 8, 32, and 104 hpb. Figure 5 presents representative
flow speeds used in the various burn phantoms with a p-value color photos of 10- and 40-s burns at 2 hpb along with the cor-
of 0.15. responding normalized K 2 -maps measured at 8, 32, and 104
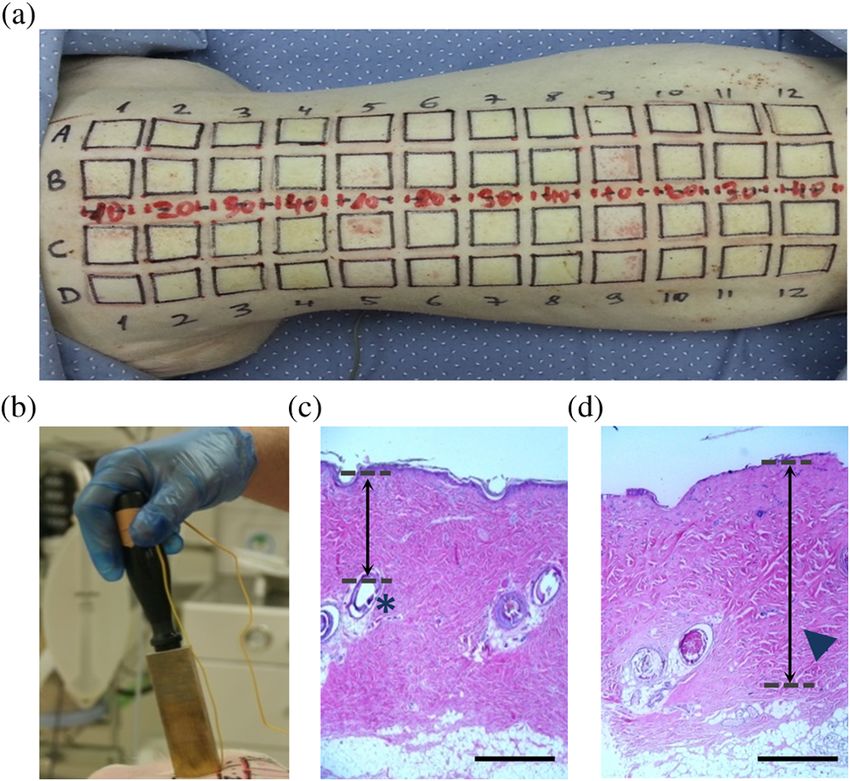
hpb. While the image of the 10-s burn showed white and
3.3 Camera-Phone Static Laser Speckle Contrast pink areas at the wound site, the photo of the 40-s burn appeared
Analysis Imaging of Porcine Burn Model In Vivo white throughout the entire wound region, allowing one to vis-
ually distinguish 10-s burns from 40-s burns. Inspection of the
We next tested the camera-phone stLASCA system for burn
diagnosis in vivo using a porcine burn model (see Sec. 2.4). corresponding normalized K 2 -maps reveals that of the 10- and
To determine the actual depth of the different burns, inflicted 40-s burns experienced a different increase in speckle contrast
by a hot probe with contact times of 10, 20, 30, and 40 s, a his- over the course of the study relative to normal skin. Specifically,
tologic analysis was performed. Figures 2(c) and 2(d) show rep- while a similar increase in speckle contrast was found for both
resentative histology images of 10- and 40-s burns at 8 hpb, types of burns at 8 hpb, the more severe 40-s burns exhibited a
respectively. The histologic depth of the burns, indicated with slower recovery of the speckle contrast over time as can be
a vertical double arrow, was determined to be corresponding observed from Fig. 5. We note that in contrast to the 10- and
to the deepest identified histologic feature from amongst 40-s burns, the 20- and 30-s burns were indistinguishable by
several criteria (see Sec. 2.5). For example, the thickness of eye from the 40-s burns at 2 hpb [see Fig. 2(a)], and their cor-
the 10-s burn in Fig. 2(c) was determined by the location of responding normalized K 2 maps appeared relatively similar to
the empty cavity of the pilosebaceous unit (pointed by the aster- that of the 40-s burns at 8 and 32 hpb (data not shown).
isk), whereas the thickness of the 40-s burn in Fig. 2(d) was To quantify relative changes in the speckle contrast images of
resolved by identifying eosinophilic collagen fibers in the tissue the porcine burns with respect to normal porcine skin, we gen-
(pointed by the arrowhead). Figure 4 shows box plot represen- erated the box plot of relative K 2 by the four burn groups (of
tation of histologic burn depth by four burn groups (of contact contact times of 10, 20, 30, and 40 s) at 8, 32, and 104 hpb,
times of 10, 20, 30, and 40 s) at 8, 32, and 104 hpb. These plots as presented in Fig. 6(a). The figure shows a considerable
reveal that only the 10- and 40-s burns were statistically distinct increase in K 2 at 8 hpb relative to normal skin for all burn types.
over the entire course of the longitudinal study. This result may However, no significant difference between the four burn groups
Fig. 4 Box and whisker plots of histologic burn depth for four porcine burn groups of different contact
times of 10, 20, 30, and 40 s. Plots are shown for (a) 8 hpb, (b) 32 hpb, and (c) 104 hpb. The boxes
represent the median (orange middle line) and mean (black cross) limited by the 25th (Q1) and 75th (Q3)
percentiles. The whiskers are the upper and lower adjacent values, which are the most extreme values
within Q3 + 1.5(Q3 − Q1) and Q1 − 1.5(Q3 − Q1), respectively. Single and double asterisks represent
statistically significant differences between burn groups (P < 0.05 and P < 0.01, respectively). The num-
ber of biopsied burns obtained at each contact time was 4.
Journal of Biomedical Optics 086009-6 August 2015 • Vol. 20(8)
Downloaded From: https://www.spiedigitallibrary.org/journals/Journal-of-Biomedical-Optics on 17 Sep 2021
Terms of Use: https://www.spiedigitallibrary.org/terms-of-useRagol et al.: Static laser speckle contrast analysis for noninvasive burn diagnosis using a camera-phone imager
Fig. 5 Representative color photos of 10-s and 40-s porcine burns at (a) 2 hpb alongside with the cor-
responding normalized K 2 -maps at (b) 8 hpb, (c) 32 hpb, and (d) 104 hpb (top row: 10-s burns, bottom
row: 40-s burns). Normalization of K 2 was performed with respect to K 2 of normal porcine skin. High and
low normalized K 2 levels are indicated in red and blue colors, respectively. The outlined region repre-
sents the central burn area. The scale bar is 10 mm.
was detected by K 2 at 8 hpb, possibly due to the limited graded burns from the 10-s burns. At 104 hpb, K 2 was still higher
burn severity obtained by the infliction probe and the complex than that of normal skin for all burn types and its median values
pathophysiology of thermal burns a few hours following injury. were lower than those estimated at 32 hpb, implying the
At 32 hpb, K 2 of the different burn groups remained higher than progress of healing of the wounds. Furthermore, normalized K 2
that of normal skin; yet, normalized K 2 median values were at 104 hpb presented a statistically significant correlation to
lower than those recorded at 8 hpb, pointing on a possible initial probe contact times (r ¼ 0.77, n ¼ 14) but could significantly
recovery of the burns. In addition, normalized K 2 measured at distinguish between the 40- and 10-s burns only.
32 hpb showed a statistically significant correlation to inflictor We further extracted from the measured speckle contrast
contact times (r ¼ 0.84, n ¼ 29) and significantly distinguished improved information on the nonperfusion and perfusion com-
the 40-s burns from the three other burn types, and the 30-s ponents in the porcine burns by computing the SDR and τ−1 c for
Fig. 6 Box and whisker plots of normalized (a) K 2 , (b) SDR, and (c) τ−1c for four porcine burn groups of
different contact times of 10, 20, 30, and 40 s. Plots are shown for 8, 32, and 104 hpb. K 2 , SDR, and τ−1
c
were normalized to K 2 , SDR, and τ−1c of normal porcine skin. The boxes and whiskers signify the same as
in Fig. 4. The purple plus signs represent outliers. Single and double asterisks denote statistically sig-
nificant differences between burn groups (P < 0.05 and P < 0.01, respectively). The number of burns
used in the statistical analysis was as follows: at 8 hpb, 43 burns (11 burns at each of the contact
times of 10, 20, 30 s and 10 burns at 40-s contact time); at 32 hpb, 29 burns (8 burns at 10-s contact
time and 7 burns at each of the contact times of 20, 30, and 40 s); and at 104 hpb, 14 burns (4 burns at
each of the contact times of 10 and 20 s, and 3 burns at each of the contact times of 30 and 40 s).
Journal of Biomedical Optics 086009-7 August 2015 • Vol. 20(8)
Downloaded From: https://www.spiedigitallibrary.org/journals/Journal-of-Biomedical-Optics on 17 Sep 2021
Terms of Use: https://www.spiedigitallibrary.org/terms-of-useRagol et al.: Static laser speckle contrast analysis for noninvasive burn diagnosis using a camera-phone imager
each burn [using Eqs. (3) and (5), respectively], and sub- in an animal model in vivo. The system incorporated an
sequently quantifying their change relative to the SDR and improved processing scheme with a previously neglected cor-
τ−1
c of normal porcine skin, respectively. Figures 6(b) and 6(c) rection of speckle contrast against statically scattered light
show, respectively, the box plots of relative SDR and τ−1 c by the from the burn wound. This processing scheme was shown to
four burn groups (of contact times of 10, 20, 30, 40 s) at 8, 32, provide corrected estimation for the perfusion and nonperfusion
and 104 hpb. A few points can be drawn from these figures as components in the burn by means of the reciprocal of the
follows: (i) At 8 hpb, all burn types experienced an increase in speckle correlation time (τ−1
c ) and the SDR, respectively, thereby
SDR and a decrease in τ−1 c relative to normal skin, implying the facilitating interpretation of speckle contrast data of burn
higher static-to-dynamic scattering composition ratio and lower wounds. In particular, using stLASCA of graded porcine
blood perfusion of the wounds (with respect to normal porcine burns, we showed that the SDR (which measures the static-
skin). However, similarly to the speckle contrast measured at 8 to-dynamic scattering composition ratio of the wound), rather
hpb [Fig. 6(a)], no significant difference between the four burn than τ−1c (which is proportional to the blood perfusion rate in
groups was identified neither by the SDR nor by τ−1 c at 8 hpb. (ii) the burn), can largely control the ability of the measured speckle
At 32 hpb, the median values of the normalized SDR (τ−1 c ) of the contrast to distinguish burns of different severity with statistical
four burn groups remained higher (lower) than those measured significance during the first 48 hpb, suggesting that relative
for normal skin but lower (higher) than those at 8 hpb, indicating changes in the static-to-dynamic scattering composition of
a possible initial recovery of the burns. Most importantly, while burns can dominate those in blood flow for burn wounds of dif-
SDR at 32 hpb showed a statistically significant correlation to ferent severity.
probe contact times (r ¼ 0.67, n ¼ 29) and significantly distin- Although the current system employed a large red illumina-
guished the 40-s burns from the three other burn types, τ−1 c at 32 tion laser and a zoom magnifying lens, compact laser diode
hpb presented a statistically insignificant correlation to inflictor modules and detachable camera-phone zoom lenses could be
contact times and significantly distinguished between the 30-
used in the future.16,17 In addition, camera-phone stLASCA
and 10-s burns only. These results show that the SDR, rather
devices could enable imaging of bigger burn surfaces by utiliz-
than τ−1
c , can largely control the ability of the measured speckle
ing wider illumination and larger image sensors and could be
contrast to distinguish burns of different severity with statistical
designed to be handheld using numerical image stabilization
significance, suggesting that relative changes in the static-to-
methods, such as speckle image registration.32 Finally, we envi-
dynamic scattering composition of burns can dominate relative
sion that speckle contrast maps, SDR, and τ−1 c values could ulti-
changes in blood flow for burns of different depth. (iii) At 104
hpb, the median SDR (τ−1 mately be generated by a smartphone application within several
c ) of the four burn groups remained
higher (lower) than that measured for normal skin but was tens of milliseconds.14
lower (higher) than those at 32 hpb (except for the SDR of
the 30-s burns), implying the progress of healing of the burns
in terms of reduced static-to-dynamic scattering composition
ratio and increased blood perfusion of the wounds. Unlike
Appendix
speckle contrast measured at 104 hpb, no significant difference This appendix describes the model for the squared spatial laser
between the four burn groups was identified neither by the SDR speckle contrast, K 2 , and follows the formalism described by
nor by τ−1c [probably due to the noisier estimates for SDR and Zakharov et al.9,10 Consider a coherent light source illuminating
τ−1
c at 104 hpb, as seen in Figs. 6(b) and 6(c), respectively]. a scattering medium with static and dynamic scatterers. Light
Comparison of our speckle contrast results for the graded waves propagate in the medium and are backscattered off
porcine burns with those obtained recently by Ponticorvo et al.8 both types of scatterers, forming speckle intensity patterns that
using spatial LSI with a scientific-grade monochrome cam- are detected by the camera sensor. An expression for the squared
era29,31 reveals that, in both studies, all porcine burns experi- spatial contrast of the time-integrated speckle intensity pattern
enced an increase in K 2 relative to that of normal skin and shows can be derived to be1,9,10
that K 2 had an increasing trend with burn severity at times
Z
longer than 8 hpb [see Fig. 6(a) here and Fig. 5(b) in Ref. 29]. 2β T τ
Note that K 2 is proportional to the reciprocal of the speckle flow K2 ¼
EQ-TARGET;temp:intralink-;e006;326;288 1 − jg1 ðτÞj2 dτ; (6)
T T
index,31 used in Ref. 29. Although this similarity is not unex- 0
pected (as both spatial LSI and stLASCA use spatial sampling of
speckle to measure the speckle contrast), stLASCA introduces a where β is a normalization coefficient (so-called coherence fac-
previously neglected correction of speckle contrast for static tor), T is the camera integration time, and g1 ðτÞ represents the
scattering in burn wounds, providing corrected estimates and normalized temporal correlation function of the static and
improved interpretation of nonperfusion and perfusion informa- dynamic electric fields and is given by9,10,33
tion on the wounds in terms of the static-to-dynamic scattering
composition ratio and blood perfusion, respectively [see Figs. 6 g1 ðτÞ ¼ ð1 − ρÞjgd ðτÞj þ ρ;
EQ-TARGET;temp:intralink-;e007;326;194 (7)
(b) and 6(c)]. Note that the difference between the speckle con-
trast results here and in Ref. 29 at times ≤8 hpb may be asso-
ciated to different porcine models and burn infliction techniques where gd ðτÞ is the normalized temporal correlation function of
used. the dynamic electric field (with characteristic decay time of τc )
and ρ is the fraction of total light intensity that is statically back-
scattered and reads as
4 Conclusions
Is
We have demonstrated a noninvasive and contactless camera- ρ¼ ; (8)
Is þ Id
EQ-TARGET;temp:intralink-;e008;326;113
phone stLASCA imaging system for assessing burn severity
Journal of Biomedical Optics 086009-8 August 2015 • Vol. 20(8)
Downloaded From: https://www.spiedigitallibrary.org/journals/Journal-of-Biomedical-Optics on 17 Sep 2021
Terms of Use: https://www.spiedigitallibrary.org/terms-of-useRagol et al.: Static laser speckle contrast analysis for noninvasive burn diagnosis using a camera-phone imager
where I s and I d are the mean intensities of light scattered from 8. B. Choi, N. M. Kang, and J. S. Nelson, “Laser speckle imaging for
the static and dynamic scatterers in the imaged medium, respec- monitoring blood flow dynamics in the in vivo rodent dorsal skin
fold model,” Microvasc. Res. 68(2), 143–146 (2004).
tively. By substituting Eq. (7) into Eq. (6), K 2 can be written as
9. P. Zakharov et al., “Quantitative modeling of laser speckle imaging,”
Z
τ
Opt. Lett. 31(23), 3465–3467 (2006).
2β T
10. P. Zakharov et al., “Dynamic laser speckle imaging of cerebral blood
K 2 ¼ ð1 − ρÞ2 jg ðτÞj2 dτ
1−
T d
EQ-TARGET;temp:intralink-;e009;63;719
T0 flow,” Opt. Express 17(16), 13904–13917 (2009).
Z
2β T τ 11. A. B. Parthasarathy et al., “Robust flow measurement with multi-
þ 2ρð1 − ρÞ 1 − jgd ðτÞjdτ þ βρ2 ; (9) exposure speckle imaging,” Opt. Express 16(3), 1975–1989 (2008).
T 0 T 12. A. B. Parthasarathy, S. M. Kazmi, and A. K. Dunn, “Quantitative
imaging of ischemic stroke through thinned skull in mice with multi
where the first two terms on the right hand side of Eq. (9) com- exposure speckle imaging,” Biomed. Opt. Express 1(1), 246–259
prise the dynamic (perfusion) part of the squared speckle con- (2010).
13. D. Zölei et al., “Multiple exposure time based laser speckle contrast
trast, K 2d , and the third term represents the static (nonperfusion)
analysis: demonstration of applicability in skin perfusion measure-
component of K 2 , denoted by K 2s . To evaluate K 2s , assume that ments,” Photonics Optoelectron. 1(2), 28–32 (2012).
the camera frame rate T −1 0 satisfies T 0 ≫ τc , and thus the spatial 14. I. Remer and A. Bilenca, “Laser speckle spatiotemporal variance analy-
cross-correlation of two time-sequential speckle frames at zero sis for noninvasive widefield measurements of blood pulsation and pulse
spatial shift essentially includes only the static speckle compo- rate on a camera-phone,” J. Biophotonics (2015).
nent.9,10,34 Using the Siegert relation,34 K 2s can now be expressed 15. O. Yang and B. Choi, “Laser speckle imaging using a consumer-grade
as color camera,” Opt Lett. 37(19), 3957–3959 (2012).
16. L. M. Richards et al., “Low-cost laser speckle contrast imaging of
blood flow using a webcam,” Biomed. Opt. Express 4(10), 2269–2283
hIðtÞIðt þ T 0 Þi
K 2s ¼ g2 ðT 0 Þ − 1 ¼ − 1; (10) (2013).
hIðtÞihIðt þ T 0 Þi 17. D. Jakovels et al., “Mobile phone based laser speckle contrast imager for
EQ-TARGET;temp:intralink-;e010;63;549
assessment of skin blood flow,” Proc. SPIE 9421, 94210J (2014).
with g2 ðτÞ representing the normalized temporal intensity auto- 18. Laser Institute of America, American National Standard for Safe Use of
correlation function, IðtÞ being the speckle intensity recorded at Lasers, ANSI Z136.1–2007, American National Standards Institute,
New York (2007).
time t, and h i denoting spatial (or ensemble) averaging over an 19. http://www.gsmarena.com/sony_ericsson_xperia_arc-3619.php
observation window in space. Next, by substituting the value of 20. I. E. Richardson, The H.264 Advanced Video Compression Standard,
K s from Eq. (10) into Eq. (3) and calibrating β using a Teflon pp. 81–91, Wiley, Chichester (2010).
slab,9,10 the SDR of turbid media can be estimated. 21. J. D. Briers, G. Richards, and X. W. He, “Capillary blood flow mon-
Finally, to effectively assess the reciprocal of the speckle itoring using laser speckle contrast analysis (LASCA),” J. Biomed Opt.
correlation time, τ−1
c , in scattering media, assume the following
4(1), 164–175 (1999).
22. J. C. Ramirez-San-Juan et al., “Impact of velocity distribution assump-
normalized
pffiffiffiffiffiffiffi correlation functions gd ðτÞ ¼ e−jτj∕τc or gd ðτÞ ¼ tion on simplified laser speckle imaging equation,” Opt. Express
e− τ∕τc for samples with backscattering ballistic and diffusive 16(5), 3197–3203 (2008).
dynamics,9–12,34 respectively. Using the above models for gd ðτÞ 23. A. Sadhwani et al., “Determination of teflon thickness with laser
speckle. I. Potential for burn depth diagnosis,” Appl. Opt. 35(28),
in Eq. (9) with T ≫ τc , τ−1
c can readily be derived as Eq. (5). 5727–5735 (1996).
24. L. Wang and S. L. Jacques, “Use of a laser beam with an oblique angle
Acknowledgments of incidence to measure the reduced scattering coefficient of a turbid
medium,” Appl. Opt. 34(13), 2362–2366 (1995).
This work was financially supported by the Israel Ministry of 25. X. Wang and R. M. Kimble, “A review on porcine burn and scar
Economy through the Kamin program. I. R. gratefully acknowl- models and their relevance to humans,” Wound Pract. Res. 18(1),
edges the support of the Azrieli Foundation under the Israeli 41–49 (2010).
graduate studies fellowship program. 26. A. Papp et al., “The progression of burn depth in experimental burns: a
histological and methodological study,” Burns 30(7), 684–690 (2004).
27. T. W. Panke and C. G. McLeod, Pathology of Thermal Injury: A
References Practical Approach, Grune & Stratton, Florida (1985).
28. K. M. Cross, “Assessment of tissue viability in acute thermal injuries
1. D. A. Boas and A. K. Dunn, “Laser speckle contrast imaging in using near infrared point spectroscopy,” PhD Thesis, Univ. of Toronto
biomedical optics,” J. Biomed. Opt. 15(1), 011109 (2010). (2010).
2. A. F. Fercher and J. D. Briers, “Flow visualization by means of single- 29. A Ponticorvo et al., “Quantitative assessment of graded burn wounds
exposure speckle photography,” Opt. Commun. 37(5), 326–330 (1981). in a porcine model using spatial frequency domain imaging (SFDI)
3. H. Cheng and T. Q. Duong, “Simplified laser-speckle-imaging analysis and laser speckle imaging (LSI),” Biomed. Opt. Express 5(10),
method and its application to retinal blood flow imaging,” Opt Lett. 3467–3481 (2014).
32(15), 2188–2190 (2007). 30. A. D. Jaskille et al., “Critical review of burn depth assessment tech-
4. H. Cheng, Y. Yan, and T. Q. Duong, “Temporal statistical analysis of niques: Part I. Historical review,” J. Burn Care Res. 30(6), 937–947.
laser speckle images and its application to retinal blood-flow imaging,” 31. O. Yang, D. Cuccia, and B. Choi, “Real-time blood flow visualization
Opt. Express 16(14), 10214–10219 (2008). using the graphics processing unit,” J. Biomed. Opt. 16(1), 016009
5. A. K. Dunn et al., “Dynamic imaging of cerebral blood flow using laser (2011).
speckle,” J. Cereb. Blood Flow Metab. 21(3), 195–201 (2001). 32. P. Miao et al., “High resolution cerebral blood flow imaging by regis-
6. T. Durduran et al., “Spatiotemporal quantification of cerebral blood flow tered laser speckle contrast analysis,” IEEE Trans. Biomed. Eng. 57,
during functional activation in rat somatosensory cortex using laser- 1152–1157 (2010).
speckle flowmetry,” J. Cereb. Blood Flow Metab. 24(5), 518–525 33. D. A. Boas and A. G. Yodh, “Spatially varying dynamical properties of
(2004). turbid media probed with diffusing temporal light correlation,” J. Opt.
7. N. Hecht et al., “Laser speckle imaging allows real-time intraoperative Soc. Am. A 14(1), 192–215 (1997).
blood flow assessment during neurosurgical procedures,” J. Cereb. 34. R. Bandyopadhyay et al., “Speckle-visibility spectroscopy: a tool to
Blood Flow Metab. 33(7), 1000–1007 (2013). study time-varying dynamics,” Rev. Sci. Instrum. 76, 093110 (2005).
Journal of Biomedical Optics 086009-9 August 2015 • Vol. 20(8)
Downloaded From: https://www.spiedigitallibrary.org/journals/Journal-of-Biomedical-Optics on 17 Sep 2021
Terms of Use: https://www.spiedigitallibrary.org/terms-of-useYou can also read