Computational flow cytometry as a diagnostic tool in suspected-myelodysplastic syndromes
←
→
Page content transcription
If your browser does not render page correctly, please read the page content below
Received: 11 January 2021            Revised: 6 April 2021          Accepted: 26 April 2021
DOI: 10.1002/cyto.a.24360

ORIGINAL ARTICLE

Computational flow cytometry as a diagnostic tool in
suspected-myelodysplastic syndromes

Carolien Duetz1    | Sofie Van Gassen2,3 | Theresia M. Westers1                                                                 |
Margot F. van Spronsen1 | Costa Bachas1 | Yvan Saeys2,3 |
Arjan A. van de Loosdrecht1

1
  Department of Hematology, Amsterdam
UMC, VU University Medical Center, Cancer                     Abstract
Center Amsterdam, Amsterdam, Netherlands                      The diagnostic work-up of patients suspected for myelodysplastic syndromes is chal-
2
 VIB Inflammation Research Center, Ghent
                                                              lenging and mainly relies on bone marrow morphology and cytogenetics. In this
University, Ghent, Belgium
3
  Department of Applied Mathematics,                          study, we developed and prospectively validated a fully computational tool for flow
Computer Science and Statistics, Ghent                        cytometry diagnostics in suspected-MDS. The computational diagnostic workflow
University, Ghent, Belgium
                                                              consists of methods for pre-processing flow cytometry data, followed by a cell popu-
Correspondence                                                lation detection method (FlowSOM) and a machine learning classifier (Random For-
Arjan A. van de Loosdrecht, Department of
Hematology, Amsterdam UMC, VU University                      est). Based on a six tubes FC panel, the workflow obtained a 90% sensitivity and
Medical Center, Cancer Center Amsterdam,                      93% specificity in an independent validation cohort. For practical advantages
Amsterdam, Netherlands.
Email: a.vandeloosdrecht@amsterdamumc.nl                      (e.g., reduced processing time and costs), a second computational diagnostic
                                                              workflow was trained, solely based on the best performing single tube of the training
Funding information
European Union's Horizon 2020 research and                    cohort. This workflow obtained 97% sensitivity and 95% specificity in the prospec-
innovation programme, Grant/Award Number:                     tive validation cohort. Both workflows outperformed the conventional, expert ana-
634789
                                                              lyzed flow cytometry scores for diagnosis with respect to accuracy, objectivity and
                                                              time investment (less than 2 min per patient).

                                                              KEYWORDS
                                                              diagnostic test, flow cytometry, hematological malignancies, machine learning,
                                                              myelodysplastic syndromes

1     |    I N T RO DU CT I O N                                                               marrow morphology and cytogenetics are mandatory in the diagnostic
                                                                                              work-up, however, these measurements do often not suffice for a
Myelodysplastic syndromes (MDS) are a group of malignant hemato-                              conclusive diagnosis. Cytopenic patients with normal cytogenetics
logical disorders characterized by cytopenia, bone marrow dysplasia                           and borderline dysplastic bone marrow features provide the main
and a heterogeneous disease course [1]. In the 2016 World Health                              challenge, and additional measurements or watch full waiting are fre-
Organization (WHO) classification of myeloid malignancies, dis-                               quently required [3, 4].
tinguishing MDS from reactive causes of cytopenia and dysplasia is                                Immunophenotypic assessment of bone marrow cells by flow
described as “one of the biggest challenges” [2]. Currently, both bone                        cytometry (FC) has shown to be instrumental to discriminate MDS
                                                                                              from non-neoplastic cytopenias [5]. MDS bone marrow frequently has
Yvan Saeys and Arjan A. van de Loosdrecht contributed equally to this work.                   an altered cell subset composition and hematopoietic cells express

This is an open access article under the terms of the Creative Commons Attribution-NonCommercial-NoDerivs License, which permits use and distribution in any
medium, provided the original work is properly cited, the use is non-commercial and no modifications or adaptations are made.
© 2021 The Authors. Cytometry Part A published by Wiley Periodicals LLC on behalf of International Society for Advancement of Cytometry.

Cytometry. 2021;1–11.                                                                                                     wileyonlinelibrary.com/journal/cytoa   1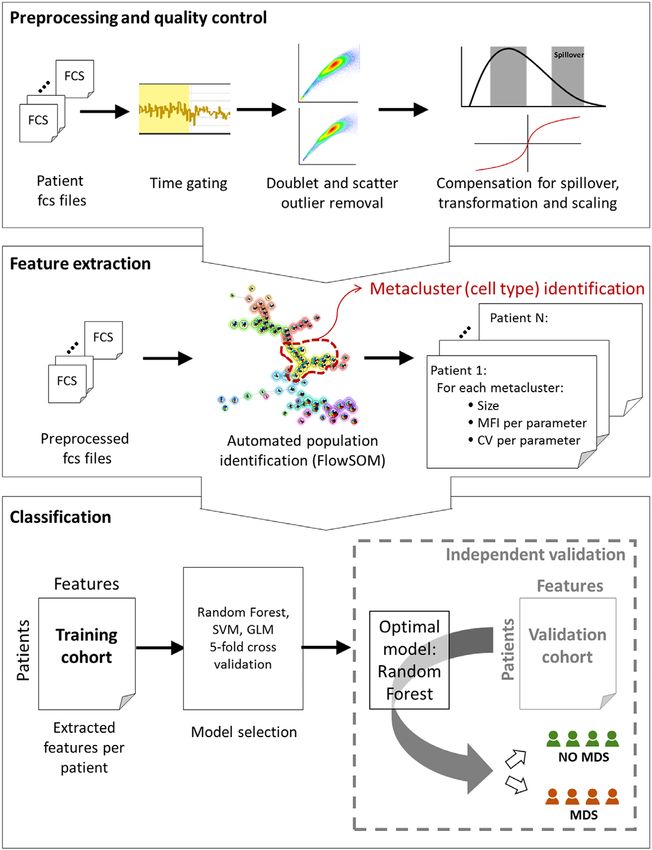
2                                                                                                                                       DUETZ ET AL.

aberrant levels of cells surface markers. Several diagnostic FC scores      The study was approved by the Medical Ethics Committee of VU Uni-
have been developed, that combine assessment of progenitor b-cells          versity Medical Center, Amsterdam, the Netherlands.
and myeloid progenitor percentages with evaluation of aberrant cell
surface marker expression on myeloid and erythroid cell populations
[6–10]. Despite their proven utility, FC scores may be improved in          2.2     |   Sample handling
terms of accuracy, objectivity, and required time-investment.
      In recent years, several machine learning based tools for cell pop-   All bone marrow samples were pre-processed and analyzed within
ulation detection in (flow) cytometry data have been developed [11].        24 h according to European Leukemia Net guidelines [5]. Bone mar-
These tools use clustering methods to group cells with similar expres-      row samples were collected in heparin and erythrocyte lysis was per-
sion patterns and thereby, allow for computational identification of        formed with ammonium chloride-based lysing solution. The staining
cell populations. One of the best performing methods is the algorithm       panel consisted of six 8-color FC tubes and is outlined in more detail
FlowSOM, that has a high reproducibility and concordance with man-          in Table S1. For every tube at least 100.000 leukocyte events were
ual analysis combined with a limited running time [12, 13]. In this         acquired using a FACS CantoII™ (BD Biosciences). FC equipment set-
study, we developed a computational workflow for MDS diagnosis,             tings were generated in a highly standardized fashion, following guide-
combining FlowSOM and a machine learning classifier [13–15].                lines of Euroflow [16]. Standard operating procedures were followed
Thereby, we aimed to improve accuracy, objectivity and ease of use          to assess FC data, including standardized flow cytometer set up, per-
of flow cytometry based MDS diagnostics. In addition, using these           formance checks and generation of compensation settings (for details
data driven unbiased approach, we investigated which cellular proper-       on these general laboratory procedures we refer to Cloos et al. [17]).
ties matter most to diagnose patients suspected for myelodysplastic         Expert analysis of MFC data were performed following ELN guidelines
syndromes.                                                                  for two diagnostic MDS FC scores, the Ogata score and the integrated
                                                                            flow cytometry score (iFS) [7, 10]. Sample handling and analysis of
                                                                            flow cytometry standard (fcs) files was previously described in more
2     |       MATERIALS AND METHODS                                         detail by Cremers et al. and Alhan et al. [10, 18].

2.1       |    Patients
                                                                            2.3 | Computational diagnostic workflow:
We included 230 patients, grouped into the following categories:            Preprocessing, computational cell population
MDS patients, patients with a non-neoplastic cytopenia and age-             detection and classification for disease status
matched controls (non-cytopenic, no hematological disease); age-
matched controls and patients with a non-neoplastic cytopenia are           First, we optimized fcs files for computational analysis in fully auto-
further referred to as controls. All patients were subjected to a full      mated fashion. High quality events were selected using the R package
diagnostic work-up for MDS at the Amsterdam UMC, location                   FlowAI, the FlowAI package evaluates flow rate abnormalities, out of
VUmc. Patients without clinical follow-up data and insufficient             dynamic range expression signals and parameter stability [15]. In total,
bone-marrow samples were excluded. Diagnosis was established                0.1% to 26.3% (median of 2.0%) cells were removed by FlowAI per
based on clinical characteristics at diagnosis and follow-up,               tube, in over 90% of all tubes less than 5% of cells were removed.
cytomorphology, cytogenetics, pathology and biochemical indica-             Subsequently, cells with extreme values in scatter parameter and dou-
tors. In case FC results were used to establish diagnosis, a                blets were excluded using the R package FlowCore [19] (Text S1).
hemato(patho)logist reevaluated all other diagnostic parameters to          After the FlowAI check, singlet selection and scatter outlier removal,
assess whether MDS diagnosis could be confirmed without includ-             all fcs files harbored at least 40.000 cells. In order to optimize data
ing FC results.                                                             distribution and range for computational analysis, hyperbolic arcsine
      The total cohort consists of cases used to develop the computa-       transformation with a cofactor of 150 and approximated min-max
tional workflow, further referred to as the training cohort, and cases      scaling per parameter were applied (Text S2).
used to prospectively validate the computational workflow, further                In the next stage of the computational diagnostic workflow, we
referred to as the validation cohort. To develop a diagnostic workflow      applied FlowSOM—an algorithm for cell population detection in cyto-
focused on the most difficult to diagnose MDS patients, only MDS            metry data—to the fcs files of the training cohort. FlowSOM groups
patients without excess of blasts (EB) were included in the training        cells with similar expression patterns into nodes and subsequently
cohort (n = 67). The training cohort consisted of patients (n = 148)        groups nodes with similar expression patterns in metaclusters that
included between March 2013 and August 2017, the prospective vali-          resemble larger cell populations. The number of nodes was set to
dation cohort consisted of patients (n = 57) included between               225 clusters (grid size of 15  15) and the number of metaclusters
September 2017 and August 2018. We included an additional valida-           to 30. Per file 40.000 cells were included in an aggregate for the
tion cohort with MDS EB patients (n = 25) to evaluate diagnostic per-       FlowSOM analysis. Subsequently, all cells were mapped on
formance in this MDS subgroup. Table 1 summarizes the                       the FlowSOM to compute metacluster percentages, mean fluorescent
characteristics of the patients in the training and validation cohorts.     intensity (MFI) and coefficient of variation (CV) per file. To validate
DUETZ ET AL. 3
T A B L E 1 Patient characteristics of
A. Patient characteristics training cohort
the training and validation cohorts
Control (n = 81) MDS (n = 67)
Age (median) 64 (19–91) 71 (21–94)
Sex (m/f) 43/38 50/17
Diagnoses Deficiencies/blood loss (n = 18) WHO MDS-SLD (n = 2)
Immune mediated cytopenia (n = 14) MDS-RS-SLD (n = 6)
Spontaneous recovery (n = 19) MDS-MLD (n = 32)
Drug induced (n = 4) MDS-RS-SLD (n = 17)
Alcohol intoxication (n = 4) MDS-U (n = 7)
BM Infiltration solid tumor (n = 1) Isolated del5q (n = 3)
Hemolytic anemia (n = 1) IPSS-R Very low (n = 13)
Cyclic neutropenia (n = 4) Low (n = 29)
Other (n = 4) Intermediate (n = 13)
Healthy donors (n = 12) a
High (n = 5)
Very high (n = 2)
Insufficient data (n = 5)
B. Patient characteristics validation cohort
Control (n = 27) MDS (n = 30)
Age (median) 71 (43–88) 66 (34–78)
Sex (m/f) 15/12 18/12
Diagnoses Deficiencies/blood loss (n = 5) WHO MDS-SLD (n = 3)
Immune-mediated cytopenia (n = 4) MDS-RS-SLD (n = 1)
Spontaneous recovery (n = 3) MDS-MLD (n = 16)
Drug induced (n = 2) MDS-RS-MLD (n = 6)
Alcohol intoxication (n = 1) MDS-U (n = 1)
Splenomegaly (n = 1) Isolated del5q (n = 3)
Chronic neutropenia(n = 3) IPSS-R Very low (n = 3)
Healthy donors (n = 8)a Low (n = 17)
Intermediate (n = 3)
High (n = 3)
Very high (n = 0)
Insufficient data (n = 4)
C. Patient characteristics validation cohort MDS with excess of blasts
MDS (n = 25)
Age (median) 72 (51–82)
Sex (m/f) 20-mei
Diagnosesa WHO MDS-EB 1 (n = 11)
MDS-EB 2 (n = 14)
IPSS-R Intermediate (n = 10)
High (n = 6)
Very high (n = 8)
Insufficient data (n = 1)
Abbreviations: del5q, with an isolated deletion of 5q; EB, excess of blasts; IPSS-R, Revised International
Prognostic Scoring System; MDS, myelodysplastic syndrome; MLD, multi lineage dysplasia; RS, ring
sideroblasts; SLD, single lineage dysplasia; U, undefined; WHO, World Health Organization
Classification 2016.
a
Healthy controls were age-matched non-cytopenic volunteers without a hematological disease.4 DUETZ ET AL.
performance of the FlowSOM method, we studied the expression pat- TABLE 2 Basic workflow and optional adaptations
terns of the computationally identified cell populations using conven- Required approaches Optional adaptations
tional expert analysis by sequential gating in bivariate plots. In
Stage 1. Quality control
addition, we evaluated concordance with expert analysis by compar- Preprocessing (FlowAI) [15]
ing abundancy of several cell subsets (lymphocytes, myeloid progeni- and quality Doublet removal
tors, neutrophils, erythroid cells, plasmacytoid dendritic cells and control
Removal of extreme
basophils) identified by expert analysis and FlowSOM. Finally, we values in light
mapped fcs files annotated with expert identified cell populations on scatters
the FlowSOM models and the Jaccard index was calculated to evalu- Hyperbolic arcsine
ate concordance. transformation
For the diagnostic workflow, the following cellular features were Approximated min-
extracted from the clusters and metaclusters of the FlowSOM analysis max scaling
per patients: abundance relative to the total number of cells, mean Stage 2. Feature Unsupervised Features derived
extraction clustering on cell from metaclusters
fluorescence intensity (MFI) per parameter and coefficient of variation
level (FlowSOM) versus features
(CV) per parameter. [13] derived from
Based on the features extracted from the computationally identi- clusters and
Feature extraction
fied cell populations, we trained three machine-learning classifiers to per case metaclusters
distinguish MDS patients from controls: a Random Forest classifier Stage 3. Classification for Number of features,
[14], a Support Vector Machine (SVM) classifier [20], and Generalized Classification disease status by all versus 200
Linear Mixed models [21]. To evaluate whether feature selection machine learning versus 50
improved model performance, we performed feature selection using Classification by RF
[14] versus SVM
the top 200 and top 50 variables identified by minimum redundancy
[33] versus GLM
maximum relevance (MRMR) importance measures and the highest
[21]
values of the Gini index derived from RF [22, 23]. We used standard
Note: For each stage, the basic workflow consisted of fixed approaches
settings for SVM, glmnet and RF, except for the number of trees in RF
and optional adaptations. The fixed approaches were not evaluated for
algorithm (10.000). superior performance, the optional adaptations were evaluated for
superior performance to develop the optimal computational workflow.
Abbreviations: GLM, generalized linear mixed models; MRMR, minimum
redundancy maximum relevance; RF, random forest; SVM, support vector
2.4 | Optimization and evaluation of the
machine.
computational diagnostic workflow in the training
cohort
Currently used expert analyzed FC scores are less sensitive in
To select the best features from the FlowSOM analysis and the best MDS cases without specific morphologic or cytogenetic aberrancies
performing machine learning classifier, we performed five-fold cross and in low risk disease. Therefore, we evaluated performance in MDS
validation in the training cohort. An overview of the explored options with or without ring-sideroblasts, MDS with or without cytogenetic
is summarized in Table 2. For the initial optimization and evaluation of aberrancies in the combined cohorts and in revised international prog-
the computational workflow, we used all six tubes of the FC panel. nostic scoring system (IPSS-R) defined risk groups.
Subsequently, we aimed to identify the best performing single tube,
as a single tube approach would be advantages with regard to anti-
body costs and processing time. Hereto, we trained the computational 2.5 | Identification of the most relevant features
workflow based on all tubes separately and evaluated diagnostic in the training cohort
accuracy.
We assessed performance using receiver operating characteristic To gain insight in the diagnostic workflows, the top 50 and top
(ROC) curve analysis, the area under the curve (AUC), sensitivity and 10 most important features for discriminating between MDS patients
specificity. Clinical diagnosis, established as described above, was and controls were identified based on the highest values of the Gini
used as reference standard. Accuracy and practical aspects of both index derived from RF [22]—the Gini index reflects the contribution
computational diagnostic workflows were compared with two manu- of a feature to the accuracy of the RF analysis. Subsequently, we stud-
ally analyzed diagnostic FC scores, the iFS and the Ogata score. Prac- ied what type of features (i.e., scatter parameters, fluorescent parame-
tical aspects included the required amount of antibodies and bone ters or abundancy) were present in the top 50 most relevant features.
marrow cells, and time required for analysis. For the iFS and the Ogata For the top 10 features, we performed an additional validation step:
score, time required for analysis was measured 10 times for two expe- the top 10 features were reanalyzed manually in all files of the train-
rienced technicians. ing cohort, correlated with the computationally identified features
and compared between MDS patients and controls.DUETZ ET AL. 5
2.6 | Prospective validation of diagnostic accuracy groups. We found negligible differences in accuracy between these
and most relevant features groups for both the single-tube and six-tube workflows (Table S4). In
the second validation cohort concerning MDS patients with EB, a sensi-
To prospectively validate diagnostic accuracy, we trained the single- tivity of 100% was obtained.
tube and six-tube workflows using all cases of the training cohort. In a next step, we compared the accuracy of both workflows with
Subsequently, raw fcs files of the validation cohort were two expert analyzed flow cytometry scores: the Ogata score and the iFS.
preprocessed, mapped on the FlowSOM and classified as control or Compared to the iFS, the six tubes workflow had a significantly improved
MDS based on the RF trained on the training cohort cases. specificity (p = 0.013) and the single tube showed a trend towards an
Sensitivity and specificity were calculated as described for the increased specificity (p = 0.077). Both workflows showed a trend towards
training cohort. In an additional validation step, we compared the improved sensitivity (six tubes p = 0.064 and single tube p = 0.078).
most relevant features—identified in the training cohort—with Compared with the Ogata score, both computational workflows had a
the same features in the validation cohort. significantly improved sensitivity (six tubes and single tube p < 0.001). In
addition, the six tubes workflow showed a trend towards improved speci-
ficity (six-tube p = 0.070 and single tube p = 0.27).
3 | RESULTS With regard to the practical aspects of the computational
workflows, total analysis time was reduced from a median of 60 min
3.1 | Computationally identified and expert (range: 45–90 min) for the iFS approach and 10 min (range: 8–15 min)
analyzed cell populations show a high concordance for the Ogata score, to less than 3 min for the six-tubes computational
diagnostic workflow and less than 30 seconds for the single-tube
To evaluate performance of FlowSOM in the training cohort, we computational diagnostic workflow. Introduction of the single-tube-
assessed cell populations identified by FlowSOM for marker expres- computational diagnostic workflow in the diagnostic work-up of MDS
sion and examined bivariate expression plots (Figures S1 and S2). would reduce antibodies and bone-marrow cells needed with 86%
Based on these assessments, we concluded that FlowSOM identified compared with the iFS.
major cell subsets including neutrophils, monocytes, progenitor cells
(myeloid, erythroid and lymphoid), basophils and plasmacytoid den-
dritic cells. In addition, several cell populations with unfamiliar expres- 3.3 | Evaluation of the cellular characteristics most
sion patterns were encountered (e.g., CD36+/CD71 /CD105+ cells, relevant for diagnosis
and CD36+/CD71+/side scatter high). Subsequently, we compared
abundancy of cell populations identified by FlowSOM and cell In order to give insight into the cellular features contributing most to
populations identified by expert analysis. Computational and expert the accuracy of the computational diagnostic workflows, we identified
analysis showed a high concordance ( Table S2, Figure S3). the top fifty and top 10 features with the highest discriminative power
based on the Random Forest-derived variable importance measure
based on the Gini index for both the six-tube and the single-tube
3.2 | The computational diagnostic workflows workflow (Table S5, Table 4) [22]. Fifty percent of the top 50 features
outperform currently used FC scores of the single-tube and six-tube workflow concerned scatter parame-
ters, 45% fluorescence parameters and 5% abundancy parameters.
In the training cohort, we selected the best performing computational Subsequently, we evaluated whether the top 50 parameters are
workflow based on diagnostic accuracy (AUC, sensitivity and specificity) included in currently used diagnostic flow cytometry scores—iFS,
in the five-fold cross validation. The best performing workflow is visual- FCSS, Ogata score, Red score. This was the case for 29% of all top
ized in Figure 1, and consists of FlowSOM metacluster features and the 50 features (Table S5).
machine learning classifier Random Forest without prior feature selec- As a validation step, we identified the top 10 most discriminative
tion (Table 3). The workflow based on all six-tubes of the FCM panel, cellular features by re-analyzing all fcs files manually to evaluate concor-
reached a sensitivity and specificity of 90% and 96%, respectively, and dance with computational analysis. All manually analyzed features corre-
an AUC of 0.969 (CI 0.945–0.993) (Table 3). Subsequently, we evalu- lated significantly with the computationally identified features, and
ated which single tube reached the highest diagnostic accuracy. Tube differed significantly between MDS patients and controls (Table S6).
3, developed to assess erythroid dysplasia, obtained the highest diag- Computationally identified erythroid and myeloid progenitors proved
nostic accuracy, reaching a sensitivity and specificity of 85% and 95%, to be most relevant for diagnosis, as these cell populations harbored the
respectively, with an AUC of 0.964 (CI 0.937–0.991) (Table 2) most discriminative features (Table 4). Increased side scatter of erythroid
(Table S3). We assessed accuracy of both the six-tube and the single- cells in the poly- and orthochromatic stage (CD36+/CD71+/CD105-/
tube workflow in several MDS subgroups (i.e., MDS with or without ring CD117-/CD34-) was the most discriminative feature to separate patients
sideroblasts and MDS with or without cytogenetic aberrancies, revised with MDS from controls. Remarkably, in the six-tubes workflow, three
international prognostic scoring system (IPSS-R) subgroups), as diagnos- features derived from tube four, five and six, reflected a relatively high
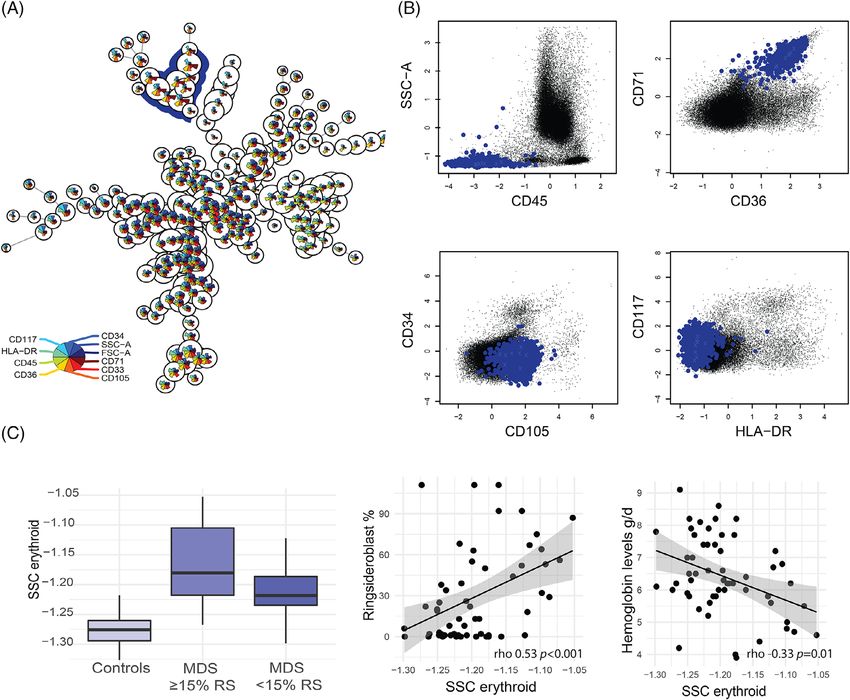
tic accuracy of traditional flow cytometry score may vary between these side scatter in MDS derived from a cell population that could represent a6 DUETZ ET AL. F I G U R E 1 Flowchart of the computational diagnostic workflow. All three stages of the computational diagnostic workflow are visualized in the flowchart. In Stage 1, fcs files were preprocessed to ensure high quality data required for computational analysis. In Stage 2, unsupervised clustering was performed on cell level by the FlowSOM algorithm to automatically identify cell types and generate features per case. FlowSOM grouped cells in clusters, represented by the nodes in the depicted FlowSOM tree, and subsequently, grouped the clusters into metaclusters, indicated by the background coloring. Per case the following features were extracted from the FlowSOM analysis: metacluster abundancy, mean fluorescence intensity (MFI) and coefficient of variation (CV) for all parameters of the metaclusters. In Stage 3 of the best performing workflow, these features were supplied to the classification algorithm random forest (RF) to differentiate MDS from controls. Support vector machine (SVM) and Lasso and Elastic-Net Regularized Generalized Linear Models (GLM) were also evaluated in a five-fold cross validation, however, they were outperformed by RF. *fcs = flow cytometry standard, MFI = mean fluorescence intensity, CV = coefficient of variation, SVM = support vector machine, GLM = Lasso and Elastic-Net Regularized Generalized Linear Models, MDS = myelodysplastic syndromes similar cell type. In order to evaluate whether these features reflected a MDS patients (Figure 2). As an increased SSC of erythroid cells was not similar cellular characteristic, correlations between these features were previously identified as relevant parameter in MDS-FC, we evaluated this calculated using the Spearman's rank correlation coefficient (two-tailed); feature in several MDS subgroups (i.e., low and high risk disease, with or all features showed a strong and significant correlation (rho 0.69–0.96, without cytogenetic aberrancies and with or without ring sideroblasts). p < 0.0001). Notably, this particular erythroid cell population also har- We found an increase in all MDS groups as compared with controls, yet bored the 4th and 10th most discriminative feature from the single tube most pronounced in patients with ring sideroblasts. In MDS patients, the workflow; the CV of CD71 and CD36, which were both increased in side scatter of erythroid cells correlated significantly with the percentage
DUETZ ET AL.                                                                                                                                                7

TABLE 3           Comparison of performance of expert flow cytometry scores and the computational diagnostic workflows

                           Expert scores               Computational diagnostic workflow

                           Ogata score      iFS        Six tubes                                                                      Single tube
  Training cohort                                      SVMa                      GLMa                        RF                       RF
  Sensitivity              69%              81%        94%                       85%                         90%                      85%
  Specificity              89%              86%        89%                       93%                         96%                      95%
  AUC                      -                -          0.96 (CI 0.93–0.99)       0.90 (CI 0.85–0.95)         0.97 (CI 0.95–0.99)      0.96 (CI 0.94–0.99)
  Validation cohort
                                                       a                         a
    Sensitivity            67%              80%         -                            -                       90%                      97%
                                                       a                         a
    Specificity            89%              85%         -                            -                       93%                      95%

Abbreviations: GLM, lasso and elastic-net regularized generalized linear models; iFS, integrated flow score; RF, random forest; SVM, support vector
machine.
a
 Accuracies of SVM and GLM with optimized feature selection (50 features for SVM selected by MRMR, all features for GLM).

of ring sideroblasts side scatter (rho 0.53, p < 0.001) and hemoglobin                   As an additional validation step, we studied the most discrimina-
levels (rho 0.33, p = 0.01) (Figure 2C).                                        tive cellular features of the training cohort in the validation cohort.
    The third most discriminative feature of the six-tube workflow              Cellular features of MDS patients of the training cohort were similar
and the second in the single-tube workflow was the median CD117                 in 16 out of 20 features in the validation cohort, in controls these fea-
expression on a cell population with immature erythroid blast-like              tures were similar in all cases (p > 0.05) (Figure S4). Interestingly, the
marker       expression   (CD36+/CD71+/CD117+/CD105+/CD34+),                    four features that were significantly different between MDS patients
that was relatively low in MDS. The seventh most discriminative fea-            in the training cohort and the validation cohort were even more dis-
ture of the six-tube workflow was a low CD117 expression in MDS                 criminative from controls in the validation cohort compared with the
on similar erythroid-like cells derived from tube six. This feature was         training cohort. Eighteen out of 20 cellular features that were identi-
significantly correlated with the feature derived from tube three (rho          fied as discriminative between MDS and controls in the training
0.815, p < 0.001), indicating once more that these features were likely         cohort, differed significantly between MDS and controls in the valida-
derived from similar cell subsets. Notably, this cell population was            tion cohort (p < 0.05) as well.
characterized by a granulocyte-like side scatter (both in MDS and con-
trols) which has not been described for erythroid cells in literature
before. Further analysis and cytomorphology of the sorted population            4        |   DI SCU SSION
indicated that this subset with high side scatter was an artifact
induced by our ammonium-chloride based erythrocyte lysing method                The diagnostic work-up in suspected MDS is challenging and heavily
(data not shown). In order to ensure that the workflow did not depend           relies on morphology and cytogenetics. In this study, we developed a
on this artificially-induced population, we recalculated sensitivity and        computational diagnostic workflow for flow cytometry to aid in dis-
specificity when excluding this cell population from classification. The        tinguishing       myelodysplastic    syndromes     from     non-neoplastic
changes in accuracy were negligible (Table S7).                                 cytopenias. By combining algorithms for pre-processing (FlowAI), fea-
    Two discriminative features were not derived from myeloid or                ture generation (FlowSOM) and classification (Random Forest), we
erythroid cell populations; the side scatter of HLA-DR negative lym-            established a completely automated and accurate diagnostic tool.
phocytes and the forward scatter on HLA-DR positive lymphocytes.                         We first optimized and evaluated the computational workflow
Both features were increased in patients with myelodysplastic syn-              based on six tubes of the FC panel, reaching a sensitivity and specific-
dromes compared with controls.                                                  ity of 90% and 93%, respectively, in the validation cohort concerning
                                                                                MDS patients without EB and controls. Subsequently, we identified
                                                                                the best performing single tube, as a single-tube approach has practi-
3.4 | Diagnostic accuracy and most relevant                                     cal advantages with regard to processing time and materials required.
cellular features were confirmed in an independent                              In the prospective validation cohort, the single tube workflow
prospective validation cohort                                                   obtained a 97% sensitivity and 95% specificity. Thereby, the computa-
                                                                                tional workflows showed (a trend towards) significantly increased
Finally, we validated performance of both workflows in the indepen-             accuracies compared with expert analyzed flow cytometry scores
dent prospective validation cohort. In the validation cohort, perfor-           (i.e., the Ogata score and the integrated flow cytometry score). In a
mance for the six-tubes computational diagnostic workflows                      second validation cohort concerning MDS patients with EB a sensitiv-
resulted in 90% sensitivity and 93% specificity, and for the single-            ity of a 100% was obtained for both workflows, illustrating high diag-
tube computational diagnostic workflow 97% and 95%, respectively                nostic accuracy across all MDS subtypes. In addition, analysis time for
(Table 3).                                                                      the computational workflows was less than 3 min and implementation
8 DUETZ ET AL.
TABLE 4 Identification of the cellular features most relevant for diagnosis
Six-tube
Populations Parameter (in MDS) Relative marker expression based on marker enrichment modeling (MEM) Tube
1. Erythroid progenitors SSC Mean (high) CD71+ CD36+, CD105 , CD117 , CD33 , CD45 , FSC-A , SSC-A , 3
HLA-DR , CD34
2. Erythroid progenitors SSC mean (high) CD71+ CD235a+, CD45 FSC-A SSC-A HLA-DR CD7 CD13 CD34 6
3. Lysis artifact CD117 MFI (low) CD105+, CD71+, CD117+, CD36+, SSC-A+, FSC-A+, HLA-DR , CD34 , 3
CD33 , CD45
4. Lymphocytes SSC Mean (high) CD45+, CD117 , CD13 FSC-A , CD11b , SSC-A , CD34 , HLA-DR , CD16 , 1
CD10 ,
5. Progenitor FSC mean (high) HLA-DR+, CD34+, CD117+/ , FSC-A+/ , SSC-A , CD64 , CD45+/ CD2 , 2
IREM2
6. Erythroid** SSC mean (high) CD15 , FSC-A , HLA-DR , CD45 , SSC-A , CD25 , CD123 , CD38 , CD34 , 5
CD117
7. Lysis artifact CD117 MFI (low) CD71+, CD117+, SSC-A+, CD7 , CD34 , CD13 , FSC-A+, HLA-DR , 6
CD235a , CD45
8. Lymphocytes FSC mean (high) HLA-DR+ CD45+/ , CD64 , SSC-A , FSC-A , CD2 , CD34 , CD117 , 2
IREM2
9. Myeloid Progenitor HLA-DR CV (low) CD34+, CD117+, HLA-DR+, CD33+/ , CD71 , FSC-A+/ , CD36 , CD105 , 3
SSC-A , CD45
10. Erythroid** SSC mean (high) SSC-A , CD45 , FSC-A , HLA-DR , CD5 , CD56 , CD7 , CD34 , CD117 , 4
CD19
Single-tube
Populations Parameter (in MDS) Relative marker expression based on marker enrichment modeling (MEM) Tube
1. Erythroid progenitor SSC Mean (high) CD71+, CD36+, CD105 , CD117 , CD33 , CD45 , FSC-A, SSC-A, HLA-DR , 3
CD34
2. Lysis artifact CD117 MFI (low) CD105+, CD71+, CD117+, CD36+, SSC-A, FSC-A+/ , HLA-DR , CD34 , 3
CD33 , CD45
3. Early erythroid progenitor FSC-A mean (high) CD105+, CD71+, CD117+, CD36+, FSC-A , HLA-DR+, CD33 , SSC-A , 3
CD34 , CD45
4. Erythroid progenitor CD71 CV (high) CD71+, CD36+, CD105 , CD117 , CD33 , CD45 , FSC-A , SSC-A , HLA- 3
DR , CD34
5. Early erythroid progenitor FSC-A mean (high) CD117+, CD105+, CD36+, CD71+, FSC-A+, HLA-DR+, CD34+, CD33 , SSC- 3
A , CD45
6. Myeloid progenitor HLA-DR CV (low) CD34+, CD117+, HLA-DR+, CD33+/ , CD71-, FSC-A+/ , CD36 , CD105 , 3
SSC-A , CD45+/
7. Myeloid progenitor HLA-DR CV (low) HLA-DR+, CD34+, CD117+, CD71 , CD36 , CD105 , CD33 , FSC-A , SSC- 3
A , CD45
8. Progenitor SSC mean (high) CD34+, HLA-DR+/ , CD117+/ , CD105 CD71 , SSC-A , CD33 , CD45+/ , 3
FSC-A , CD36
9. Myeloid progenitor SSC Mean (high) HLA-DR+, CD34+, CD117+, CD71 , CD36 , CD105 , CD33 , FSC-A , SSC- 3
A , CD45
10. Erythroid progenitor CD36 CV (high) CD71+, CD36+, CD105 CD117 , CD33 , CD45 , FSC-A , SSC-A , HLA- 3
DR , CD34
Abbreviations: CV, coefficient of variation; FSC, forward light scatter; SSC, sideward light scatter.
**Features derived from the same erythroid cell population.
of the single-tube workflow will reduce monoclonal antibody usage diagnostic workflows in these subgroups [7, 10]. We did not find rele-
with 86% compared with the iFS score. Based on the high accuracies vant differences in accuracy between these and other MDS cases
and practical advantages, we suggest to focus further studies on the without excess of blasts, which implies that this method is useful in
single tube approach. the most difficult to diagnose MDS patients. Note, the number of
As diagnostic FC scores, in particular the Ogata score, have shown patients in the subgroups were small which may limit the analysis.
to be less sensitive in cases without specific morphologic or cytoge- The improved accuracy compared with traditional MDS FC scores
netic aberrancies and in low risk disease, we compared accuracy of the may partially be explained by the application of novel computationalDUETZ ET AL. 9
analysis methods for FC data. Computational tools, such as FlowSOM, features. The most discriminative computationally identified feature
are not hampered by upfront knowledge or assumptions and can there- was a high side scatter of maturing erythroid cells in MDS patients
fore be applied to approach FC data in an unbiased fashion. This advan- that has not been described previously. The increased side scatter
tage has up till now mainly been used to detect novel cell (sub) may be partially explained by the presence of ring sideroblasts, as the
populations in flow and mass cytometry data [24]. However, in this study SSC correlated significantly with the percentage of ring sideroblasts.
we showed that it can also be a valuable approach to increase diagnostic Yet, also patients with less than 15 percent ring, sideroblasts showed
accuracy by detecting novel features with discriminative power. an increased erythoid side scatter, indicating that other dysplastic
In order to give insight in the computational workflows, we stud- characteristics for example, multinucleation and cytoplasmic
ied the most diagnostically relevant features. The top 10 features vacuolization contribute to an increased side scatter. The same cell
showed a high accordance with expert analysis, thereby confirming population also harbored two other relevant features; the coefficients
that the features were not a result of a potential artifact caused by of variation of CD36 and CD71. Both were previously recognized as
scaling or computational analysis. Interestingly, erythroid cells and diagnostically relevant and are incorporated in multiple expert-
myeloid progenitors contained the most diagnostically relevant analyzed FC scores including the iFS [9, 10].
F I G U R E 2 Characteristics of the most discriminative cell population. (A) The minimal spanning tree represents the computationally detected
populations using the FlowSOM method for tube three (CD71, CD36, CD105, CD117, CD33, CD45, HLA-DR, CD34). The nodes harbor cell
subpopulations with similar expression patterns (visualized in the plot pies). The group of clusters highlighted by the blue background coloring
represents the erythroid population, CD36 and CD71 positive and CD105 negative, that proved to be important for discriminating between MDS
and controls. (B) The computationally detected population depicted in blue represents the erythroid cells that harbor the most relevant features
for discriminating between MDS patients and controls (plots from one representative patient). (C) In the left panel, the erythroid sidescatter of
controls and MDS patients with and without >15% ring sideroblasts are depicted. In the middle and the right panel, correlation of the erythroid
sidescatter with ring sideroblasts and hemoglobin levels are depicted for all MDS patients. Expression parameters underwent hyperbolic arcsine
transformation and approximated min-max scaling (Text S2)10 DUETZ ET AL.
Myeloid progenitors harbored several relevant features as well, accuracy without scatter parameters: for example, include (more
including an increased forward scatter, indicating larger cell size, and a comprehensive) panels for lymphocyte and progenitor subsets,
reduced coefficient of variation of HLA-DR in MDS. The latter may be and further tuning of FlowSOM parameters and machine learning
explained by the clonal nature of the MDS progenitors and thereby, classifiers. An alternative option for multicenter validation is to
reduced phenotypic heterogeneity resulting in a lower CV as has been train the workflow on data acquired in every center separately,
previously described for CD117 [8]. this would only require standardization within centers.
Remarkably, two diagnostically relevant features were derived To summarize, our work presents the first successful machine
from lymphocytes, HLA-DR negative lymphocytes showed an learning-based application for FC to distinguish between MDS and
increased side scatter, whereas HLA-DR positive lymphocytes showed non-neoplastic cytopenias, that improves upon currently used flow
an increased forward scatter in MDS. This may reflect a different cytometry diagnostic tools. In addition to the improvements in accu-
functional state of lymphocytes or a different lymphocyte subset dis- racy, the computational workflow is fast, objective, needs fewer
tribution [25]. The increased SSC may be explained by an increased reagents, and offers novel insights into which cellular properties con-
number of NK-cells harboring lytic granules in MDS patients, since we tribute to diagnoses of MDS patients.
observed significantly higher percentages of NK cells (CD56+, CD5 ,
CD45+) in tube four (Cluster 14, p = 0.002). Although interesting, it ACKNOWLEDG MENTS
was beyond the scope of this study to further investigate this finding. We would like to thank all technicians for collecting and analyzing the
Nevertheless, it shows that diagnostic information in suspected MDS FC data, especially, A. Zevenbergen and C. Cali. We thank
is not limited to myeloid or erythroid cells. G.J. Ossenkoppele and J. Cloos for critical reading of the manuscript.
Implementation of the computational diagnostic workflow in the This study was supported in part by research funding from MDS-
diagnostic work-up of MDS will reduce subjectivity associated with RIGHT, which has received funding from the European Union's Hori-
expert analysis and interpretation of both FC and morphology infor- zon 2020 research and innovation programme under grant agreement
mation. More importantly, due to the increased accuracy, it may No 634789 - “Providing the right care to the right patient with
reduce the amount of follow-up bone-marrow aspirates needed, MyeloDysplastic Syndrome at the right time” to Arjan A van de
decrease uncertainty for patients and clinicians and improve timely Loosdrecht. Yvan Saeys and Sofie Van Gassen are ISAC Marylou
access to suitable treatment options. Introduction of the computa- Ingram Scholars.
tional workflow in the diagnostic work-up of patients with clonal
hematopoiesis of indeterminate potential (CHIP), clonal cytopenia of AUTHOR CONTRIBU TIONS
undetermined significance (CCUS) and idiopathic cytopenia of under- Carolien Duetz: Conceptualization; data curation; formal analysis;
mined significance (ICUS) requires future research, but eventually may investigation; methodology; project administration; software; valida-
contribute to treatment decisions and risk stratification in these chal- tion; visualization; writing-original draft. Sofie Van Gassen: Conceptu-
lenging conditions [26–28]. alization; formal analysis; methodology; software; visualization;
The follow-up of our study will have to focus on the validation writing-review & editing. Theresia Westers: Conceptualization; inves-
of this method, preferably in multicenter setting. Studies into com- tigation; methodology; resources; supervision; validation; writing-
putational FC analysis of acute leukemia and multiple myeloma original draft; writing-review & editing. Margot Van Spronsen: Con-
have shown that compliance to quality and harmonization stan- ceptualization; writing-review & editing. Costa Bachas: Conceptuali-
dards allows for successful application in multicenter setting zation; writing-review & editing. Yvan Saeys: Methodology; software;
[29, 30]. Since erythroid progenitors proved to be highly relevant supervision; writing-review & editing. Arjan van de Loosdrecht: Con-
for diagnosis, erythrocyte-lysing method has to be considered ceptualization; funding acquisition; methodology; resources; supervi-
carefully. Recent reports show that erythrocyte lysis also affects sion; writing-review & editing.
erythroid progenitors and a non-lysis method may be considered
[31, 32]. One of the challenges for multicenter validation may be CONFLIC T OF INT ER E ST
the importance of the side and forward light scatter, since these The authors declare that the research was conducted in the absence
parameters are currently difficult to standardize. We propose sev- of any commercial or financial relationships that could be construed
eral options for multicenter validation. One option is to diagnose as a potential conflict of interest.
samples from other center based on the workflow and samples
OR CID
described in this manuscript. As mentioned before, this will
Carolien Duetz https://orcid.org/0000-0002-2905-0699
require far-reaching harmonization, and novel methods for scatter
standardization need to be explored. To circumvent the challeng-
ing scatter parameter harmonization, the workflow described in RE FE RE NCE S
1. Greenberg PL, Tuechler H, Schanz J, Sanz G, Garcia-Manero G,
this study may be further optimized without scatter parameters.
Solé F, et al. Revised international prognostic scoring system for
When excluding scatter parameters, diagnostic accuracy of the
Myelodysplastic syndromes. Blood. 2012;120:2454–65.
current diagnostic workflow decreased by 10% (Table S8). In 2. Arber DA, Orazi A, Hasserjian R, Thiele J, Borowitz MJ, Le
future studies, several options may be considered to increase Beau MM, et al. The 2016 revision to the World HealthDUETZ ET AL. 11
Organization classification of myeloid neoplasms and acute leuke- 21. Friedman J, Hastie T, Tibshirani R. Regularization paths for general-
mia. Blood. 2016;127:2391–405. ized linear models via coordinate descent. J Stat Softw. 2010;33:
3. Haase D. Cytogenetic features in myelodysplastic syndromes. Ann 1–22.
Hematol. 2008;87:515–26. 22. Louppe G, Wehenkel L, Sutera A, Geurts P. Understanding variable
4. Germing U, Strupp C, Giagounidis A, Haas R, Gattermann N, Starke C, importances in forests of randomized trees. In: CJC B, Bottou L,
et al. Evaluation of dysplasia through detailed cytomorphology in Welling M, Ghahramani Z, Weinberger KQ, editors. Advances in
3156 patients from the Düsseldorf registry on myelodysplastic syn- neural information processing systems. Proceedings of the 26th Inter-
dromes. Leuk Res. 2012;36:727–34. national Conference on Neural Information Processing Systems -
5. Porwit A, van de Loosdrecht AA, Bettelheim P, Brodersen LE, Volume 1 (NIPS'13); 2013. p. 431–439. Red Hook, NY: Curran Asso-
Burbury K, Cremers E, et al. Revisiting guidelines for integration ciates Inc.
of flow cytometry results in the WHO classification of 23. De Jay N, Papillon-Cavanagh S, Olsen C, El-Hachem N, Bontempi G,
myelodysplastic syndromes—proposal from the international/ Haibe-Kains B. mRMRe: an R package for parallelized mRMR ensem-
European LeukemiaNet working Group for Flow Cytometry in ble feature selection. Bioinformatics. 2013;29:2365–8.
MDS. Leukemia. 2014;28:1793. 24. Kordasti S, Costantini B, Seidl T, Perez Abellan P, Martinez
6. Duetz C, Westers TM, van de Loosdrecht AA. Clinical implication of Llordella M, McLornan D, et al. Deep phenotyping of Tregs identifies
multi-parameter flow Cytometry in Myelodysplastic syndromes. an immune signature for idiopathic aplastic anemia and predicts
Pathobiology. 2019;86:14–23. response to treatment. Blood. 2016;128:1193–205.
7. Ogata K, Della Porta MG, Malcovati L, Picone C, Yokose N, 25. Kittang AO, Kordasti S, Sand KE, Costantini B, Kramer AM,
Matsuda A, et al. Diagnostic utility of flow cytometry in low-grade Perezabellan P, et al. Expansion of myeloid derived suppressor cells
myelodysplastic syndromes: a prospective validation study. correlates with number of T regulatory cells and disease progression
Haematologica. 2009;94:1066–74. in myelodysplastic syndrome. Onco Targets Ther. 2016;5:e1062208.
8. Wells DA, Benesch M, Loken MR, Vallejo C, Myerson D, Leisenring 26. Steensma DP, Bejar R, Jaiswal S, Lindsley RC, Sekeres MA,
WM, et al. Myeloid and monocytic dyspoiesis as determined by flow Hasserjian RP, et al. Clonal hematopoiesis of indeterminate potential
cytometric scoring in myelodysplastic syndrome correlates with the and its distinction from myelodysplastic syndromes. Blood. 2015;126:
IPSS and with outcome after hematopoietic stem cell transplantation. 9–16.
Blood. 2003;102:394–403. 27. Valent P, Horny HP. Minimal diagnostic criteria for myelodysplastic
9. Mathis S, Chapuis N, Debord C, Rouquette A, Radford-Weiss I, syndromes and separation from ICUS and IDUS: update and open
Park S, et al. Flow cytometric detection of dyserythropoiesis: a sensi- questions. Eur J Clin Investig. 2009;39:548–53.
tive and powerful diagnostic tool for myelodysplastic syndromes. Leu- 28. Kwok B, Hall JM, Witte JS, Xu Y, Reddy P, Lin K, et al. MDS-
kemia. 2013;27:1981–7. associated somatic mutations and clonal hematopoiesis are common
10. Cremers EMP, Westers TM, Alhan C, Cali C, Visser-Wisselaar HA, in idiopathic cytopenias of undetermined significance. Blood. 2015;
Chitu DA, et al. Implementation of erythroid lineage analysis by flow 126:2355–61.
cytometry in diagnostic models for myelodysplastic syndromes. 29. Flores-Montero J, Sanoja-Flores L, Paiva B, Puig N, García-S anchez O,
Haematologica. 2017;102:320–6. Böttcher S, et al. Next generation flow for highly sensitive and stan-
11. Saeys Y, Van Gassen S, Lambrecht BN. Computational flow cyto- dardized detection of minimal residual disease in multiple myeloma.
metry: helping to make sense of high-dimensional immunology data. Leukemia. 2017;31:2094–103.
Nat Rev Immunol. 2016;16:449–62. 30. Lhermitte L, Mejstrikova E, van der Sluijs-Gelling AJ, Grigore GE,
12. Weber LM, Robinson MD. Comparison of clustering methods for Sedek L, Bras AE, et al. Automated database-guided expert-
high-dimensional single-cell flow and mass cytometry data. Cyto- supervised orientation for immunophenotypic diagnosis and classifi-
metry A. 2016;89:1084–96. cation of acute leukemia. Leukemia. 2018;32:874–81.
13. Van Gassen S, Callebaut B, Van Helden MJ, Lambrecht BN, 31. Wangen JR, Eidenschink Brodersen L, Stolk TT, Wells DA, Loken MR.
Demeester P, Dhaene T, et al. FlowSOM: using self-organizing maps Assessment of normal erythropoiesis by flow cytometry: important
for visualization and interpretation of cytometry data. Cytometry A. considerations for specimen preparation. Int J Lab Hematol. 2014;36:
2015;87:636–45. 184–96.
14. Breiman L. Random forests. Mach Learn. 2001;45:5–32. 32. Violidaki D, Axler O, Jafari K, Bild F, Nilsson L, Mazur J, et al. Analysis
15. Monaco G, Chen H, Poidinger M, Chen J, de Magalh~aes JP, Larbi A. of erythroid maturation in the nonlysed bone marrow with help of
flowAI: automatic and interactive anomaly discerning tools for flow radar plots facilitates detection of flow cytometric aberrations in
cytometry data. Bioinformatics. 2016;32:2473–80. myelodysplastic syndromes. Cytometry B Clin Cytom. 2020;98:
16. Kalina T, Flores-Montero J, van der Velden VHJ, Martin-Ayuso M, 399–411.
Böttcher S, Ritgen M, et al. EuroFlow standardization of flow 33. Hearst MA. Support vector machines. IEEE Intell Syst. 1998;13:
cytometer instrument settings and immunophenotyping protocols. 18–28.
Leukemia. 2012;26:1986–2010.
17. Cloos J, Harris JR, Janssen JJWM, Kelder A, Huang F, Sijm G, et al.
Comprehensive protocol to sample and process bone marrow for SUPPORTING INF ORMATION
measuring measurable residual disease and leukemic stem cells in Additional supporting information may be found online in the
acute myeloid leukemia. J Vis Exp. 2018;133:56386.
Supporting Information section at the end of this article.
18. Alhan C, Westers TM, Cremers EMP, Cali C, Ossenkoppele GJ, van de
Loosdrecht AA. Application of flow cytometry for myelodysplastic
syndromes: pitfalls and technical considerations. Cytometry B Clin
Cytom. 2016;90:358–67. How to cite this article: Duetz C, Van Gassen S, Westers TM,
19. Ellis B HP, Hahne F, Le Meur N, Gopalakrishnan N, Spidlen J, Jiang M, et al. Computational flow cytometry as a diagnostic tool in
Finak G (2018). flowCore: basic structures for flow cytometry data. R suspected-myelodysplastic syndromes. Cytometry. 2021;
package version 1480. 2018.
1–11. https://doi.org/10.1002/cyto.a.24360
20. Cortes C, Vapnik V. Support-vector networks. Mach Learn. 1995;20:
273–97.You can also read