Machine Learning in Capital Markets: Decision Support System for Outcome Analysis - ATS RELAB
←
→
Page content transcription
If your browser does not render page correctly, please read the page content below
Received May 25, 2020, accepted June 7, 2020, date of publication June 10, 2020, date of current version June 23, 2020.
Digital Object Identifier 10.1109/ACCESS.2020.3001455

Machine Learning in Capital Markets: Decision
Support System for Outcome Analysis
RICCARDO ROSATI1 , LUCA ROMEO 1,2 , CARLOS ALFARO GODAY3 , TULLIO MENGA3 ,
AND EMANUELE FRONTONI 1 , (Member, IEEE)
1 Departmentof Information Engineering, Università Politecnica delle Marche, 60131 Ancona, Italy
2 ComputationalStatistics and Machine Learning and Cognition, Motion and Neuroscience, Istituto Italiano di Tecnologia, 16152 Genova, Italy
3 ATS Advanced Technology Solutions, 20156 Milan, Italy

Corresponding author: Luca Romeo (l.romeo@univpm.it)

  ABSTRACT Decision support systems using Artificial Intelligence in the context of financial services
  include different application ranging from investment advice to financial trading. The analysis of order flow
  provides many challenges that can be addressed by Machine Learning (ML) techniques in order to determine
  an optimal dynamic trading strategy. The first step in this direction is represented by the outcome analysis of
  order flow: the model should identify strong predictors that determine a positive/negative outcome. The aim
  of this work is the proposal of a closed-loop ML approach based on decision tree (DT) model to perform
  outcome analysis on financial trading data. The overall approach is integrated in a Decision Support System
  for Outcome Analysis (DSS-OA). Taking into account the model complexity, the DT algorithm enables to
  generate explanations that allow the user to understand (i) how this outcome is reached (decision rules)
  and (ii) the most discriminative outcome predictors (feature importance). The closed-loop approach allows
  the users to interact directly with the proposed DSS-OA by retraining the algorithm with the goal to a finer-
  grained outcome analysis. The experimental results and comparisons demonstrated high-interpretability and
  predictive performance of the proposed DSS-OA by providing a valid and fast system for outcome analysis
  on financial trading data. Moreover, the Proof of Concept evaluation demonstrated the impact of the proposed
  DSS-OA in the outcome analysis scenario.

  INDEX TERMS Finance, decision support systems, financial management, machine learning, decision trees,
  outcome analysis.

I. INTRODUCTION                                                                                 model rather than a knowledge-based technique [5]. Experts
The exponential growth of big data analytics in recent years                                    and decision support systems (DSS) using a portion of AI are
has also had a consistent impact on the financial world.                                        widely spread in different domains [6]–[9]. In the context of
Exploiting Artificial Intelligence (AI) methodologies, it is                                    financial services DSS are often used for different application
possible to analyze a huge amount of data in order to discover                                  ranging from investment advice, credit granting, online port-
hidden patterns within it which may help investors in their                                     folio selection [10] and service to trading [5]. The analysis of
profit operations on financial markets [1], [2]. In particular,                                 order flow provides many challenges that can be addressed by
this data analysis procedure may allow to identify anomalies                                    Machine Learning (ML) techniques in order to determine an
and unusual events, to mitigate critical risks related to human                                 optimal or sub-optimal dynamic trading strategy. This means
error and to predict the outcome of a future event by analyzing                                 that ML models have the objective to find solutions that can
backward-looking data [3].                                                                      maximize profitability over time taking into account risk as
   The application of AI in financial analytics is also affecting                               the main factor of this task. The first step in this direction
the practice of automated trading [4]. Markets and trades                                       can conventionally be represented by the outcome analysis
generally comprised a huge amount of well-structured data                                       of order flow: given as input a historical series of market
that lies the foundation from the application of a data-driven                                  operations (e.g. 1 month), the model should identify strong
                                                                                                predictors that determine a positive/negative outcome (i.e.
                                                                                                IOC order fill/cancel). This approach aims i) to steer data
   The associate editor coordinating the review of this manuscript and
approving it for publication was Hao Ji.                                                        analysis for improving trading strategies and ii) to provide

                     This work is licensed under a Creative Commons Attribution 4.0 License. For more information, see https://creativecommons.org/licenses/by/4.0/
109080                                                                                                                                                                VOLUME 8, 2020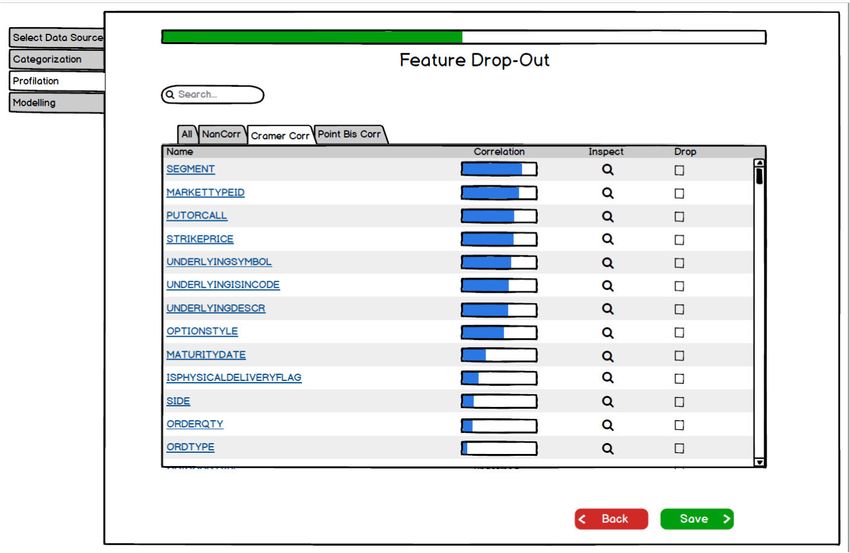
R. Rosati et al.: ML in Capital Markets: DSS-OA

information on relative benchmarks (e.g. best execution) to          Our objective is in line with the recent Ethics guide-
brokers.                                                          lines for trustworthy AI (https://ec.europa.eu/digital-single-
   In the context of financial prediction literature,             market/en/news/ethics-guidelines-trustworthy-ai) where the
knowledge-based approaches have been proposed for time            mission in the capital market scenario is also to ensure
series forecasting problem and financial risk management          key requirements such as transparency and accountabil-
using respectively fuzzy candlestick patterns [11] and prag-      ity. The principle of transparency and interpretability are
matic approach to the design of knowledge repositories [12].      closely related together. The AI model should ensure high-
However, considering the increasing amount of longitudi-          interpretability by providing outcomes that are understand-
nal data and available features, expert systems based on          able and relevant to the involved stakeholder. Accordingly,
the knowledge-based technique in financial services tend          the high-transparency should ensure a high level of support
to tackle only quite narrow, routine tasks with required          (i.e. decision support system) while providing the informa-
knowledge already mapped out. This fact may limit the             tion about the system’s capabilities and limitations for the
automatization of the prediction process as well as the global    involved users/customers. The principle of accountability
comprehension of the task. In this context data-driven model      plays a central role, especially in critical applications such
may provide a valuable solution to achieve a reliable forecast    as the capital market. The assessment of the outcome is
provided one can understand how the prediction was achieved       clearly provided for each processing and algorithm step:
and which feature determines the predicted outcome (i.e.          the user/customers can actively interact with the AI model,
outcome analysis). Both these conditions may provide the          ensuring that the objectives are achieved. These guidelines
acceptance of the financial community [5].                        are the foundations that are taken into account in the design
   Although complex models such as standard Neural Net-           of the proposed Decision Support System that lead us towards
works (NN) and other Deep Learning techniques have been           the introduction of a simple and interpretable ML model that
applied to financial trading [13], [14] and stock predic-         are functional models for achieving these purposes in the
tion [15], Decision Tree (DT) based ML models are capable         capital market scenario.
to find a multivariate relationship between input and output         The aim of this work is the proposal of a closed-loop
variables, also dealing with a dataset consisting of thousands    machine learning approach based on features selection and
of observations and a large heterogeneous feature set. At the     classification/regression algorithm (i.e., Decision Tree [DT])
same time, DT models allow providing a direct interpretation      to perform outcome analysis on financial trading data. The
of the most discriminative predictors [16], [17].                 overall approach is integrated as a Decision Support System
   For what concerns the financial forecasting different ML       for Outcome Analysis (DSS-OA) for improving the outcome
and DL algorithms were proposed for learning in the pres-         analysis of order flow. Taking into account the model com-
ence of sequence data. These approaches range from stan-          plexity (i.e. depth of the tree) [28], the DT algorithm enables
dard Deep Neural Network (DNN) [18], [19] to recurrent            to generate explanations that allow the user to understand
neural network (i.e. Long-short-term memory) [20]–[22].           (i) how this outcome is reached (i.e. decision rules) and (ii) the
However, the potential of DL approaches may be limited            most discriminative outcome predictors (i.e. feature impor-
by the interpretability of the model [23], which does not         tance). Feature importance gives a score for each predictor,
always allow to retrieve the feature importance and represents    the higher the score more important or relevant is the feature
a crucial aspect in order to perform an outcome analysis          towards your output variable. This information may be salient
in financial data. On the other hand, there is an increas-        to support the outcome analysis of the trading analytics. In
ing interest in the introduction of clustering approaches to      this scenario, the closed-loop approach allows the user to
extract useful knowledge from existing collected data to          (i) visualize the decision rules and the feature importance
help make reasonable decisions for new customer requests          (ii) uncheck features that are not interesting for the outcome
(e.g. user credit category, the confidence of expected return).   analysis and (iii) retraining the model for discovering relevant
However, starting from the motivation of the outcome anal-        features that are not easily correlated with the outcome.
ysis (i.e. the model should identify strong predictors that          This work contributes to the knowledge and data engineer-
determine a positive/negative outcome) we have decided to         ing field for the following reasons:
apply a supervised learning strategy (i.e., DT) to improve           • it introduces a closed-loop machine learning approach
at the same time prediction and interpretability results [24].          based on DT algorithm as the main core of a DSS-OA for
At the same time, the DT exploits the Gini index mea-                   performing outcome analysis on financial trading data;
surements by encouraging the creation of uniform regions.            • it seeks to detect the most discriminative trading pre-
The Gini and Information Gain index are closely related                 dictors which are not easily correlated with the target
together, they can be exploited for feature selection and out-          variable (outcome analysis). Such analysis and interpre-
come analysis as a univariate filter-based approach. However,           tation could support the short and long term forecast of
the employment of Decision Tree allows performing an in-                the order flow for financial trading prediction;
deep, non-linear multivariate feature selection by discov-           • it allows the user to interact directly with the proposed
ering also the relation (i.e. decision rule) among different            DSS-OA by visualizing the learned decision rules and
predictors [25]–[27].                                                   feature importance. Based on these outcomes the users

VOLUME 8, 2020                                                                                                               109081
R. Rosati et al.: ML in Capital Markets: DSS-OA
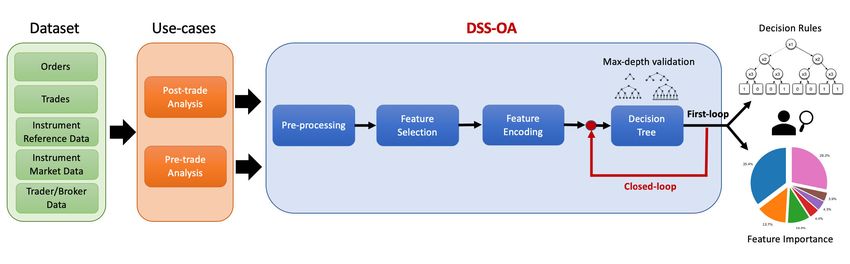
FIGURE 1. Flow-chart of the proposed DSS-OA approach: decision Support System for improving the outcome analysis of
order flow. The overall framework consists of 4 steps: pre-processing, feature selection, feature encoding and decision tree.
The closed-loop machine learning approach allows the user to (i) visualize the decision rules and the feature importance (ii)
uncheck features that are not interesting for the outcome analysis and (iii) retraining the model for discovering relevant
features that are not easily correlated with the outcome. Two use-cases have been tested: post and pre-trade procedure.
TABLE 1. Description of the dataset: features types and domain. of the proposed DSS-OA for solving the outcome analysis
task using this dataset.
An order sent to the market can trigger 0 or more trades.
In the most common case, one order produces one trade, but
the order could expire or be canceled by the user without
being filled (i.e without producing any trade), or the order
could be executed in multiple steps, trading fractions of the
order quantity in multiple trades until it gets filled. According
to the ATS company, four target variables have been identi-
can uncheck features that are not interesting for the
fied on the Trading History dataset:
outcome analysis, and retraining the algorithm with the
• TGT_LASTORDSTATUS (binary target), the last state
goal to a finer-grained outcome analysis.
of the order (i.e. ‘‘Canceled’’ or ‘‘Filled’’);
• TGT_EXECQTYPERC (continuous target), the exe-
II. MATERIALS AND METHOD
Figure 1 shows the flow-chart of the proposed approach. The cuted quantity in relation to the quantity specified in the
overall framework comprised of 4 steps: pre-processing, fea- order (in percentage);
• TGT_LIMPRICE_DIFF_PERC (continuous target),
ture selection, feature encoding and decision tree. The user
can interact with the overall framework by visualizing the the percentage of deviation of the executed price from
decision rule and the feature importance. Taking into account the limit price;
• TGT_COMMISSION_WEIGHT_PERC (continuous
this information and the fact that the user has full knowledge
about the domain, he/she can decide to exclude further fea- target), the percentage weight of commissions in relation
tures that are not interesting for the outcome analysis, before to the counter value.
Our goal is to perform individually the outcome analysis
retraining the DT model.
of these 4 tasks. The features set is represented by the trade
A. DATASET features while the response is the related target variable
The dataset Trading History employed in this study consists (i.e. TGT_LASTORDSTATUS, TGT_EXECQTYPERC,
of an order flow of 5 months equal to 324530 trades observa- TGT_LIMPRICE_DIFF_PERC and TGT_COMMISSION_
tions and a feature set of 278 variables (trade features) (see WEIGHT_PERC). Based on the types of target variables we
Table 1). The trade features are shown in terms of domain have one classification and three regression tasks.
(order status, instrument definition, client ID, Instrument The target variable TGT_LASTORDSTATUS consists
trading data and Others) and types (categorical, ordinal and of 107859 samples targeted with the ‘‘Canceled’’ class and
continuous). Trading History data are anonymous in terms of 211809 targeted with the ‘‘Filled’’ class. Figure 2 shows
customers and instrument and their use, detention and conser- the histograms of the occurrences of the target variables
vation are regulated by an agreement between ATS company, TGT_EXECQTYPERC (see Figure 2a), TGT_LIMPRICE_
Università Politecnica delle Marche and data owners. The DIFF_PERC (see Figure 2b) and TGT_COMMISSION_
dataset refers to a private dataset from ATS company and WEIGHT_PERC (see Figure 2c). Notice that the histogram
it represents a recent year’s operations in several markets. was built with varying bin width by taking into account the
The dataset was used because (i) it is an example of how unbalanced nature of these target variables.
trading operations data can be made available from a trading
platform and (ii) it contains a good variety of operations B. PRE-PROCESSING
on different markets/asset types over a consistent period. As a first step, only orders with TGT_LASTORDSTATUS
These motivations support the implementation and the testing equal to ‘‘Canceled’’ or ‘‘Filled’’ are maintained.
109082 VOLUME 8, 2020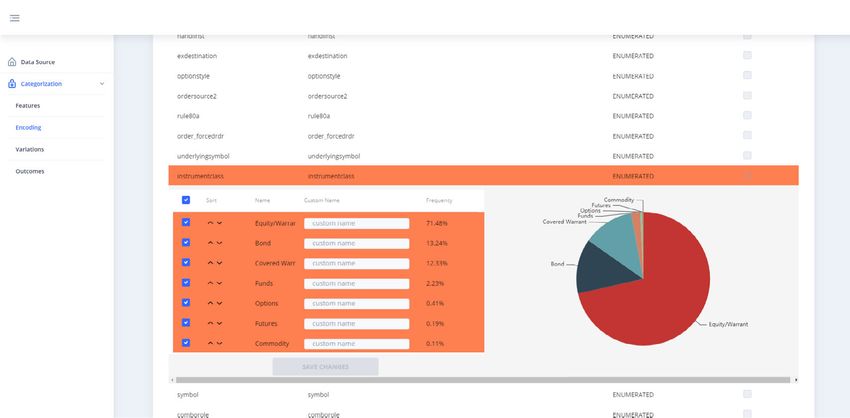
R. Rosati et al.: ML in Capital Markets: DSS-OA

The remaining observations, corresponding to 0,3% of                TABLE 2. Correlation tests.
the entire dataset, are removed reducing the dataset to
319668 rows. Besides date/time-related features have been
standardized to the ISO 8601 format. The pre-processing step
aims also to identify the features as categorical, ordinal and
continuous. Additionally, in this stage, we convert absolute
feature related to specific field (i.e. price) into variations
                                                                    D. FEATURE ENCODING
and deviations (i.e. price deviation) from average or baseline
value. This step allows to minimize possible bias originating       The encoding procedure for not-ordered and ordered cat-
from different orders.                                              egorical features is a salient step to capture information
                                                                    according to the nature of the independent variables [30]. For
C. FEATURE SELECTION                                                not-ordered categorical features (i.e. features related to ID,
The outcome analysis aims to discover unseen discrimina-            codes), label encoding was performed converting each value
tive predictors related to the selected target variable. Hence,     in the feature column to a number in order of appearance.
the feature selection procedure is implemented in order to          Although this technique could insert some kind of sorting
discard the easily correlated features which do not provide         relationship between values, it has been preferred to the One-
additional value for the outcome analysis task. This procedure      Hot encoding procedure which is not suitable due to the high
is different from the standard feature selection procedure for      amount (i.e. 186 categorical features) and high cardinality
improving the generalization performance of a ML model,             of each categorical features (i.e. the average cardinality of
where only the most discriminative features are retained.           the categorical features is 7285). On the other hand ordered
                                                                    categorical features, where values have a natural order (e.g.
1) REMOVAL OF FEATURES WITH MISSING VALUES (NaN)                    date, timestamp), were encoded with the ordinal encoding
Starting from the hypothesis that the mechanism which gov-          approach, by maintaining the true order to the classes them-
erns the missing data occurrences is complex and completely         selves. Continuous features were kept unchanged. Before
random (i.e. the frequency of missing values is different for       performing features encoding, the remaining missing values
each feature), we supposed that the probability that features       were treated with a technique of extra-value data imputation
were missing may be dependent (i.e., informative) or inde-          by replacing NaN with value 999.
pendent (i.e., non-informative) from the target variable [29].
Hence, to explore how the mechanism of missing values is            E. DECISION TREE
informative, we performed an extra-value imputation (i.e.           Decision Tree (DT) is a non-parametric supervised learning
values of feature columns are converted in 0 [Nan] or 1 [all        algorithm used to predict the value of a target variable by
other values]) and we measure the correlation between the           learning simple decision rules inferred from the data fea-
feature column and the target variable.                             tures/predictors [31]. The learning process is performed by
   Based on the different nature of target variable,                selecting the predictor that maximizes the splitting criteria
two correlation metrics were used: Matthews Corre-                  gain over all possible splits of all predictors. The DT model
lation for the binary target (TGT_LASTORDSTATUS)                    is conceived as a CART model to handle both categorical
and Point Biserial Correlation for continuous targets               and continuous features. A DT consists of nodes (which are
(TGT_EXECQTYPERC, TGT_LIMPRICE_DIFF_PERC,                           tests for the value of a certain attribute), branches (which
TGT_COMMISSION _WEIGHT_PERC). The statistical                       correspond to the outcome of a test and connect to the
significance of the correlation tests was set at the 5% sig-        next node or leaf) and leaf nodes (which are terminal nodes
nificance level. Features with a p − value < .05 were               representing the prediction of the outcome, i.e. class labels
discarded: this condition reflects the fact that the missing        or class distribution). DTs were used to perform both clas-
value mechanism of the related feature is highly informative        sification (TGT_LASTORDSTATUS) and regression tasks
and easily correlated with the target variable. This condition      (TGT_EXECQTYPERC, TGT_LIMPRICE_DIFF_PERC
does not provide any added value to the user.                       and TGT_COMMISSION _WEIGHT_PERC). For the DT
                                                                    classifier, we employed the Gini’s diversity index: this mea-
2) REMOVAL OF FEATURES EASILY CORRELATED                            sure encourages the creation of uniform regions. Differently
WITH THE TARGET VARIABLE                                            from the misclassification rate, the Gini index is more sen-
Based on the different natures of dependent and independent         sitive to node probabilities and is differentiable and thus
variables, four different correlation metrics were employed         more suited to gradient-based optimization approaches [32].
to explore the correlation between each feature and target          Accordingly, for the DT regressor, we used the sum-of-
variables (see Table 2). Features with a p − value < .05            squares error as a splitting criterion.
were discarded: this condition reflects the fact that the related      The Gini’s diversity index was used to evaluate the feature
feature is highly informative and easily correlated with the        importance of the classification task: the more relevant is
target variable. This condition does not provide any added          the feature the greater the Gini’s index value. Accordingly,
value to the user.                                                  the sum-of-squares error was used to evaluate the feature

VOLUME 8, 2020                                                                                                             109083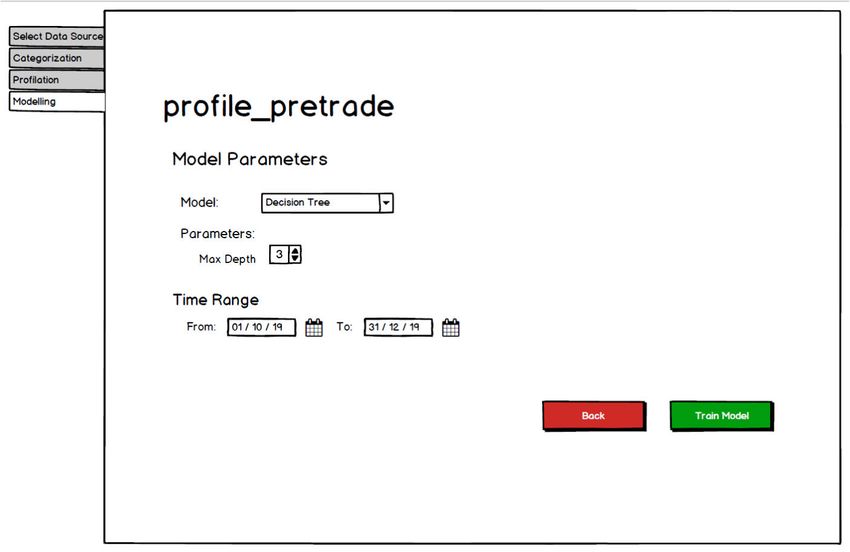
R. Rosati et al.: ML in Capital Markets: DSS-OA

FIGURE 2. Histograms of occurrences for the regression tasks (TGT_EXECQTYPERC, TGT_LIMPRICE_DIFF_PERC and TGT_COMMISSION_WEIGHT_PERC).

importance of the regression tasks: the more relevant is the           which reports the time elapsed since the order was created
feature the lower the sum-of-squares error value.                      and its last update).
F. EXPERIMENTAL PROCEDURE                                              3) METRICS
The max-depth validation of the DT model was performed in              The proposed DSS-OA was evaluated by considering the
order to improve the interpretability of the overall DSS-OA            following metrics for the classification task:
approach (see Section II-F1). The proposed DSS-OA was                     • accuracy: the percentage of correct predictions;
tested on two real-use case, i.e. post and pre-trade anal-                • Macro-precision (Precision): the Precision is calculated
ysis (see Section II-F2) by evaluating the related metrics                   for each class and then take the unweighted mean;
(see Section II-F3).                                                      • Macro-recall (Recall): the Recall is calculated for each
                                                                             class and then take the unweighted mean;
1) MAX-DEPTH VALIDATION
                                                                          • macro-F1 (F1): the harmonic mean of precision and
The interpretability/complexity of the DT model was encour-                  recall averaged over all output categories;
aged and controlled by constraining the model size (i.e. depth            • confusion matrix: the square matrix that shows the type
of the tree) of the learned trees [28]. The depth of the tree                of error in a supervised paradigm;
is the maximum number of tests that have to be made for
                                                                       and the following metrics for the regression tasks:
a single example to be classified [33]. Thus, the maximum
                                                                          • R2 score (coefficient of determination): it is a proportion
depth of the tree was considered as the hyperparameter that
regulates the complexity of the DT algorithm. We decided to                  between the variability of the data and the correctness of
explore the maximum depth in a range between 2 and 10 to                     the model used. It varies in range: [−∞; 1] [35];
                                                                          • Mean Absolute Error (MAE): it measures the difference
encourage the interpretability of DT. Accordingly, the opti-
mization of the maximum depth of the tree was performed                      between two continuous variables and represents the
by the implementation of a grid search and the optimization                  average of the absolute error ei = |yi − xi | where yi rep-
of the macro-f1 and R2 score in a stratified Cross-Validation                resents the prediction and xi the ground-truth. It varies
procedure according to [34]. This approach allows increasing                 in range: [0;+∞];
                                                                          • Pearson correlation coefficient: it measures the linear
both the discriminative power (high performance) and the
interpretability of the DT model.                                            relationship between two continuous variables. It varies
                                                                             in range: [−1; 1], where 0 implies that there is no
2) POST AND PRE-TRADE ANALYSIS                                               correlation.
Two use-cases have been identified: Post-trade and Pre-trade              • Spearman correlation coefficient: it measures the non-
outcome analysis. The Post-trade analysis process consists of                linear relationship between two continuous variables.
recording all data from previous trading periods (i.e. trade                 It varies in range: [−1; 1], where 0 implies that there
timing, prices and other details about order flow) and evalu-                is no correlation.
ating performance in order to make better trading decisions               To test for significant difference between random clas-
while monitoring future transactions. Pre-trade analytic is            sification, an independent one-sided t-test was performed
the process of taking known parameters of a planned trade              comparing the F1 distribution over folds with respect to
to predict the potential future outcome of an order and the            chance level (.5) Accordingly, the statistical significance
expected market impact. In our case, the post-trade analysis           of the correlation tests was set at the 5% significance
is carried out considering the whole dataset. Instead, the pre-        level.
trade analysis is performed excluding all those features that
are not available a-priori when the order is placed on the             III. RESULTS
market (e.g. LASTORDSTATUPDTIME, indicating the time                   We first show the results of the first-loop iteration of
of the last order status change, and ORD_TOTAL_LIFE,                   the proposed DSS-OA (see Section III-A). In this phase,

109084                                                                                                                           VOLUME 8, 2020
R. Rosati et al.: ML in Capital Markets: DSS-OA FIGURE 3. Example of feature selection: removal of features with missing values and removal of features easily correlated with the target variable. TABLE 3. Predictive performance of the DSS-OA model for all the target variables (TGT_LASTORDSTATUS, TGT_EXECQTYPERC, TGT_LIMPRICE_DIFF_PERC and TGT_COMMISSION _WEIGHT_PERC): post and pre-trade on first-loop (FL) and closed-loop (CL) iteration. the user has not yet interacted with the overall framework. A. FIRST-LOOP Then, we provide the results of the closed-loop approach Here we show the results of the first-loop iteration related to (see Section III-B). In this phase, the user has interacted the feature selection (see Section III-A1) and classification with the overall framework by (i) visualizing the decision model. The results are presented in terms of predictive per- rules and the feature importance (ii) eventually uncheck- formance (see Section III-A2) and outcome analysis (feature ing features that are not interesting for the outcome anal- importance) (see Section III-A3) for post and pre-trade pro- ysis and (iii) retraining the model for discovering relevant cedures. features that are not easily correlated with the outcome. We summarized the predictive performance for all clas- 1) FEATURE SELECTION sification (TGT_LASTORDSTATUS) and regression tasks Figure 3 shows an example of the feature selection procedure (TGT_EXECQTYPERC, TGT_LIMPRICE_DIFF_PERC for removing features with missing values and features and TGT_COMMISSION _WEIGHT_PERC), while we easily correlated with the target variable. In particular, show the results related to the outcome analysis (i.e. feature we show the most correlated imputed categorical features importance and decision rules) for solving the classification (p − value < .05) with respect to the binary indepen- task (TGT_LASTORDSTATUS). dent variable TGT_LASTORDSTATUS (see Figure 3a). VOLUME 8, 2020 109085
R. Rosati et al.: ML in Capital Markets: DSS-OA

FIGURE 4. Feature importance for the TGT_LASTORDSTATUS: post and pre-trade on first-loop and closed-loop iteration. We show the features which
disclosed a feature importance greater than the 3%. The remaining features are marked as OTHER.

Then, we have discarded these features, because the                         TABLE 4. Confusion matrices (rows are the true classes) for the
                                                                            TGT_LASTORDSTATUS (C: Canceled, F: Filled): post and pre-trade on
missing value occurrences are easily correlated with the                    first-loop and closed-loop iteration.
TGT_LASTORDSTATUS. Accordingly, we have discarded
the most correlated features with respect to the target variable
TGT_LASTORDSTATUS (see Figure 3b).

2) PREDICTIVE PERFORMANCE
The predictive performance of the DSS-OA model for the
first-loop iteration is shown in Table 3 for the post and pre-
trade procedure. F1 distribution over folds is significantly
higher (p − value < .05) than chance level (i.e. F1 = 0.5)
for classifying TGT_LASTORDSTATUS for both post (F1
= 0.90) and pre-trade (F1 = 0.81) procedure. The Pearson
correlation between the predicted TGT_EXECQTYPERC/
TGT_LIMPRICE_DIFF_PERC and the ground-truth is sig-                         LASTORDSTATUS. The most discriminative features
nificantly (p − value < .05) different from 0 for both post-                are    respectively LASTORDSTATUPDTIME        and
trade (0.77 and 0.58 respectively) and pre-trade (0.68 and                  DIFF_CURR_LIM_PRICE for post and pre-trade proce-
0.71 respectively) procedures.                                              dures.
   Table 4 (top row) shows the confusion matrices for pre-
dicting TGT_LASTORDSTATUS for both post and pre-trade                       B. CLOSED-LOOP
procedures. In the post-trade analysis both the true nega-                  Here we show the results of the closed-loop iteration related
tive (TN) and true positive (TP) rates are high and balanced,               to the DSS-OA model. The results are presented in terms
while in the pre-trade procedure, although the TN is over                   of predictive performance (see Section III-B1) and outcome
chance level, it is lower than TP.                                          analysis (feature importance and final decision rules) (see
                                                                            Section III-B2) for post and pre-trade procedures. In this
3) FEATURE IMPORTANCE                                                       phase, the users visualized the outcome analysis (feature
Figure 4a and Figure 4b show the feature impor-                             importance and decision rules) of the Firs-loop iteration for
tance computed for solving the classification task TGT_                     solving the TGT_ LASTORDSTATUS task and chose to

109086                                                                                                                                  VOLUME 8, 2020
R. Rosati et al.: ML in Capital Markets: DSS-OA
discard a total of 77 features. One of these features (i.e. TABLE 5. Predictive performance of the DSS-OA model for the binary
target variable (TGT_LASTORDSTATUS: post and pre-trade on closed-loop
PRICE) resulted as high discriminative for solving the post (CL) iteration. Comparisons with respect to XGBoost and Multi layer
and pre-trade tasks in the first-loop iteration. The DT model perceptron (MLP).
was retrained according to the new feature set.
1) PREDICTIVE PERFORMANCE
The new predictive performance of the DSS-OA model
for the closed-loop iteration is shown in Table 3 for the
post and pre-trade procedures. F1 distribution over folds is
significantly higher (p − value < .05) than chance level
(i.e. F1 = 0.5) for classifying TGT_LASTORDSTATUS TABLE 6. Confusion matrices (rows are the true classes) for the
for both post (F1 = 0.91) and pre-trade (F1 = 0.84) pro- TGT_LASTORDSTATUS (C: Canceled, F: Filled): post and pre-trade on
cedures. The Pearson correlation between the predicted first-loop and closed-loop iteration. Comparisons with respect to XGBoost
and Multi layer perceptron (MLP).
TGT_EXECQTYPERC/ TGT_LIMPRICE_DIFF_PERC
and the ground-truth is significantly (p − value <
.05) different from 0 for both post-trade (0.78 and 0.58
respectively) and pre-trade (0.46 and 0.41 respectively)
procedures.
2) FEATURE IMPORTANCE AND FINAL DECISION RULES
Figure 4c and Figure 4d show the feature importance
computed for solving the classification task
TGT_LASTORDSTATUS in the closed-loop iteration.
The most discriminative features remained respectively D. PROOF OF CONCEPT OF THE PROPOSED DSS-OA
LASTORDSTATUPDTIME and DIFF_CURR_LIM_PRICE APPROACH
for post and pre-trade procedures. As a result of the user The idea as the basis of the overall project originated from
interaction with the first iteration of the DSS-OA approach, specific software vendor demands. As a Proof of Con-
the new feature importance analysis unveils new outcomes cept (POC) of the proposed approach we have provided a
(e.g. ORDTYPE and ORDER_ORDERSOURCE) that were wireframe example that has led the development of the POC
not present in the firs-loop step. These outcomes may provide in terms of Front-end design (FE) (see Figures 6).
salient knowledge for deeply understanding, discriminative
unseen predictors that are strongly relevant for the outcome
IV. DISCUSSION
analysis task.
Starting from the software vendor demands the term outcome
As example, we show the first three layers of the DT
analysis is defined as a measure of the result of trading activ-
decision rules for solving the TGT_LASTORDSTATUS for
ity which is defined by the user himself. This definition sup-
the post-trade procedure during the closed-loop iteration
ports the integration of the ML approach in a DSS to support
(see Figure 5). The decision rules of DT together with the
different users’ profiles. Thus, we developed a framework
features importance represent the salient outcomes of the
with the dual purpose of facilitating the post-trade analysis of
DSS-OA that the user can visualize both in the first loop and
user-defined outcomes (with high explainability algorithms)
closed-loop iterations.
and, as a result of this analysis, to provide prediction tools of
the same user-defined outcomes in the pre-trade phase (with
C. COMPARISONS WITH RESPECT TO ML AND DL a lower explainability requirement).
APPROACHES Given a historical series of order flow, the main goal
We have performed a comparison with respect to ML and of the outcome analysis task is to determine the strong
DL models used in a similar financial scenario. In particular, predictors that determine a negative/positive outcome (e.g.
we have tested Multi-layer perceptron [MLP] which was used order-specific characterization). These results may provide
for financial forecasting [18], [19]. Additionally, we have per- a relevant impact in order to provide benchmarks for bro-
formed a further comparison with a XGBoost methodology kers (e.g. best execution) and improving trading or market
that was applied in a different domain within the financial making strategies supported by a ML-based procedure. The
scenario (i.e. credit scoring task) [36]. The provided experi- proposed DSS-OA represents a salient solution for achieving
mental comparisons (see Table 5 and Table 6) with respect these objectives by supporting the users/customers during the
to XGBoost and state-of-the-art DL approaches evidenced overall outcome analysis procedure. The proposed DT is con-
how the DT is a trade-off between interpretability, model ceived as the main core of the DSS-OA and the learned feature
complexity and predictive accuracy for solving the outcome importance and decision rules provide a direct impact on
analysis task. customers/users. In particular, we maximized both accuracy
VOLUME 8, 2020 109087R. Rosati et al.: ML in Capital Markets: DSS-OA
FIGURE 5. Decision rules of the closed-loop DSS-OA model.
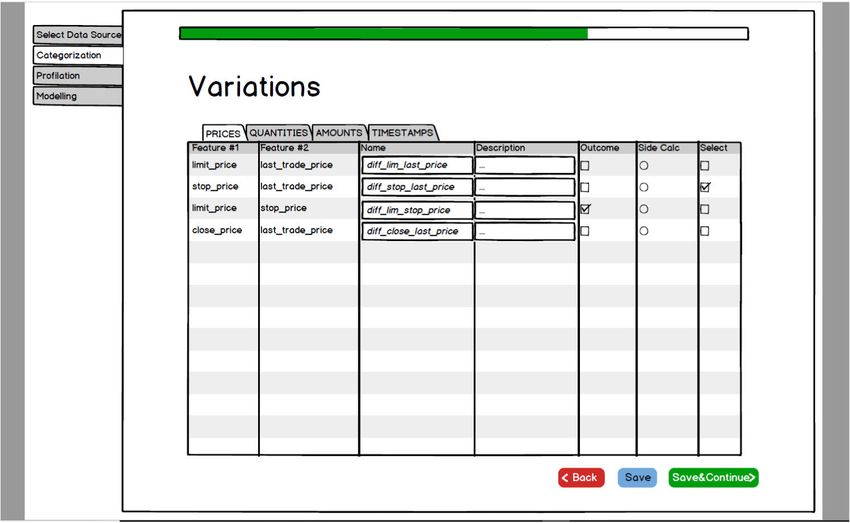
FIGURE 6. Proof of concept (POC) of the proposed DSS-OA approach: wireframe examples that have led the development of the POC in terms of
Front-end design. identify the features as categorical, ordinal and continuous. In the pre-processing step the frequencies of the features can be analyzed
(a). Additionally, the categorization phase (b) within the pre-processing step aims (i) to identify the features as categorical, ordinal and continuous
and (ii) to convert absolute feature related to a specific field (i.e. price) into variations and deviations (i.e. price deviation) from average or baseline value.
This step allows to minimize possible bias originating from different orders. Afterward the features selection (c) can be performed by performing a
correlation analysis and creating different profiles. Finally the Decision Tree model is trained with the selected features (d).
and interpretability of the ML model: its internal behavior can and explanations (justifications) can be provided for the main
be directly understood by users/customers (interpretability) factors that led to its output (outcome analysis). Furthermore,
109088 VOLUME 8, 2020R. Rosati et al.: ML in Capital Markets: DSS-OA
we maximized the interaction between the users and the DSS- (TGT_EXECQTYPERC, TGT_LIMPRICE_DIFF_PERC
OA by allowing the user to interact actively with the overall and TGT_COMMISSION _WEIGHT_PERC) (see Fig-
system. Based on the outcome of the first loop analysis the ure 2) tasks. In particular, the DSS-OA is more sensitive
user can decide to discard features that are not interesting for to the unbalanced setting of TGT_LASTORDSTATUS in
the outcome analysis and retraining the algorithm with the the more challenging pre-trade procedure (see Table 4).
goal to a finer-grained outcome analysis. In fact, this proce- Accordingly, the Pearson correlation between the predicted
dure allows the user to discover novel relevant predictors (see TGT_COMMISSION_WEIGTH_PERC and the ground
Figure 4) in the closed-loop iteration (e.g. ORDTYPE and truth is not significantly different from 0 (see Table 3). Future
ORDER_ORDERSOURCE) that were not fully detected in works may be devoted to explore advanced oversampling
the first loop iteration. strategies by including synthetic oversampling technique [38]
Accordingly, the outcome analysis results were supported and cost-sensitive DT model [39].
by the high discriminative performance of the ML algorithm Another interesting future direction would be to extend
for both post and pre-trade procedure in the first-loop and the methodology into a multi-task regression/classification
closed-loop iteration (see Table 3). In particular, the exper- approach. This would involve modeling, discriminating
imental results (see Table 3) demonstrated how the learned and localizing the most relevant predictors by exploiting
DT/RT is discriminative (high performance) and at the same the intrinsic similarity across tasks. This strategy could
time interpretable (i.e., the maximum number of tests [deci- be effective especially when we have limited knowl-
sion rules] that have to be made for a single example to be edge and few observations of a single task (e.g. TGT_
classified is less than 10. Nevertheless, the difficulty of the COMMISSION_WEIGTH_PERC) and we aim to improve
predictive task increased from the post-trade to the pre-trade the learning of a model for this specific task by using the
procedure (see Table 3 and Table 4). This outcome reflects knowledge contained in all or some of the related tasks [40].
the more challenging market use-case where the objective is
to predict the future relevant outcomes based on past available V. CONCLUSION
features (i.e. excluding all those features that are not available As demonstrated by the high-interpretability and predictive
a-priori when the order is placed on the market). performance provided by the experimental results and com-
Another advantage of the proposed DSS-OA is the low parisons, the proposed DSS-OA represents a valid tool for
computation effort of the overall procedure. The training time performing outcome analysis on financial trading data. More-
of DT model is approximately less than (averaged across task) over, the POC evaluation demonstrated the impact of the
5 minutes. Thus, the DT model ensures a timely outcome proposed DSS-OA in the outcome analysis scenario. The
analysis for each iteration of the DSS-OA. Additionally the proposed approach is an example of decision support system
low computation effort makes the proposed DSS-OA directly based on ML algorithm for supporting the capital markets
adaptable in program trading systems (i.e. algo trading and analysis.
high-frequency trading): the effort required for predictive
outcome computation is compatible with the low-latency pro- REFERENCES
vided by the proposed approach. In a software-engineered [1] S.-C. Huang, ‘‘A big data analysis system for financial trading,’’ in Proc.
solution the computational effort of the proposed solution WCBM, 2017, p. 62.
(i.e. testing time of the DT) is in the order of tens or a few [2] G. Ritter, ‘‘Machine learning for trading,’’ Tech. Rep., 2017.
[3] EBA Report on Big Data and Advanced Analytics, EBA, London, U.K.,
hundred microseconds, which is compatible with software 2020.
low-latency trading platform. Integrating pre-trade outcome [4] Y. Li, W. Zheng, and Z. Zheng, ‘‘Deep robust reinforcement learning for
prediction is such a cost-effective solution tier that can help practical algorithmic trading,’’ IEEE Access, vol. 7, pp. 108014–108022,
to spread AI-based services to a wider user range, making 2019.
[5] L. F. Pau, ‘‘Artificial intelligence and financial services,’’ IEEE Trans.
it feasible for smaller brokerage firms or institutions to have Knowl. Data Eng., vol. 3, no. 2, pp. 137–148, Jun. 1991.
limited IT and quant team resources. As a future direction, [6] H. Jang, ‘‘A decision support framework for robust R&D budget allocation
the model could be easily generalized to take into account a using machine learning and optimization,’’ Decis. Support Syst., vol. 121,
pp. 1–12, Jun. 2019.
new set of orders placed in the markets. It would be inter- [7] J. Siryani, B. Tanju, and T. J. Eveleigh, ‘‘A machine learning decision-
esting to evolve our DSS-OA by learning in presence of support system improves the Internet of Things smart meter operations,’’
sequential data (i.e. a sequence of time series in the past) IEEE Internet Things J., vol. 4, no. 4, pp. 1056–1066, Aug. 2017.
[8] L. Romeo, J. Loncarski, M. Paolanti, G. Bocchini, A. Mancini, and
in order to predict the most relevant outcome in the future. E. Frontoni, ‘‘Machine learning-based design support system for the pre-
In this scenario, future development could be addressed to diction of heterogeneous machine parameters in industry 4.0,’’ Expert Syst.
improve the generalization performance of the algorithm (i.e. Appl., vol. 140, Feb. 2020, Art. no. 112869.
by evolving the DT into a Gradient Boosting) and speed- [9] M. Calabrese, M. Cimmino, F. Fiume, M. Manfrin, L. Romeo, S. Ceccacci,
M. Paolanti, G. Toscano, G. Ciandrini, A. Carrotta, M. Mengoni,
up the re-training procedure (i.e. by exploiting incremental E. Frontoni, and D. Kapetis, ‘‘SOPHIA: An event-based IoT and machine
learning strategies [37]). learning architecture for predictive maintenance in industry 4.0,’’ Informa-
The proposed DSS-OA may suffer from the unbalanced tion, vol. 11, no. 4, p. 202, Apr. 2020, doi: 10.3390/info11040202.
[10] D.-J. Huang, J. Zhou, B. Li, S. C. H. Hoi, and S. Zhou, ‘‘Robust median
setting of the classification (TGT_LASTORDSTATUS) reversion strategy for online portfolio selection,’’ IEEE Trans. Knowl. Data
(34% canceled vs 66% filled) and regression Eng., vol. 28, no. 9, pp. 2480–2493, Sep. 2016.
VOLUME 8, 2020 109089R. Rosati et al.: ML in Capital Markets: DSS-OA
[11] C.-H. L. Lee, A. Liu, and W.-S. Chen, ‘‘Pattern discovery of fuzzy time [36] Y. Xia, C. Liu, Y. Li, and N. Liu, ‘‘A boosted decision tree approach using
series for financial prediction,’’ IEEE Trans. Knowl. Data Eng., vol. 18, Bayesian hyper-parameter optimization for credit scoring,’’ Expert Syst.
no. 5, pp. 613–625, May 2006. Appl., vol. 78, pp. 225–241, Jul. 2017.
[12] M. Benaroch, ‘‘Toward the notion of a knowledge repository for finan- [37] C. Zhang, Y. Zhang, X. Shi, G. Almpanidis, G. Fan, and X. Shen,
cial risk management,’’ IEEE Trans. Knowl. Data Eng., vol. 9, no. 1, ‘‘On incremental learning for gradient boosting decision trees,’’ Neural
pp. 161–167, Jan. 1997. Process. Lett., vol. 50, no. 1, pp. 957–987, Aug. 2019.
[13] E. A. Gerlein, M. McGinnity, A. Belatreche, and S. Coleman, ‘‘Evalu- [38] N. V. Chawla, K. W. Bowyer, L. O. Hall, and W. P. Kegelmeyer, ‘‘SMOTE:
ating machine learning classification for financial trading: An empirical Synthetic minority over-sampling technique,’’ J. Artif. Intell. Res., vol. 16,
approach,’’ Expert Syst. Appl., vol. 54, pp. 193–207, Jul. 2016. pp. 321–357, Jun. 2002.
[14] D. Fengqian and L. Chao, ‘‘An adaptive financial trading system using deep [39] S. Ben Jabeur, A. Sadaaoui, A. Sghaier, and R. Aloui, ‘‘Machine learn-
reinforcement learning with candlestick decomposing features,’’ IEEE ing models and cost-sensitive decision trees for bond rating prediction,’’
Access, vol. 8, pp. 63666–63678, 2020. J. Oper. Res. Soc., pp. 1–19, 2019, doi: 10.1080/01605682.2019.1581405.
[15] L. Shi, Z. Teng, L. Wang, Y. Zhang, and A. Binder, ‘‘DeepClue: Visual [40] Y. Zhang and Q. Yang, ‘‘A survey on multi-task learning,’’ 2017,
interpretation of text-based deep stock prediction,’’ IEEE Trans. Knowl. arXiv:1707.08114. [Online]. Available: http://arxiv.org/abs/1707.08114
Data Eng., vol. 31, no. 6, pp. 1094–1108, Jun. 2019.
[16] R. G. Leiva, A. F. Anta, V. Mancuso, and P. Casari, ‘‘A novel
hyperparameter-free approach to decision tree construction that avoids
overfitting by design,’’ IEEE Access, vol. 7, pp. 99978–99987, 2019.
[17] S. Hwang, H. G. Yeo, and J.-S. Hong, ‘‘A new splitting criterion for better
interpretable trees,’’ IEEE Access, vol. 8, pp. 62762–62774, 2020.
[18] A. Namdari and Z. S. Li, ‘‘Integrating fundamental and technical analysis
of stock market through multi-layer perceptron,’’ in Proc. IEEE Technol. RICCARDO ROSATI was born in Cagli, in 1992.
Eng. Manage. Conf. (TEMSCON), Jun. 2018, pp. 1–6. He received the Master of Science degree in
[19] V.-E. Neagoe, A.-D. Ciotec, and G.-S. Cucu, ‘‘Deep convolutional neural biomedical engineering from Università Politec-
networks versus multilayer perceptron for financial prediction,’’ in Proc. nica delle Marche, in 2018, where he is currently
Int. Conf. Commun. (COMM), Jun. 2018, pp. 201–206. pursuing the Ph.D. degree with the Department
[20] W. Bao, J. Yue, and Y. Rao, ‘‘A deep learning framework for financial time of Information Engineering. His research inter-
series using stacked autoencoders and long-short term memory,’’ PLoS ests include machine learning and deep learning
ONE, vol. 12, no. 7, Jul. 2017, Art. no. e0180944. techniques applied to biomedical field and indus-
[21] M. R. Vargas, B. S. L. P. de Lima, and A. G. Evsukoff, ‘‘Deep learning try 4.0 landscape. He received the Scholarship
for stock market prediction from financial news articles,’’ in Proc. IEEE financed by the Marche Region for the Project
Int. Conf. Comput. Intell. Virtual Environ. Meas. Syst. Appl. (CIVEMSA), Embedded Automation and Edge Computing for Industry 4.0.
Jun. 2017, pp. 60–65.
[22] A. Bhowmick, A. Rahman, and R. M. Rahman, ‘‘Performance analysis
of different recurrent neural network architectures and classical statistical
model for financial forecasting: A case study on Dhaka stock exchange,’’
in Proc. Comput. Sci. Line Conf. Cham, Switzerland: Springer, 2019,
pp. 277–286.
[23] Z. C. Lipton, ‘‘The mythos of model interpretability,’’ Queue, vol. 16, no. 3,
pp. 31–57, 2018. LUCA ROMEO received the Ph.D. degree in
[24] F. Cai, N.-A. Le-Khac, and T. Kechadi, ‘‘Clustering approaches for finan- computer science from the Department of Infor-
cial data analysis: A survey,’’ 2016, arXiv:1609.08520. [Online]. Avail- mation Engineering (DII), Università Politecnica
able: http://arxiv.org/abs/1609.08520 delle Marche, in 2018. His Ph.D. Thesis was on
[25] V. Sugumaran, V. Muralidharan, and K. I. Ramachandran, ‘‘Feature selec- Applied Machine Learning for Human Motion
tion using decision tree and classification through proximal support vector Analysis and Affective Computing. He is currently
machine for fault diagnostics of roller bearing,’’ Mech. Syst. Signal Pro- a Postdoctoral Researcher with the Department of
cess., vol. 21, no. 2, pp. 930–942, Feb. 2007. Information Engineering, Università Politecnica
[26] Y. Jeong and S.-H. Myaeng, ‘‘Feature selection using a semantic hierarchy delle Marche. He is also affiliated with the Unit
for event recognition and type classification,’’ in Proc. 6th Int. Joint Conf.
of Cognition, Motion and Neuroscience and Com-
Natural Lang. Process., 2013, pp. 136–144.
putational Statistics and Machine Learning, Fondazione Istituto Italiano di
[27] J. Novakovic, P. Strbac, and D. Bulatovic, ‘‘Toward optimal feature selec-
tion using ranking methods and classification algorithms,’’ Yugoslav J. Tecnologia, Genova. His research interests include machine learning applied
Oper. Res., vol. 21, no. 1, pp. 119–135, 2011. to biomedical applications and affective computing and motion analysis.
[28] C. Molnar, G. Casalicchio, and B. Bischl, ‘‘Quantifying model complexity
via functional decomposition for better post-hoc interpretability,’’ 2019,
arXiv:1904.03867. [Online]. Available: http://arxiv.org/abs/1904.03867
[29] P. J. García-Laencina, J.-L. Sancho-Gómez, and A. R. Figueiras-Vidal,
‘‘Pattern classification with missing data: A review,’’ Neural Comput.
Appl., vol. 19, no. 2, pp. 263–282, Mar. 2010.
[30] P. Cerda, G. Varoquaux, and B. Kégl, ‘‘Similarity encoding for learn- CARLOS ALFARO GODAY was born in Madrid,
ing with dirty categorical variables,’’ Mach. Learn., vol. 107, nos. 8–10, Spain, in 1994. He received the double degrees in
pp. 1477–1494, Sep. 2018. mathematics and computer science from the Uni-
[31] L. Breiman, J. Friedman, R. Olshen, and C. Stone, Classification and versidad Autónoma de Madrid, Spain, in Febru-
Regression Trees. Monterey, CA, USA: Wadsworth and Brooks, 1984.
ary 2018. He also spent one year studying with the
[32] C. M. Bishop, Pattern Recognition and Machine Learning (Information
Politecnico di Milano, Milan, Italy, where he also
Science and Statistics). Berlin, Germany: Springer-Verlag, 2006.
[33] S. Rüping, ‘‘Learning interpretable models,’’ Ph.D. dissertation, Univ.
completed the graduation thesis on High Perfor-
Dortmund Fachbereich Informatik, Dortmund, Germany, 2006. mance Computing. Since March 2018, he has been
[34] G. C. Cawley and N. L. Talbot, ‘‘On over-fitting in model selection and a Software Engineer with the Finance Industry.
subsequent selection bias in performance evaluation,’’ J. Mach. Learn. Since March 2019, he has also been with ATS
Res., vol. 11, pp. 2079–2107, Jul. 2010. Advanced Technology Solutions, Milan, as a part of the Capital Market
[35] A. Di Bucchianico, ‘‘Coefficient of determination (R2 ),’’ in Encyclopedia Research and Development Team. His research interests include understand-
of Statistics in Quality and Reliability, vol. 1. 2008. [Online]. Available: ing how machine learning and data analysis techniques can be applied to
https://onlinelibrary.wiley.com/doi/abs/10.1002/9780470061572.eqr173 enhance the quality of the trading workflow.
109090 VOLUME 8, 2020R. Rosati et al.: ML in Capital Markets: DSS-OA
TULLIO MENGA was born in Milan, Italy, EMANUELE FRONTONI (Member, IEEE) was
in 1973. He received the degree in physics from born in Fermo, Italy, in 1978. He is currently a Pro-
the Università degli Studi di Milano, Milan, Italy. fessor of computer vision and deep learning with
Since the beginning of his career, he has been the Department of Information Engineering, Uni-
with the Capital Market Area, mainly focusing versità Politecnica delle Marche. He is involved
on bringing highest performance technologies on in different EU projects and technological transfer
market data and order and execution manage- projects with national and international compa-
ment systems. He is currently In-Charge with the nies. He is the coauthor of more than 150 inter-
Capital Market Research and Development Team, national articles in his research field. His main
ATS Advanced Technology Solutions, Milan. His research interests include artificial intelligence,
research interests include real-time AI applications both from research and computer vision, human behavior analysis, augmented reality, and sensitive
low-latency engineering perspectives. spaces.
VOLUME 8, 2020 109091You can also read