Identification of 15 genetic loci associated with risk of major depression in individuals of European descent - Gwern.net
←
→
Page content transcription
If your browser does not render page correctly, please read the page content below
Articles

                                                   Identification of 15 genetic loci associated with risk of
                                                   major depression in individuals of European descent
                                                   Craig L Hyde1, Michael W Nagle2, Chao Tian3, Xing Chen1, Sara A Paciga2, Jens R Wendland2, Joyce Y Tung3,
                                                   David A Hinds3, Roy H Perlis4 & Ashley R Winslow2,5

                                                   Despite strong evidence supporting the heritability of major depressive disorder (MDD), previous genome-wide studies
© 2016 Nature America, Inc. All rights reserved.

                                                   were unable to identify risk loci among individuals of European descent. We used self-report data from 75,607 individuals
                                                   reporting clinical diagnosis of depression and 231,747 individuals reporting no history of depression through 23andMe and
                                                   carried out meta-analysis of these results with published MDD genome-wide association study results. We identified five
                                                   independent variants from four regions associated with self-report of clinical diagnosis or treatment for depression. Loci with
                                                   a P value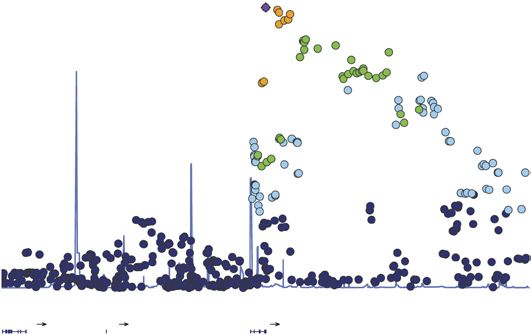
Articles
Table 1 Cohort demographics for the primary and replication results were reported for the X or Y chromosome) 14, and only these
23andMe data sets SNPs were used for downstream analysis. As a result, several lead
Discovery Replication SNPs from the discovery 23andMe GWAS were absent, including
MDD Controls MDD Controls rs77741769 (SPPL3–HNF1A), rs144294997 (N6AMT1), rs1432639
(NEGR1), and rs67744457 (EP300–L3MBTL2). Each cohort was indi-
Total (n) 75,607 231,747 45,773 106,354
vidually adjusted for test statistic inflation using LD score regression
Age, percentage (years)
Under 30 12.1 11.6 13.8 13.4
(Online Methods), and the combined cohorts were subsequently
30–45 29.9 27.5 29.8 25.4
subjected to meta-analysis using a standard fixed-effects, inverse-
45–60 28.8 27.2 29.6 27.7 variance-weighted approach15. The final results from the meta-
Over 60 29.3 33.7 26.7 33.3 analysis were further adjusted for the meta-analysis LD score regres-
Sex, percentage sion intercept of 1.0025.
Male 38.0 56.2 33.8 52.6 Of the original 23andMe lead SNPs, only the N6AMT1 locus was
Female 62.0 43.8 66.2 47.4 not represented in the meta-analysis results at a P value less than
5 × 10⁻⁶ because of absence of the lead 23andMe SNP in the meta-
have previously been associated with multiple central nervous system data set as well as an absence of significant secondary signals in the
(CNS) phenotypes including epilepsy and intellectual disability8,9 and region. SNPs in the OLFM4, TMEM161B–MEF2C (two independent
have been implicated in regulation of synaptic function10. TMEM161B SNPs), MEIS2–TMCO5A, and NEGR1 regions reached genome-wide
is also expressed in the brain, and Tmem161b exhibits decreased levels significance in the meta-analysis (P < 5 × 10⁻⁸, correcting for 1.22
of repressive dimethylation of histone H3 at lysine 9 and lysine 27 million SNPs) (Supplementary Table 2). Regional association plots
in response to social isolation in a mouse model of depression11. are shown for these regions in Figure 2. Heritability for the meta-
© 2016 Nature America, Inc. All rights reserved.
2
Whereas schizophrenia and Alzheimer disease GWAS both identify analysis was estimated at hliability = 0.059 and 0.069, with prevalence
the MEF2C region as a disease susceptibility locus, the peak schizo- of 15% and 25%, respectively.
phrenia- and Alzheimer disease–associated SNPs are not in strong
linkage disequilibrium (LD) with the MDD-associated SNP (schizo- Replication of 15 loci associated with major depression
phrenia: rs181900 (ref. 12), r2 = 0.001; Alzheimer disease: rs190982, We assessed the ability of the top signals (P < 1 × 10⁻⁵) from
r2 = 0.016). Using a population prevalence of 15% for MDD estimated the meta-analysis to replicate in a separate cohort of 45,773 cases
by the Psychiatric Genomics Consortium (PGC)13, we calculated her- and 106,354 controls from 23andMe (Table 1). All individuals in
2
itability using LD score regression of hliability = 0.0528 for this data set. the replication data set were independent from subjects included in
When using the 23andMe observed population prevalence for MDD the discovery 23andMe data set and had similar characteristics
2
of 25%, the heritability is hliability = 0.0612. for sex and age distributions. The replication cohort provided
Results from the meta-analysis of the 23andMe data set with the additional support for three of the five genome-wide-significant
previously reported PGC meta-analysis of MDD, which encompassed SNPs, in the TMEM161B–MEF2C (two SNPs) and NEGR1 (one
9,240 cases and 9,519 controls of European descent, are presented SNP) loci. In a joint analysis of the discovery 23andMe data set,
in Figure 1a,b (Supplementary Table 2). In the PGC cohort, only the PGC data set, and the 23andMe replication data set, a total of
1.22 million SNPs overlapped with the 23andMe MDD data (no 15 independent loci (17 SNPs) reached genome-wide significance
a 15 b
14
13 [OLFM4]
12 1012
11 1011
TMEM161B MEF2C
10 1010
–log10 (P value)
9 MEIS2 TMCO5A 109
NEGR1
8 108
Observed quantile
RSRC1 MLF1 5q34 [L3MBTL2]
VRK2
7 HACE1 LIN28B [SORCS3] 107
KIAA0020 RFX3 SLC6A15
1p31.1
6
[RERE] 106
[PAX5]
5 105
4 104
3 103
2 102
1 101
0 100
1 2 3 4 5 6 7 8 9 10 11 12 13 14 15 16 17 18 19 20 21 22 100 101 102 103 104 105 106
Genomic position Theoretical quantile
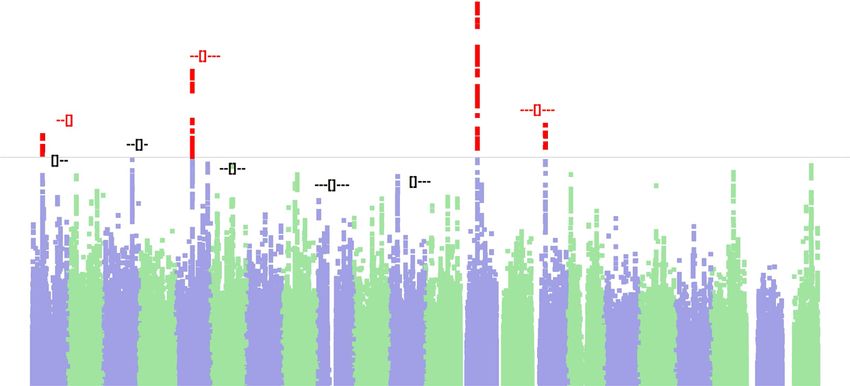
Figure 1 Discovery-phase meta-analysis of 23andMe self-report ascertainment of major depression (75,607 cases and 231,747 controls) and PGC MDD
(9,240 cases and 9,519 controls). (a) Manhattan plot of the discovery-phase 23andMe GWAS. The intercept calculated by LD score regression was used for
inflation correction. The threshold for genome-wide significance (P < 5 × 10⁻⁸) is represented by the horizontal purple line. Red dots correspond to SNPs with
P values smaller than the genome-wide significance threshold. Regions labeled in black denote loci that reached genome-wide significance in the joint analysis.
The hg19 release of the UCSC Genome Browser was used for mapping. SNP location is denoted by []. If the SNP occurs between genes, then the distance from
those genes is denoted by dashes: no dash, ≤1 kb; -, ≤10 kb; --, ≤100 kb; ---, ≤1,000 kb. (b) Quantile–quantile plot for the 23andMe MDD GWAS.
aDVANCE ONLINE PUBLICATION Nature Genetics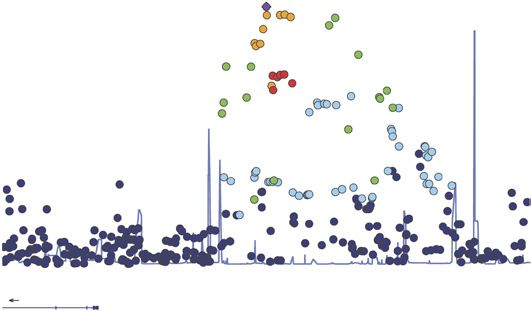
Articles
Figure 2 Regional association plots for a 14 2
r
1.0 100 b 2 rs10514299
100
genome-wide-significant regions and secondary 12
0.8
rs12552
10
r
1.0
Recombination rate (cM/Mb)
Recombination rate (cM/Mb)
0.6 0.8
independent signals identified in each 0.4
0.2
80 0.6
0.4 rs454214
80
10 8
–log10 (P value)
0
region. (a–d) OLFM4 locus (rs12552) (a), 0.2
–log10 (P value)
0
8 60 60
TMEM161B–MEF2C locus (rs10514299) (b), 6
6
MEIS2–TMCO5A locus (rs8025231) (c), and 40 4
40
NEGR1 locus (rs11209948) (d). Secondary 4
20 2 20
signals in the TMEM161B–MEF2C and 2
NEGR1 regions (rs454214 and rs2422321, 0 0 0 0
respectively) are shown. Purple diamonds SUGT1 MIR759 OLFM4 TMEM161B LOC102546226 LINC00461 MEF2C
represent the SNP with the smallest P value 53.4 53.6 53.8 54.0 87.4 87.6 87.8 88.0
Position on chr. 13 (Mb) Position on chr. 5 (Mb)
for each locus.
c 10 r
2
1.0
100 d10 r 2
1.0
100
Recombination rate (cM/Mb)
0.8 rs8025231 0.8
rs11209948
Recombination rate (cM/Mb)
0.6 0.6
8 0.4 80 8 0.4 80
(P < 5 × 10⁻⁸) (Table 2). Of the remaining 0.2 0.2
–log10 (P value)
rs2422321
–log10 (P value)
0 0
6 60 6
−5
46 SNPs with a P value less than 1 × 10 in
60
the meta-analysis of the 23andMe discov- 4 40 4 40
ery data set and the 23andMe replication, 2 20 2 20
41 had a consistent direction of effect in the 0
0 0 0
meta-analysis and replication cohorts MEIS2 NEGR1
(P values across all analyses, including 37.4 37.6 37.8 38.0 72.4 72.6 72.8 73.0 73.2
joint analysis, are shown in Supplementary Position on chr. 15 (Mb) Positon on chr. 1 (Mb)
© 2016 Nature America, Inc. All rights reserved.
Table 2 for SNPs that reached P < 1 × 10⁻⁵
in the meta-analysis).
To explore the biological implications of our findings, we used shown a role for Meis2-regulated pathways in neurogenesis through
DEPICT to derive tissue enrichment, gene set enrichment, and interactions with Pax6, as well as interactions with Pax3 and Pax7
gene predictions (Supplementary Table 3) for SNPs with a P value (refs. 16,17). Notably, our analysis identified significant associations
less than 1 × 10⁻⁵ in the meta-analysis. Although identification with MDD in the MEIS2, PAX6, and PAX5 regions (P = 2.04 × 10⁻⁸,
of the functional variant or gene for each locus is not straightfor- 3.94 × 10⁻⁷, and 2.59 × 10⁻⁵, respectively, in the 23andMe discovery
ward, many of the top associations in our data set appeared in or data set). Tissue enrichment analysis showed an over-representation
near genes encoding transcription factors with known CNS develop- of the CNS, and 12 of the 19 nominally associated tissues were from
mental functions (for additional gene predictions from DEPICT and different brain regions (with ‘nervous system’ as a second-level MeSH
functional annotation for each region, see Supplementary Table 4). term). Although these associations did not pass multiple-testing cor-
Gene set enrichment analysis prioritized the MEIS2 subnetwork rection, the top results from our MDD GWAS correspond to genes
(P = 2.30 × 10⁻⁶). MEIS2 encodes a TALE homeodomain transcrip- enriched for CNS expression and transcriptional function important
tion factor known to function in development. Although most studies for CNS development or neurogenesis. Further functional annota-
implicate MEIS2 in peripheral tissue development, recent studies have tions of predicted genomic and molecular functions, annotations of
Table 2 Summary statistics for 17 SNPs reaching genome-wide significance (P < 5 × 10⁻⁸) in the joint analysis (23andMe discovery,
PGC, and 23andMe replication)
rs ID Gene context 23andMe PGC Meta-analysis Replication Joint Sign match
rs10514299 TMEM161B--[]---MEF2C 4.35 × 10⁻¹² 5.73 × 10⁻¹ 8.50 × 10⁻¹¹ 1.15 × 10⁻⁴ 9.99 × 10⁻¹⁶ Yes
rs1518395 []--VRK2 1.45 × 10⁻⁷ 5.83 × 10⁻¹ 2.01 × 10⁻⁷ 1.50 × 10⁻⁵ 4.32 × 10⁻¹² Yes
rs2179744 [L3MBTL2] 4.34 × 10⁻⁸ 7.74 × 10⁻¹ 9.24 × 10⁻⁸ 7.26 × 10⁻⁴ 6.03 × 10⁻¹¹ Yes
rs11209948 NEGR1--[] 4.41 × 10⁻⁸ 8.57 × 10⁻² 1.01 × 10⁻⁸ 9.39 × 10⁻⁴ 8.38 × 10⁻¹¹ Yes
rs454214 TMEM161B---[]--MEF2C 6.28 × 10⁻⁸ 1.62 × 10⁻¹ 2.42 × 10⁻⁸ 6.39 × 10⁻³ 1.09 × 10⁻⁹ Yes
rs301806 [RERE] 3.72 × 10⁻⁶ 8.68 × 10⁻¹ 7.28 × 10⁻⁶ 2.52 × 10⁻⁴ 1.90 × 10⁻⁹ Yes
rs1475120 HACE1--[]--LIN28B 2.32 × 10⁻⁶ 2.29 × 10⁻¹ 1.14 × 10⁻⁶ 9.27 × 10⁻⁴ 4.17 × 10⁻⁹ Yes
rs10786831 [SORCS3] 1.75 × 10⁻⁶ 2.98 × 10⁻¹ 1.09 × 10⁻⁶ 2.33 × 10⁻³ 8.11 × 10⁻⁹ Yes
rs12552 [OLFM4] 1.23 × 10⁻¹² 1.57 × 10⁻¹ 5.74 × 10⁻¹³ 8.70 × 10⁻¹ 8.16 × 10⁻⁹ No
rs6476606 [PAX5] 2.59 × 10⁻⁵ 1.52 × 10⁻¹ 9.30 × 10⁻⁶ 1.94 × 10⁻⁴ 1.20 × 10⁻⁸ Yes
rs8025231 MEIS2---[]---TMCO5A 2.04 × 10⁻⁸ 8.49 × 10⁻² 4.66 × 10⁻⁹ 7.50 × 10⁻² 1.23 × 10⁻⁸ Yes
rs12065553 [] 8.53 × 10⁻⁷ 8.67 × 10⁻¹ 2.88 × 10⁻⁶ 6.79 × 10⁻³ 1.32 × 10⁻⁸ Yes
rs1656369 RSRC1--[]-MLF1 8.19 × 10⁻⁸ 3.22 × 10⁻¹ 6.05 × 10⁻⁸ 3.56 × 10⁻² 1.34 × 10⁻⁸ Yes
rs4543289 [] 1.19 × 10⁻⁶ 1.15 × 10⁻² 8.23 × 10⁻⁸ 5.26 × 10⁻³ 1.36 × 10⁻⁸ Yes
rs2125716 []---SLC6A15 4.33 × 10⁻⁷ 8.78 × 10⁻¹ 9.58 × 10⁻⁷ 2.24 × 10⁻² 3.05 × 10⁻⁸ Yes
rs2422321 NEGR1---[] 5.12 × 10⁻⁶ 6.91 × 10⁻³ 3.28 × 10⁻⁷ 3.13 × 10⁻³ 3.18 × 10⁻⁸ Yes
rs7044150 KIAA0020---[]---RFX3 3.97 × 10⁻⁷ 9.64 × 10⁻¹ 1.24 × 10⁻⁶ 3.05 × 10⁻² 4.31 × 10⁻⁸ Yes
The corresponding P values are shown for each phase of analysis: 23andMe MDD (discovery data set), PGC MDD, meta-analysis (23andMe discovery + PGC), 23andMe replication
(23andMe replication cohort), and joint analysis. P values were adjusted for the 23andMe discovery, PGC, and meta-analysis data (but meta-analysis and replication P values
were not adjusted for inflation in joint analysis). Adjustment was performed using the intercepts calculated by LD score regression. Sign match indicates whether the directions of
effect were matched for the meta-analysis and 23andMe replication data sets. Text representation of SNP location in relation to genes in each region is shown, with SNP location
denoted by []. If the SNP occurs between genes, the distance from these genes is denoted by dashes: no dash, ≤1 kb; -, ≤10 kb, --, ≤100 kb; ---, ≤1,000 kb. The hg19 release of
the UCSC Genome Browser was used for mapping. The GWAS results were peak pruned by distance (0.1).
Nature Genetics ADVANCE ONLINE PUBLICATION 
Articles

                                                   Table 3 MDD gene risk score association with secondary phenotypes                                                               at a range of thresholds, suggesting consist-
                                                   Phenotype                                    n             Effect (s.e.)            P value                FDR                  ent signal for the PGC results and 23andMe
                                                   Early onset                               94,891          0.283 (0.095)              2.90 × 10⁻³            3.20 × 10⁻³
                                                                                                                                                                                   data. For the 82 independent SNPs with nom-
                                                   Age of onset                              94,891          –1.49 (0.372)              6.10 × 10  −5          8.40 × 10  −5       inal P values less than 1 × 10⁻⁵ in 23andMe,
                                                   Anxiety                                  250,528          0.323 (0.061)              1.00 × 10⁻⁷            2.50 × 10⁻⁷         the P value for the sign test was 2 × 10⁻⁶
                                                   Panic attacks                            247,167          0.319 (0.072)              9.80 × 10⁻⁶            1.50 × 10⁻⁵         with the odds ratio for a sign match of 10.6
                                                   Insomnia                                 248,576          0.272 (0.051)              1.10 × 10⁻⁷            2.50 × 10⁻⁷         (95% CI = 3.5–37.1). Furthermore, the effect
                                                   Taking an SSRI                            52,698          0.448 (0.162)              5.50 × 10⁻³            5.50 × 10⁻³         sizes for the top independent 23andMe loci
                                                   Medication for mental health             349,287          0.421 (0.057)              1.40 × 10⁻¹³           1.50 × 10⁻¹²        were correlated with the effect sizes for these
                                                   Prescription sleep aid                   350,119          0.184 (0.05)               2.70 × 10⁻⁴            3.20 × 10⁻⁴         SNPs in PGC (removing loci with minor
                                                   Prescription pain medication             346,989          0.236 (0.041)              5.60 × 10⁻⁹            3.10 × 10⁻⁸         allele frequency (MAF) 27)                     401,552          0.212 (0.038)              3.00 × 10⁻⁸            1.10 × 10⁻⁷         variable values). This correlation peaked
                                                   Obesity (BMI >30)                        401,552          0.216 (0.045)              1.50 × 10⁻⁶            2.70 × 10⁻⁶         at the 39th peak 23andMe locus with 68%
                                                   The GRS is explained in Supplementary Table 6. Analysis of association with age of onset for MDD was conducted                  correlation (P = 2.5 × 10⁻⁹). Additionally, we
                                                   in subjects with MDD. Association analysis for all other traits was conducted in cases and controls, and results were
                                                   adjusted for case/control status from the general 23andMe research community. s.e., standard error.
                                                                                                                                                                                   calculated the genetic correlation between
                                                                                                                                                                                   the two data sets using LD score regression20
                                                                                                                                                                                   and found that the two major depression data
                                                   brain tissue or monocyte expression quantitative trait loci (eQTLs), sets were highly and positively correlated (rg = 0.725, s.e.m. = 0.093;
                                                   gene predictions for each region using DEPICT18, and annotations of P = 7.05 × 10⁻¹⁵).
                                                   disease associations from publicly available GWAS data sets and the
© 2016 Nature America, Inc. All rights reserved.

                                                   Online Mendelian Inheritance in Man (OMIM) database are presented Associations of lead SNPs with related phenotypes
                                                   in Supplementary Table 4 for all 17 SNPs reaching genome-wide sig- To investigate the polygenic nature of MDD, we generated a genetic
                                                   nificance in the joint analysis (Table 2).                                                      risk score (GRS) from 17 SNPs (Supplementary Table 6) with
                                                       After SNPs were pruned for distance (separated by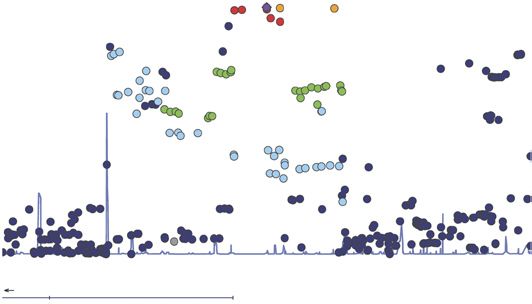
Articles

                                                   Sex effects                                                                GWAS results was observed for the PGC SCZ2 schizophrenia GWAS
                                                   Because of known disparities between the sexes in the presentation         (r = 0.282, s.e.m. = 0.03; P = 2.18 × 10⁻²¹), followed by the bipolar
                                                   of depression and incidence rate and because of the suggestion of          disorder and additional schizophrenia GWAS (Table 4); however,
                                                   differences in underlying biology, we tested for sex-specific effects      we observed little to no correlation for the Parkinson disease and
                                                   for our top SNPs as well as genotype–sex interaction for each SNP          Alzheimer disease data sets. Additionally, we checked for correlation
                                                   in the 23andMe discovery cohort (Supplementary Table 8). In the            between MDD in the 23andMe data set and a trait with no known
                                                   discovery cohort, four SNPs had nominal association at P < 0.05,           epidemiological correlation with depression (LDL cholesterol) and
                                                   but none survived multiple-testing correction. No results reached          observed no genetic correlation between the two traits.
                                                   nominal significance at P < 0.05 in the replication cohort. Our GWAS
                                                   results thus provide no support for differences between the sexes in       DISCUSSION
                                                   genetic predisposition to depression.                                      In this study, we present a complementary approach to collecting large-
                                                                                                                              scale genotypic data on major depression. By using the self-report
                                                   Cohort characteristics                                                     data on major depression from 23andMe, we were able to identify
                                                   We further validated the new self-reported phenotype by assessing          SNPs at a genome-wide level of significance associated with risk for
                                                   expected characteristics of medication use, comorbid symptoms,             depression in a cohort of European descent. Through a meta-analysis
                                                   and risk factors commonly seen in MDD in the 23andMe self-                 of the 23andMe data with PGC MDD GWAS and a joint analysis
                                                   report cohort (Supplementary Table 9). Reporting of anxiety, panic         with an independent 23andMe replication cohort, we identify 17
                                                   attacks, and insomnia was significantly increased (P < 5.0 × 10−243        independent SNPs significantly associated with diagnosis of major
                                                   for all traits tested) among subjects reporting depression as well as a    depression. Through tissue and gene set enrichment analyses using
                                                   BMI greater than 27 (overweight) or a BMI greater than 30 (obese).         DEPICT, we find that these SNPs are predicted to be enriched in genes
© 2016 Nature America, Inc. All rights reserved.

                                                   Reporting of current selective serotonin reuptake inhibitor (SSRI)         that are expressed in the CNS and function in transcriptional regula-
                                                   use, medication for mental health problems, prescription sleep             tion related to neurodevelopment. We find no robust evidence for sex
                                                   aids, and pain medication was also increased, with the highest odds        specificity of effects among our top results, but this study combined
                                                   ratios for any trait tested observed for SSRI and psychotropic use         both sexes and only adjusted for sex as a covariate and was therefore
                                                   (13.35 and 44.83, respectively), further supporting the validity of the    not structured to identify sex-specific loci. This would ideally be done
                                                   phenotype ascertainment. Cohort characteristics were also tested           through a sex-stratified GWAS.
                                                   separately in males and females, with no evidence of sex-specific             Although the variance explained by these SNPs is small, we find
                                                   differences (Supplementary Table 10).                                      that our cohorts identified by self-report of major depression are
                                                      Studies have shown a degree of shared genetic liability for differ-     highly genetically correlated with cohorts identified by clinical inter-
                                                   ent psychiatric disorders, which is likely a result of multiple factors,   view, a result further corroborated by significant sign tests and effect
                                                   including genetic pleiotropy, diagnostic overlap, comorbid disease,        size matching between the top 23andMe SNPs (nominal P < 1 × 10⁻⁵)
                                                   or disease progression. To initially assess shared genetic risk across     and their counterparts in PGC in self-report and clinical interview
                                                   psychiatric disorders, we obtained P values across five psychiatric        data sets. To better understand the phenotypic characteristics of the
                                                   traits (schizophrenia, bipolar disorder, neuroticism, depressive symp-     23andMe self-report subjects, we assessed reporting of medication
                                                   toms, and subjective well-being) for SNPs with P values less than          use and comorbidities and found that all tested characteristics were
                                                   1 × 10⁻⁵ in the MDD meta-analysis (Supplementary Table 11; data            significantly increased in the subjects reporting depression, similar
                                                   for neuroticism, depressive symptoms, and subjective well-being are        to what is seen in clinically ascertained subjects. Many of the most
                                                   from ref. 21). The MDD-associated SNPs showed the highest degree           significant SNPs show evidence of pleiotropy when examined in other
                                                   of overlap (smallest P values) in the schizophrenia data set, followed     clinically ascertained psychiatric disorders, with the smallest P values
                                                   by neuroticism, with less replication in the bipolar disorder, depres-     among individual SNPs seen for MDD-associated SNPs in the PGC
                                                   sive symptoms, and subjective well-being phenotypes. Schizophrenia         schizophrenia and neuroticism data sets. This finding is unsurprising
                                                   and bipolar disorder GWAS data were from the publicly available PGC        given the pleiotropy reported by other GWAS and cross-psychiatric-
                                                   data sets12,22, and corresponding P values for neuroticism, depres-        disorder analyses13 and lends further support to the relevance of a
                                                   sive symptoms, and subjective well-being were provided by the Social       self-reported phenotype to clinical disease.
                                                   Science Genetics Association Consortium (SSGAC). The lack of cor-             We were unable to replicate the genome-wide-significant loci
                                                   relation with SSGAC depressive symptoms self-report data may arise         identified in the recent CONVERGE study6, although we identified
                                                   from the differences between acute and chronic depression or clinical      modest associations in each region (LHPP: rs145655839, minimum
                                                   severity, given that subjects in the SSGAC study were asked to report      P = 0.0024 out of 6,204 SNPs in the region; SIRT1: rs187810158,
                                                   on depressive symptoms arising in the 2 weeks before the survey,           minimum P = 0.0102 out of 5,111 SNPs in the region). This result is
                                                   as compared to lifetime major depression in the primary cohorts.           unsurprising given that our study looked for genetic determinants
                                                   Conversely, the trait measure of neuroticism has previously been show      of susceptibility in both males and females of European descent and
                                                   to overlap with major depression, consistent with our results.             likely represented a very different population structure than that of
                                                      To rigorously assess the genetic correlation of the MDD GWAS            the CONVERGE study of Han Chinese women.
                                                   findings with those for other neuropsychiatric disease, we used               Taken together, our results indicate the usefulness of a strategy
                                                   available GWAS from PGC, including a bipolar disorder and three            complementary to intensive phenotyping for identifying common
                                                   schizophrenia GWAS (different versions of the PGC schizophrenia            variant associations with phenotypically heterogeneous neuropsychi-
                                                   data sets), as well as neurodegenerative disease GWAS, to test pairwise    atric diseases. The inter-rater reliability of lifetime MDD diagnosis
                                                   genetic correlation with the 23andMe MDD GWAS data set using LD            even with structured interview is modest, with a κ value of 0.32–0.57
                                                   score regression. Because shared controls are used for the PGC data        (refs. 23,24); conversely, the reliance on treatment-seeking patients in
                                                   sets, we did not use the results from the meta-analysis of the 23andMe     the present analysis rather than volunteers responding to advertise-
                                                   and PGC data. The highest correlation with the primary 23andMe             ments lends additional face validity to the phenotype25. The finding

Nature Genetics ADVANCE ONLINE PUBLICATION 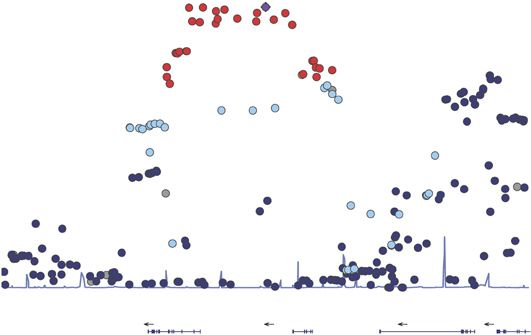
Articles
in other large-scale analyses that cohorts ascertained on the basis of 2. Lopez, A.D., Mathers, C.D., Ezzati, M., Jamison, D.T. & Murray, C.J. Global and
regional burden of disease and risk factors, 2001: systematic analysis of population
treatment versus structured interview yield similar associations12 and health data. Lancet 367, 1747–1757 (2006).
that such phenotypes are consistent with those defined by structured 3. Wittchen, H.U. et al. The size and burden of mental disorders and other disorders
interview26 adds confidence to the validity of this approach12. In light of the brain in Europe 2010. Eur. Neuropsychopharmacol. 21, 655–679
(2011).
of the massive impact of such disorders on health worldwide, any 4. Lichtenstein, P. et al. Recurrence risks for schizophrenia in a Swedish national
approach that can help elucidate pathophysiology merits consideration. cohort. Psychol. Med. 36, 1417–1425 (2006).
The finding that a locus previously linked to other neuropsychiatric 5. Sullivan, P.F., Kendler, K.S. & Neale, M.C. Schizophrenia as a complex trait:
evidence from a meta-analysis of twin studies. Arch. Gen. Psychiatry 60,
disease increases MDD risk also adds to a growing literature indicat- 1187–1192 (2003).
ing the pleiotropy of such risk-associated genes. 6. CONVERGE Consortium. Sparse whole-genome sequencing identifies two loci for
major depressive disorder. Nature 523, 588–591 (2015).
7. Hawrylycz, M.J. et al. An anatomically comprehensive atlas of the adult human
URLs. Psychiatric Genomics Consortium (PGC MDD, bipolar dis- brain transcriptome. Nature 489, 391–399 (2012).
order, SCZ1, SCZ1 + SWE, and SCZ2 data sets), https://www.med. 8. Le Meur, N. et al. MEF2C haploinsufficiency caused by either microdeletion of the
5q14.3 region or mutation is responsible for severe mental retardation with
unc.edu/pgc; International Genomics of Alzheimer’s Project (IGAP stereotypic movements, epilepsy and/or cerebral malformations. J. Med. Genet. 47,
AD data set), http://www.pasteur-lille.fr/en/recherche/u744/igap/ 22–29 (2010).
igap_download.php; International Parkinson Disease Genomics 9. Paciorkowski, A.R. et al. MEF2C haploinsufficiency features consistent hyperkinesis,
variable epilepsy, and has a role in dorsal and ventral neuronal developmental
Consortium (IPDGC PD data set), http://www.pdgene.org/; Global pathways. Neurogenetics 14, 99–111 (2013).
Lipids Genetics Consortium (GLGC LDL data set), http://csg.sph. 10. Barbosa, A.C. et al. MEF2C, a transcription factor that facilitates learning and
memory by negative regulation of synapse numbers and function. Proc. Natl. Acad.
umich.edu//abecasis/public/lipids2013/. Sci. USA 105, 9391–9396 (2008).
11. Wilkinson, M.B. et al. Imipramine treatment and resiliency exhibit similar chromatin
Methods regulation in the mouse nucleus accumbens in depression models. J. Neurosci. 29,
© 2016 Nature America, Inc. All rights reserved.
7820–7832 (2009).
Methods and any associated references are available in the online 12. Schizophrenia Working Group of the Psychiatric Genomics Consortium. Biological
version of the paper. insights from 108 schizophrenia-associated genetic loci. Nature 511, 421–427
(2014).
Note: Any Supplementary Information and Source Data files are available in the 13. Cross-Disorder Group of the Psychiatric Genomics Consortium. Identification of risk
online version of the paper. loci with shared effects on five major psychiatric disorders: a genome-wide analysis.
Lancet 381, 1371–1379 (2013).
Acknowledgments 14. Major Depressive Disorder Working Group of the Psychiatric GWAS Consortium. A
mega-analysis of genome-wide association studies for major depressive disorder.
We would like to thank the research participants and employees of 23andMe
Mol. Psychiatry 18, 497–511 (2013).
for making this work possible. The authors thank the investigators and patient 15. Whitehead, A. Meta-Analysis of Controlled Clinical Trials (John Wiley & Sons,
participants of the Psychiatric Genomic Consortium Major Depressive Disorder 2002).
study for making the PGC MDD phase 1 results available for download. 16. Agoston, Z. et al. Meis2 is a Pax6 co-factor in neurogenesis and dopaminergic
This study was supported in part by Pfizer, Inc. R.H.P. is supported in part by the periglomerular fate specification in the adult olfactory bulb. Development 141,
National Institute of Mental Health and the National Human Genome Research 28–38 (2014).
Institute (P50 MH106933). We also thank the Social Science Genetics Association 17. Agoston, Z., Li, N., Haslinger, A., Wizenmann, A. & Schulte, D. Genetic and physical
Consortium (SSGAC) for sharing results for subjective well-being, depressive interaction of Meis2, Pax3 and Pax7 during dorsal midbrain development.
BMC Dev. Biol. 12, 10 (2012).
symptoms, and neuroticism.
18. Pers, T.H. et al. Biological interpretation of genome-wide association studies using
predicted gene functions. Nat. Commun. 6, 5890 (2015).
AUTHOR CONTRIBUTIONS
19. Purcell, S., Cherny, S.S. & Sham, P.C. Genetic Power Calculator: design of linkage
A.R.W., C.L.H., and J.R.W. conceived the meta-analysis and statistical analysis. and association genetic mapping studies of complex traits. Bioinformatics 19,
A.R.W., C.L.H., and R.H.P. oversaw data set analysis and primary data interpretation. 149–150 (2003).
C.L.H. designed and performed meta-analysis and further statistical analysis of the 20. Bulik-Sullivan, B.K. et al. LD Score regression distinguishes confounding from
three data sets. X.C. provided statistical support and data visualization for the meta- polygenicity in genome-wide association studies. Nat. Genet. 47, 291–295
analysis. M.W.N. provided DEPICT functional annotation and LD score regression (2015).
analyses. R.H.P., A.R.W., and C.L.H. wrote the manuscript. A.R.W., R.H.P., C.L.H., 21. Okbay, A. et al. Genetic variants associated with subjective well-being, depressive
D.A.H., S.A.P., and M.W.N. provided data interpretation and revised the manuscript. symptoms, and neuroticism identified through genome-wide analyses. Nat. Genet.
48, 624–633 (2016).
J.Y.T. and D.A.H. conceived and designed the 23andMe MDD GWAS. D.A.H. and
22. Psychiatric GWAS Consortium Bipolar Disorder Working Group. Large-scale genome-
C.T. performed GWAS for 23andMe data sets and statistical support. wide association analysis of bipolar disorder identifies a new susceptibility locus
near ODZ4. Nat. Genet. 43, 977–983 (2011).
COMPETING FINANCIAL INTERESTS 23. Keller, M.B. et al. Results of the DSM-IV mood disorders field trial. Am. J. Psychiatry
The authors declare competing financial interests: details are available in the online 152, 843–849 (1995).
version of the paper. 24. Regier, D.A. et al. DSM-5 field trials in the United States and Canada, Part II:
test–retest reliability of selected categorical diagnoses. Am. J. Psychiatry 170,
59–70 (2013).
Reprints and permissions information is available online at http://www.nature.com/
25. Wisniewski, S.R. et al. Can phase III trial results of antidepressant medications be
reprints/index.html. generalized to clinical practice? A STAR*D report. Am. J. Psychiatry 166, 599–607
(2009).
1. Angst, F., Stassen, H.H., Clayton, P.J. & Angst, J. Mortality of patients with mood 26. Castro, V.M. et al. Validation of electronic health record phenotyping of bipolar
disorders: follow-up over 34-38 years. J. Affect. Disord. 68, 167–181 (2002). disorder cases and controls. Am. J. Psychiatry 172, 363–372 (2015).
aDVANCE ONLINE PUBLICATION Nature GeneticsONLINE METHODS simulated admixed individuals to recalibrate the HMM probabilities so that
Data access. The full GWAS summary statistics for the 23andMe discovery data the reported assignments were consistent with the simulated admixture pro-
set will be made available through 23andMe to qualified researchers under an portions. The reference population data were derived from public data sets
agreement with 23andMe that protects the privacy of the 23andMe participants. (the Human Genome Diversity Project, HapMap, and 1000 Genomes Project),
Please contact David Hinds (dhinds@23andme.com) for more information and as well as 23andMe customers who have reported having four grandparents
to apply to access the data. Information for the 10,000 most significant SNPs from the same country.
from the discovery 23andMe GWAS is included in Supplementary Table 12. A maximal set of unrelated individuals was chosen for each analysis using
a segmental identity-by-descent (IBD) estimation algorithm33. Individuals
Population and study design. Participants were part of the customer base were defined as related if they shared more than 700 cM identical by descent,
of 23andMe, a consumer genetics company. This cohort has been described including regions where the two individuals shared either one or both genomic
in detail elsewhere27,28. Participants provided informed consent and par- segments identical by descent. This level of relatedness (sharing of roughly 20%
ticipated in the research online. The protocol was approved by an external of the genome) corresponds approximately to the minimal expected sharing
AAHRPP-accredited institutional review board, Ethical and Independent between first cousins in an outbred population. When constructing the repli-
Review Services. The discovery cohort was selected from participant data cation cohort, we identified unrelated individuals who were also unrelated to
available in January 2015, and the replication cohort was selected in January all individuals used in the discovery analysis.
2016 from additional data available at that time. We used principal-component analysis (PCA) to characterize residual
population structure in the subset of 23andMe participants with European
Genotyping, quality control, and imputation. DNA extraction and genotyping ancestry. We computed principal components using 82,654 SNPs that were
were performed on saliva samples by the National Genetics Institute (NGI), genotyped on all 23andMe array designs, with Hardy–Weinberg P value >1
a CLIA-licensed clinical laboratory and a subsidiary of the Laboratory × 10−40, MAF >0.01, and call rate >99%, excluding regions of extended long-
Corporation of America. Samples were genotyped on one of four genotyping range LD. We used the ARPACK library34 to compute principal components
platforms. The V1 and V2 platforms are variants of the Illumina HumanHap550+ using data for 519,914 individuals across all array designs; additional individu-
© 2016 Nature America, Inc. All rights reserved.
BeadChip, including about 25,000 custom SNPs selected by 23andMe. The V3 als were then projected onto this set of eigenvectors.
platform is based on the Illumina OmniExpress+ BeadChip, with custom con- The proportion of variance explained by each principal component is shown
tent to improve overlap with theV2 array. The V4 platform used most recently in Supplementary Figure 2a and the proportion of each component’s variance
is a fully custom array, including a lower-redundancy subset of V2 and V3 SNPs that is explained by country of ancestry is shown in Supplementary Figure 2b,
with additional coverage of lower-frequency coding variation. Platforms V1–V4 for a set of individuals reporting four grandparents from a single country.
contain 586,916, 584,942, 1,008,948, and 570,000 SNPs, respectively. Samples The first five principal components were largely explained by geographical
that failed to reach a call rate of 98.5% were reanalyzed. Individuals whose ancestry, whereas higher-order principal components were not.
analyses failed repeatedly were recontacted by 23andMe customer service to
provide additional samples, as is done for all 23andMe customers. GWAS and meta-analysis. In the GWAS and replication analysis, we com-
Participant genotype data were imputed against the September 2013 release puted association test results by logistic regression assuming additive allelic
of the 1000 Genomes Project Phase 1 reference haplotypes, phased with effects. For tests using imputed data, we used the imputed dosages rather than
SHAPEIT2 (ref. 29). We phased using an internally developed phasing tool, best-guess genotypes. We included covariates for age, sex, and the top five
Finch, which implements the Beagle haplotype graph–based phasing algo- principal components to account for residual population structure. Although
rithm30, modified to separate the haplotype graph construction and phasing we could justify the choice of five principal components on the basis of the
steps. Finch extends the Beagle model to accommodate genotyping error and preceding ancestry analysis, we actually chose to use five because of computa-
recombination, to handle cases where there are no consistent paths through tional considerations, and others have noted this to be a reasonable choice35.
the haplotype graph for the individual being phased. We constructed haplotype For quality control of genotyped GWAS results, we removed SNPs that
graphs for European samples on each 23andMe genotyping platform from a were only genotyped on our V1 and/or V2 platform because of small sam-
representative sample of genotyped individuals and then performed out-of- ple size and SNPs on the mitochondrial or Y chromosome because many of
sample phasing of all genotyped individuals against the appropriate graph. these are not genotyped reliably. Using family trio data, we flagged SNPs that
In preparation for imputation, we split phased chromosomes into seg- failed a test for parent–offspring transmission; specifically, we regressed the
ments of no more than 10,000 genotyped SNPs, with overlaps of 200 SNPs. child’s allele count against the mean parental allele count and flagged SNPs
We excluded SNPs with Hardy–Weinberg equilibrium P valuefixed-effects meta-analysis on overlapping SNPs after adjusting the standard a specific follow-up question (4b or 5b). Cases were defined by having positive
errors of each individual analysis for its own λ value (the LD score regression responses to the follow-up question, and controls were the union of the indi-
intercept in the PGC data was 1.0243). Final results from the meta-analysis viduals with “No” responses to either the screening or follow-up question.
were further adjusted for the overall LD score regression intercept of 1.0025. As a result of the staging of the discovery and replication analyses, the dis-
covery cohort did not include any responses from source 5 and the replication
LD score regression. We calculated LD scores (LD Score (LDSC) version cohort consisted almost entirely of responses from source 3 or 5.
1.0.0) as previously described using the European 1000 Genomes Project refer- In sources 1 and 3–5, we also asked for an age of first diagnosis of depres-
ence panel (phase 3 version 5a) with a MAF cutoff for SNP inclusion greater sion. These data were provided by a majority of participants, including 74% of
than 5%. GWAS summary statistics data were collected from the following cases in the discovery cohort and 85% of cases in the replication cohort.
resources: PGC (MDD, bipolar disorder, SCZ1, SCZ1 + SWE, and SCZ2), the We used Cohen’s κ to assess agreement across responses for sources 1–5,
International Genomics of Alzheimer’s Project (IGAP AD), the International taking advantage of participants who had responded to more than one of the
Parkinson Disease Genomics Consortium (IPDGC PD), and the Global Lipids survey data sources (Supplementary Table 14).
Genetics Consortium (GLGC LDL). GWAS data were harmonized using the Agreement was good in most comparisons (κ > 0.7) but was somewhat
munge_sumstats.py function (using the SNP list derived from LD score worse for comparisons with branched source 4 (κ between 0.5 and 0.7). Source
calculation), and genomic inflation control intercepts were calculated for the 4 systematically undercalled cases in comparison to the other sources, appar-
23andMe MDD data, PGC MDD data, and PGC + 23andMe meta-analysis data ently because of the wording of the screening question. This tendency was
using the ldsc.py function (with all default settings and options). Additionally, partially mitigated in the logic for the combined phenotype, where we prefer-
we calculated liability heritability estimates for the meta-analysis using the entially used responses to sources 1–3 if available.
same function, with a population prevalence estimation of 15% or 25%, as The logic for composing the depression phenotype in this way was based on
previously described13. Finally, we calculated the cross-trait regression between several considerations. For most participants (>95%), we had just one response
the 23andMe MDD GWAS and PGC data sets, the IGAP data, the IPDGC data, or the available responses were all in agreement, so a deeper analysis of the
and the GLGC data. mismatch data was unlikely to substantially affect downstream results. Our
© 2016 Nature America, Inc. All rights reserved.
strategy of selecting one response per participant without regard for the other
Trait ascertainment. Subjects with depression were identified through self- responses of this individual also seemed least likely to introduce bias in clas-
report in web-based surveys. A total of six survey data sources were used to sification of participants who provided multiple responses.
compose the depression phenotype:
Secondary phenotypes. A set of common comorbidities of depression were
1. (Your Medical History survey: 2009–2013): “Have you ever been diag- defined on the basis of responses to single questions, as follows:
nosed by a doctor with any of the following psychiatric conditions?”
(options for Depression: Yes, No, I don’t know) • Anxiety (Health Intake survey, unbranched, 2014–2015): “Have you
2. (Research Snippet: 2010–2014): “Have you ever been diagnosed with ever been diagnosed with or treated for anxiety?” (options: Yes, No,
clinical depression?” (answers: Yes, No, I’m not sure) I don’t know)
3. (Health Intake survey, unbranched: 2014–2015): “Have you ever been • Panic attacks (Health Intake survey, unbranched, 2014–2015): “Have
diagnosed with or treated for any of the following conditions?” (options you ever been diagnosed with or treated for panic attacks?” (options:
for Depression: Yes, No, I’m not sure) Yes, No, I don’t know)
4. (Health Intake survey, branched: 2013) • Insomnia (Research Snippet, 2013–2016): “Do you routinely have
4a. “Have you ever been diagnosed or treated for any of the following trouble getting to sleep at night?” (options: Yes, No, I don’t know)
conditions?” (options for “A mental health or psychiatric condition”: • Taking an SSRI (Research Snippet, 2013–2016): “Are you currently taking
Yes, No, I’m not sure) an SSRI (selective serotonin reuptake inhibitor) for any reason?” (options:
4b. “What mental health problems have you had? Please check all that Yes, No, I don’t know)
apply” (checkbox: Depression) • Ever taken medication for a mental health condition, prescription sleep
5. (Health Profile survey: 2015–2016) aids, or prescription pain medication (Health Intake survey, unbranched,
5a. “Have you ever been diagnosed with or treated for any of the fol- 2014–2015): “Have you ever taken these medications?” “Medications
lowing conditions? Anxiety, Attention deficit disorders, Bipolar to treat depression or anxiety or another mental health condition,”
disorder/manic depression, Depression, Eating disorder (such as “Prescription sleep aids,” “Prescription pain medications” (checkbox for
anorexia or bulimia)” (answers: Yes, No, I’m not sure) each category)
5b. “Have you ever been diagnosed with or treated for depression?”
(answers: Yes, No, I’m not sure) Overweight and obesity were defined on the basis of BMI (>27 and >30,
6. (Health Followup survey: 2014–2015): “In the last 2 years, have you respectively), computed from self-reported height and weight, which were
been newly diagnosed with or started treatment for any of the following collected using fill-in forms in multiple survey contexts.
conditions?” (options for Depression: Yes, No, I’m not sure)
Associations with secondary phenotypes and age of onset. We computed
Sources 1 and 3–5 represent four different iterations of a general medical GRSs on the basis of the 17 SNPs with P valuesDEPICT functional analysis. We used DEPICT18 to determine the most 28. Tung, J.Y. et al. Efficient replication of over 180 genetic associations with
likely causal gene at each of the depression-associated loci and to assess self-reported medical data. PLoS One 6, e23473 (2011).
29. 1000 Genomes Project Consortium. An integrated map of genetic variation from
reconstituted gene sets enriched for and tissues highly expressing these genes. 1,092 human genomes. Nature 491, 56–65 (2012).
The reconstituted gene sets used in the analysis were derived from publicly 30. Browning, S.R. & Browning, B.L. Rapid and accurate haplotype phasing and
available gene set annotations, which were then integrated with data from missing-data inference for whole-genome association studies by use of localized
77,840 gene expression arrays36, to predict which other genes were likely to haplotype clustering. Am. J. Hum. Genet. 81, 1084–1097 (2007).
31. Fuchsberger, C., Abecasis, G.R. & Hinds, D.A. minimac2: faster genotype imputation.
be part of these gene sets. Bioinformatics 31, 782–784 (2015).
For the analysis, we selected SNPs significantly associated with depression at 32. Durand, E.Y., Do, C.B., Mountain, J.L. & Macpherson, J.M. Ancestry Composition:
P < 1 × 10⁻⁵. After clumping these SNPs using 500-kb flanking regions and an a novel, efficient pipeline for ancestry deconvolution. Preprint at bioRxiv http://
LD cutoff of r2 > 0.1, 63 independent SNP signals were identified from 816 top dx.doi.org/10.1101/010512 (2014).
33. Henn, B.M. et al. Cryptic distant relatives are common in both isolated and
variants. These 63 top SNPs were further merged into 59 nonoverlapping loci cosmopolitan genetic samples. PLoS One 7, e34267 (2012).
containing 157 genes, which were then assessed using the DEPICT algorithm 34. Lehoucq, R.B., Sorensen, D.C. & Yang, C. ARPACK Users’ Guide: Solution of Large-
for gene set and tissue enrichment18. The results shown in Supplementary Scale Eigenvalue Problems with Implicitly Restarted Arnoldi Methods (SIAM,
Table 3 were not corrected for multiple testing. 1998).
35. Tucker, G., Price, A.L. & Berger, B. Improving the power of GWAS and
avoiding confounding from population stratification with PC-Select. Genetics 197,
1045–1049 (2014).
27. Eriksson, N. et al. Web-based, participant-driven studies yield novel genetic 36. Fehrmann, R.S. et al. Gene expression analysis identifies global gene dosage
associations for common traits. PLoS Genet. 6, e1000993 (2010). sensitivity in cancer. Nat. Genet. 47, 115–125 (2015).
© 2016 Nature America, Inc. All rights reserved.
doi:10.1038/ng.3623 Nature GeneticsYou can also read