Extraction and Visualization of Ocular Blood Vessels in 3D Medical Images Based on Geometric Transformation Algorithm
←
→
Page content transcription
If your browser does not render page correctly, please read the page content below
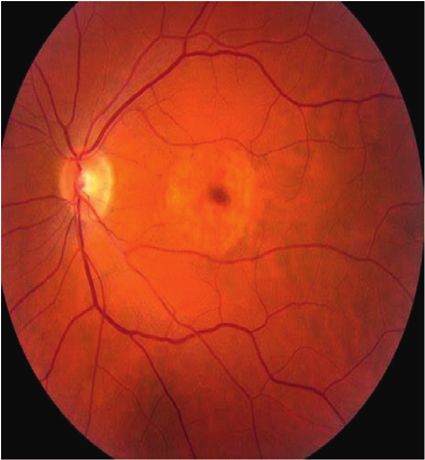
Hindawi
Journal of Healthcare Engineering
Volume 2021, Article ID 5573381, 13 pages
https://doi.org/10.1155/2021/5573381

Research Article
Extraction and Visualization of Ocular Blood Vessels in 3D
Medical Images Based on Geometric Transformation Algorithm

 Zhike Zhang,1 Shuixin Zhang,2 and Hongyu Feng 3

 1
 Department of Ophthalmology, China-Japan Friendship Hospital, Beijing 100029, China
 2
 Department of Traditional Chinese Medicine, Haidian Traditional Chinese Medical Hospital, Beijing 100080, China
 3
 Henan Institute of Science and Technology, Xinxiang 453003, Henan, China

 Correspondence should be addressed to Hongyu Feng; fyr@hist.edu.cn

 Received 11 January 2021; Revised 13 February 2021; Accepted 20 February 2021; Published 28 February 2021

 Academic Editor: Zhihan Lv

 Copyright © 2021 Zhike Zhang et al. This is an open access article distributed under the Creative Commons Attribution License,
 which permits unrestricted use, distribution, and reproduction in any medium, provided the original work is properly cited.
 Data extraction and visualization of 3D medical images of ocular blood vessels are performed by geometric transformation
 algorithm, which first performs random resonance response in a global sense to achieve detection of high-contrast coarse blood
 vessels and then redefines the input signal as a local image shielding the global detection result to achieve enhanced detection of
 low-contrast microfine vessels and complete multilevel random resonance segmentation detection. Finally, a random resonance
 detection method for fundus vessels based on scale decomposition is proposed, in which the images are scale decomposed, the
 high-frequency signals containing detailed information are randomly resonantly enhanced to achieve microfine vessel seg-
 mentation detection, and the final vessel segmentation detection results are obtained after fusing the low-frequency image signals.
 The optimal stochastic resonance response of the nonlinear model of neurons in the global sense is obtained to detect the high-
 grade intensity signal; then, the input signal is defined as a local image with high-contrast blood vessels removed, and the
 parameters are optimized before the detection of the low-grade intensity signal. Finally, the multilevel random resonance response
 is fused to obtain the segmentation results of the fundus retinal vessels. The sensitivity of the multilevel segmentation method
 proposed in this paper is significantly improved compared with the global random resonance results, indicating that the method
 proposed in this paper has obvious advantages in the segmentation of vessels with low-intensity levels. The image library was
 tested, and the experimental results showed that the new method has a better segmentation effect on low-contrast microscopic
 blood vessels. The new method not only makes full use of the noise for weak signal detection and segmentation but also provides a
 new idea of how to achieve multilevel segmentation and recognition of medical images.

1. Introduction provide objective, accurate measurements of retinal vessel
 abnormalities [3]. There are many small blood vessels in the
The retinal vascular network is the only vascular system that fundus image, and the only ones that can be directly vi-
can be visualized and photographed in vivo. Retinal vascular sualized noninvasively are the deeper blood vessels in the
imaging can provide clinical prognostic information for body [4]. Age-related macular degeneration, among other
patients suffering from specific cardiovascular and oph- eye diseases, is also closely associated with diseases such as
thalmic diseases [1]. Segmentation of the retinal vasculature hypertension, atherosclerosis, and diabetes. Segmenting
is a prerequisite for monitoring the status of the retinal blood vessels and extracting blood vessel features from
vascular network [2]. Currently, retinal vascular segmen- fundus images are very important to improve the conve-
tation is highly dependent on manual work by experienced nience when visiting patients, so that doctors can quickly
ophthalmologists, which is tedious, time-consuming, and diagnose and find diseases and improve diagnosis efficiency.
has low reproducibility. Therefore, a fully automated and In addition to its medical importance, the study of fundus
accurate retinal vessel segmentation method is urgently vascular imaging is also an important reference in biometric
needed to reduce the workload of ophthalmologists and identification [5]. By extracting and detecting retinal blood
2 Journal of Healthcare Engineering

vessels and measuring and analysing the relevant features of To sum up, the current auxiliary diagnostic systems often
blood vessels such as width, angle, and degree of curvature, have problems such as slow computing and inaccurate
several diseases mentioned above can be analysed and calculation, and doctors do not dare to hand over patients
predicted to a great extent and used as a basis for the di- directly to the auxiliary diagnostic systems. The system often
agnosis of relevant diseases so that scientific disease pre- appears as an auxiliary tool for the doctor. Only by sig-
vention and corresponding drug treatment can be carried nificantly improving the diagnostic accuracy of the auxiliary
out [6]. Not only that, with the acquisition of enough data, it diagnostic system will it be possible to achieve commercial
is possible to achieve more accurate and rapid assisted di- use in the future. The use of such an intelligent diagnostic
agnostic decisions for ophthalmic diseases, driven by system in clinical medicine will not only significantly im-
massive data [7]. On the other hand, if we do not use prove the diagnostic accuracy but also effectively solve the
computer-aided technology to segment the retinal vessels in problem of a severe shortage of glaucoma-related experts.
the fundus, we can only rely on the doctors’ own experience Therefore, in recent years, the optic cup segmentation of
to perform subjective segmentation of the vessels, but the fundus images has received much attention in research
subjective segmentation is time-consuming and inefficient, related to the diagnosis of retinal optic nerve diseases. The
and the accuracy is low, and the subjectivity is too strong [8]. methods summarized and classified above have made great
Different doctors often give different segmentation results contributions to the detection of fundus retinal vessel seg-
for the same fundus image, and even the same doctor will mentation and provided multidimensional divergent ideas
give different results for the same fundus image before and for research in this field, but overall there are still certain
after two different segmentation tests. The absence of an limitations in each method, such as excessive computation,
objective segmentation result can cause great problems for poor anti-interference ability, too narrow adaptive range,
the patient’s smooth follow-up [9]. and so on, which make the field still have a lot of space to
 Alam et al. proposed an adaptive detection-deletion explore. Most of the existing methods for fundus vessel
mechanism for vessel tracking detection, in which a one- segmentation still cannot solve the problems well, including
dimensional filter defines the tracking path, and the seg- too many prerequisites for algorithm implementation, too
mented detected vessel segments are removed from the film to many limitations, unsatisfactory results for detection of
prevent overlapping detection, and the next tracking starting vessel centreline highlighting and focal areas, poor perfor-
point is found from the remaining vessel branches, and the mance for detection of low-contrast microvessels at the edge
cycle is iterated to complete the detection [10]. Motta et al. of the optic disc, poor accuracy of vessel centreline ex-
proposed a multiscale line tracking method with morpho- traction, which cannot meet the purpose of clinical medi-
logical assistance, in which the brightest points in the image cine, etc. Therefore, this paper focuses on solving the
pixels are selected as the initial seed points for tracking until problem of poor detection performance of low-contrast
the vessel profile does not satisfy the tracking conditions [11]. microvessels by introducing stochastic resonance theory
Lee et al. proposed a blood vessel tracking method based on mechanism, hoping to improve the detection performance
Bayesian theory and multiscale linear detection by consid- of microvessels in fundus retinal images and to provide new
ering all the features of blood vessel intersection and ideas for research in this field.
branching points as well as the cross-sectional direction and
vertical grayscale profile of blood vessels [12]. However, such 2. Geometric Transformation Algorithms for
methods can generally segment and detect only some local Image Extraction and Visualization Analysis
information on blood vessels, and their tracking paths are
easily interrupted by branch points and intersections, 2.1. Geometric Transformation Algorithm Design. We gen-
resulting in inaccurate segmentation results [13]. Zhang et al. erally must go through a preprocessing step of medical
used the Kirsch operator as the convolution kernel for image data before performing medical image alignment, the
matched filtering, but its segmentation detection effect in reasons for which can be summarized as follows: the ac-
microscopic blood vessels with low contrast is still not ob- quired images usually still have a large amount of noise due
vious, and there are voids in the middle of the segmented to the influence of different factors. Other original infor-
detected blood vessels [14]. Rocha et al. used Gabor transform mation is inserted in the image. In general, medical images
to manipulate fundus images to extract pixels and regions that have high dimensional features [18]. The main purpose of
match the vessel features to obtain segmentation detection medical image preprocessing [19] is to improve the quality of
results, but the implementation process needs to be supple- medical images so that the preprocessed medical images
mented with a large number of presegmented standard im- have more features that can be easily detected compared to
ages, and in most cases, there are insufficient conditions for the original images, which facilitates feature extraction al-
implementation [15]. Joseph et al. used a simple pulse-cou- gorithms to extract more features. Compared with other
pled neural network and a fast 2D Otsu threshold segmen- images, the image information contained in medical images
tation method combined with a distributed genetic algorithm is more unique in the medical field. Medical images exhibit
to extract the main blood vessels and proposed a method to more textures and higher resolutions than ordinary images,
automatically detect the retinal blood vessels in the fundus which require more correlation and storage space, and are
[16]. Such methods usually require a large computational also more reliable for clinical applications; therefore, they
effort and are generally poorly resistant to interference and have higher requirements for the relevant medical image
prone to misdetection [17]. alignment algorithms. Also, the quality of medical images
Journal of Healthcare Engineering 3

can be seriously affected during the process of medical image larger value in the histogram will become the main direction
acquisition, transmission, and format conversion. For ex- of the key point. The SIFT algorithm centres on the feature
ample, changes in image grayscale values, noise, and geo- point and accumulates the size and direction of the feature
metric distortion, as well as the loss of image details can point into a histogram and finally obtains a 128-dimensional
reduce image information and even lead to errors. feature vector, which is used to represent the gradient and
 In image alignment, the source of image data and the grayscale distribution information of the region. The last
goodness of the data have a very important connection with step constructs a local feature descriptor based on the image
the robustness and applicability of the developed image gradient in the local neighbourhood of each key point, as
alignment algorithm, while the presence of some useless shown in Figure 2.
information (i.e., not of interest to the researcher) in the Since SIFT feature descriptors determine the location of
image can have an impact on the accuracy of the image key points, the SIFT algorithm determines the feature points
alignment algorithm. However, during the implementation in an image based on the grayscale distribution in the image.
of most image alignment algorithms, we found that they did The extracted feature descriptors contain both geometric
not preprocess the images, which would lead them to affect and grayscale information [20]. The feature points it extracts
the accuracy of the algorithms in subsequent steps such as are unique and the feature points are robust to image
feature extraction and matching. Image preprocessing translation, scaling, rotation, radiometric distortion, a large
usually aims to reduce some image useless information (e.g., amount of noise, and illumination changes, making it
noise) in the image as much as possible and recover more possible to extract feature points for correct matching in a
realistic information in the image as a way to simplify the large amount of image data. Therefore, it has wide appli-
data information in the image so that more useful infor- cation value. Here we are only interested in how to obtain
mation can be efficiently used by the researcher. In short, it the deformation coefficient matrix. To solve for the defor-
enhances the image data quality by suppressing unnecessary mation coefficient matrix, we introduce the energy function,
distortions and enhancing the desired image features. The convert it into a negative log-likelihood and minimize it, and
preprocessing process of medical images directly affects the finally obtain the variance of the deformation coefficient
accuracy of subsequent medical image alignment algo- matrix and the Gaussian mixture model by deriving it. To
rithms. Therefore, it is necessary to preprocess the images ensure the spatial structure of the point set during the
before image alignment so that not only the image quality transformation, we add two geometric structure similarity
can be improved, but also the realism of medical images will constraints to this process. We use the spatial transformation
not be affected, as shown in Figure 1. function to change the spatial position of the source point set
 We generally accomplish retinal image alignment in- so that it approximates the position of the target point set
directly by aligning two feature point sets. In this process, it step by step. There are two quantities involved in the spatial
is necessary to extract appropriate and effective image transformation function, one of which is the Gaussian kernel
feature information to represent the image since our goal function and the other is the deformation coefficient matrix.
aims to ensure the robustness and accuracy of image First, an integration operation is performed on the input
alignment [19]. Therefore, in this paper, preference is given data to obtain an integral image of the original data. After the
to invariant, unique, and highly reproducible features, al- integral image is obtained, the scale space of the original data
though SIFT feature descriptors are typically used to process is obtained using the convolution operation, which enables
image pairs with global statistical dependencies of similar the data to be scale-invariant in the subsequent operations.
intensities. However, these features (e.g., extracted using And all the detected points of interest are based on these
algorithms such as SIFT or SURF) usually do not match scale spaces of different sizes. Secondly, the Hessian matrix
multimodal images with significantly different intensities. To determinant is used to detect the speckle. That is, the Hessian
ensure the generality of the approach, features are extracted matrix operation is performed on the images of each layer in
from edge maps, which are common in retinal images. the scale space, and the Hessian matrix can be written as
 The algorithm will consider the pixels in the 3 × 3 area of 2
 B − MC−1 ∗ MT 0 ⎢ Δx C ⎥ T −1
the same order of the candidate key point and a total of 26- ⎡⎣ ⎦⎤ · ⎡⎣ ⎤⎦ � ⎡⎣ v − M C ⎤⎦. (1)
pixel areas in the upper and lower 2 orders. The point will be MT − B C Δx2 p w
considered as a key point if its pixel gray level satisfies the
local maximum or minimum. In the SIFT algorithm, there is To find the extreme value of the Hessian matrix, we need
a value related to the contrast, which we call the SIFT to solve G determinant, so the approximate Hessian matrix
contrast threshold. If the contrast of a key point is less than determinant can be written as
the threshold we set, the algorithm considers that point to �� ��2
have a lower contrast. If a key point is at the edge of the ��
 �
 ��
 � ⎢
 ⎡ − ��x2i − ℓi �� ⎤⎥
 Gi �x − ℓi � � exp ⎣ ⎦, i � 1, 2, ..., N. (2)
image or has low contrast, it is eliminated to improve the η2i
reliability of the algorithm. The third step is to determine the
main direction based on the local structure of each key point. Then, the extreme value suppression operation is per-
First, the direction of the key point is given a certain value, formed in a scale-space domain of size 3 × 3 × 3, i.e., the
and then the gradient direction is determined based on the central pixel point is compared with the values of its 26
gradient information of the pixels around the point, and surrounding nearest neighbours, and the largest or smallest
then the gradient direction histogram is constructed. The extreme pixel point is selected. Finally, the Taylor formula is
4 Journal of Healthcare Engineering

 Keep the element phase unchanged
 but adjust the amplitude to be unity

 Deduction of base
 composition based
 on the molecular mass

 Amplification using several Descaling and analysis
 Initial array pattern considered primers with ESI-MS

 Decrease the directivity in
 the main lobe in each iteration

 Get reflection coefficients for
 The system gathers all the information obtained from each primer pair
 all the elements

 Figure 1: Geometric transformation algorithm design.

 Loan forgiveness and
 discharge options
 (see primer for details)

 Teacher loan forgiveness
 program

 Death discharge Hardship discharge
 ZigBcc node

 Military Public service loan

 September 11 survivors Forgiveness for direct
 discharge loans

 Closed school discharge Public service loan

 Forgiveness for perkins
 Bankruptcy undue
 loans

 Figure 2: Schematic diagram of the working principle of local geometric structure constraint.
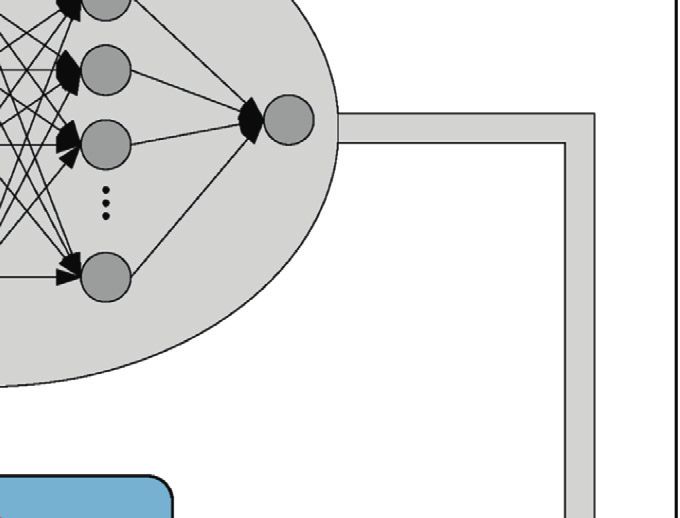
Journal of Healthcare Engineering 5

chosen to fit the surface function, and the point of interest is source feature point set X is updated in this step based on
extracted accurately, and the position (b, w) of the point of this matrix. Since the source feature point set is constructed
interest is obtained with ϕ. At this point, the operation of as a GMM, the spatial transformation update is done by
feature point detection on the input data can be completed. obtaining the optimal values of the GMM parameters.
 Therefore, the spatial transformation update of the nonrigid
 ⎪
 ⎧
 ⎨ ⎪
 ⎫
 ⎬ alignment can be viewed as a parameter optimization
 ϕ∗ � arg max⎪sup b2 (x) − WT S(x) ⎪,
 ⎩ ⎭ process, i.e., finding the optimal parameter matrix of the
 x∈Ω x
 GMM by minimizing the negative log-likelihood function of
 t0 +T0
 z1 ‖c‖2 ≥ S T (τ)c 2 d](τ) ≥ z ‖c‖2 , ∀t0 ≥ 0, c ∈ Rn .
 equation (5), which is shown as follows.
 1 2
 t0
 ⎪
 ⎧
 ⎨ ⎪
 ⎫
 ⎬
 (3) M∗ � arg max⎪sup b(x) − WT S(x) ⎪. (6)
 ⎩ x∈Ω
 ⎭
 x
 The correspondence is first estimated by measuring the
MLF descriptors between two feature point sets using a The expectation-maximization (EM) algorithm is used to
Gaussian mixture model (GMM), and then the probability solve this optimization problem. The EM algorithm consists
density of the GMM is solved using an approximate solution of two steps, calculating the posterior probability (E step)
to the correspondence evaluation problem. and maximizing the expectation (M step).
 t−a �� √�q �� ��

 h ϕ ≤ qh � ∗ min���ℓi − ℓj ��� ≤ 0. (7)
G v 1 Γ(v + m) 2
a Dt f(t) � lim (−1)m fv (t − mh). i≠j
 h⟶0 φv m�0 m!Γ(v − m + 1)
 (4) Feature extraction is performed on the preprocessed
 images. We use the EOH-SIFT feature extraction algorithm to
 After obtaining the PDF of the GMM induced by MLF, complete the feature extraction process for the preprocessed
the correspondence is estimated by computing the posterior image to be aligned and the reference image [21]. The left side
probabilities of the GMM according to Bayes’ rule. shows the feature points extracted from the image to be
 a 2
 aligned, and the right side shows the feature points extracted
 ⎝ ∇ u
 −div⎛ ⎠ + λ u − u2 � 0.
 ⎞ (5) from the reference image. The extraction and combination of
 a 2 e
 multiple features can fully describe the features, facilitate the
 ∇ u + p
 subsequent feature similarity comparison, and improve the
 After obtaining the correspondence matrix between the robustness and accuracy of feature alignment.
two feature point sets, the spatial transformation of the

 1 2 � � ��2
 QN (w) � Pij 1 − Pij + ��wT Xb w��2 + Xb w,
 2 i,j
 (8)
 2 2
 zL n
 ⎢ exp a + mj�1 xij βj ⎥⎦
 ⎡
 ⎣ 2⎤
 � y −
 zβj i�1 i 1 + exp a + m 2 2 xij � 0, j � 1, 2, . . . , m.
 j�1 xij βj

 We use a combination of EOH-SIFT features, global correspondence between two-point sets, and the corre-
geometric structure features, and local geometric features for spondence matrix is obtained by a Gaussian mixture model
feature point extraction using the EOH-SIFT algorithm. We and Bayesian principle. The particle swarm algorithm
use the Euclidean distance for the global geometric features simulates the birds in a flock of birds by designing a massless
and vector-based feature descriptors for the local geometric particle. The particles have only two attributes: speed and
features. This is an innovative point of our proposed al- position. Speed represents the speed of movement, and
gorithm. We add the proposed multifeature (MLF) to the position represents the direction of movement. Each particle
Gaussian mixture model, and we consider the set of feature searches for the optimal solution separately in the search
points obtained from the image to be aligned (we call it the space, records it as the current individual extreme value,
source point set) as the set of centres of mass of the mixture shares the individual extreme value with other particles in
model and the set of feature points obtained from the ref- the entire particle swarm, and finds the optimal individual
erence image (we call it the target point set) as the data extreme value as the entire particle. All particles in the
points and find the correspondence between them to sim- particle swarm adjust their speed and position according to
plify the problem of solving the probability density. We the current single extreme value found and the current
mainly use the correspondence matrix to find the global optimal solution shared by the entire particle swarm.
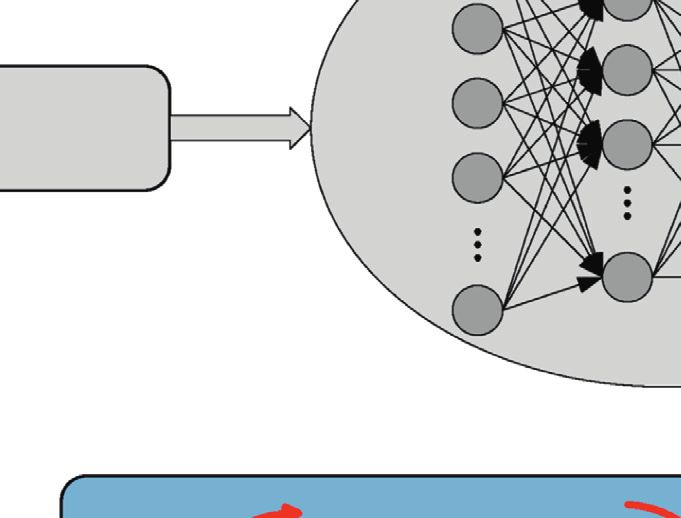
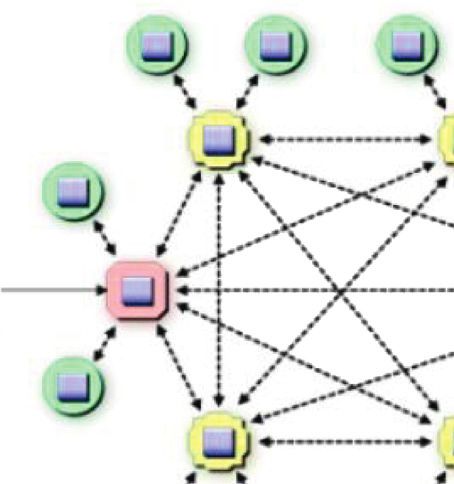
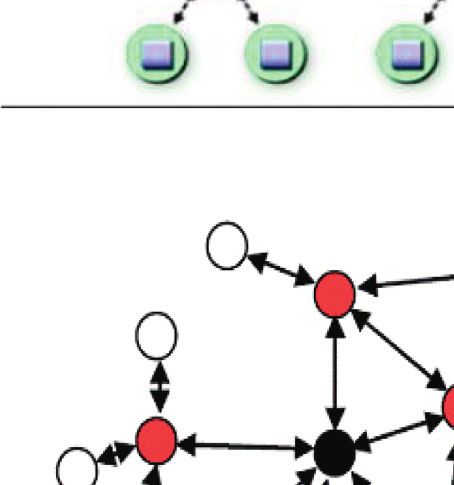
6 Journal of Healthcare Engineering

2.2. Visualization Design of 3D Medical Images of Ocular Preprocessing is the feature extraction and matching
Blood Vessels. Since fundus photographs acquired by work for the input image. The input of this part is the
medical devices often contain many images in which blood original image, and the feature extraction algorithm based
vessels cannot be identified by the naked eye, these images on the scale-invariant feature transform with the improved
are wasted in the segmentation network in terms of com- feature matching process is used. The matching relationship
puting time and are also very likely to affect the accuracy of between the feature points of the output image and the
segmentation, so it is necessary to perform a vessel quality adjacent images is obtained. The spatial point reconstruction
assessment on the images before performing vessel seg- part is based on the result of feature matching using peri-
mentation [22]. The method in this paper uses image polar geometric constraints to recover the camera pose and
processing algorithms to automatically score the clarity of then completes the spatial point reconstruction using this
blood vessels in fundus images. Most current studies related camera projection matrix and triangulation. This part is
to fundus images involve the analysis of fundus vessels, so it divided into two stages: initial reconstruction and iterative
is necessary to assess the quality of fundus vessels. Manual reconstruction. The first input is the feature points of the
assessment of vessel quality is time-consuming and labour- image and the feature point matching relationship between
intensive, and individual variability makes it undesirable in neighbouring images, and then the random sample con-
practical clinical applications. Automated assessment of sensus (RANSAC) algorithm is used to further filter the
vascular quality usually requires the use of large sample sizes matching results and filter out the matching pairs that meet
of training data. However, no dataset exists for fundus the peripolar geometric constraints and enter the initial
vascular quality assessment, making it difficult to apply reconstruction stage. At this time, the camera projection
supervised learning methods, including deep learning. And matrix is calculated by calculating the camera eigenmatrix,
traditional image evaluation systems usually evaluated for and then the initial spatial point reconstruction is completed
features such as image noise do not apply to vascular quality. by this projection matrix and triangulation. Next, we enter
The flow of the evaluation system in this scheme is shown in the iterative reconstruction phase. At this time, the recon-
Figure 3. The evaluation system on the one hand gets rid of structed spatial 3D points are combined with 2D feature
the dependence of supervised learning methods on training points to recover the poses of the newly added view cameras,
datasets and on the other hand discards the limitation of and the remaining matching points in the new view are
traditional image evaluation systems that only evaluate for reconstructed using the camera pose information. This
image noise and other features, effectively solves the process is iterated until all the views have been calculated.
problem of automatic assessment of blood vessel quality, and The coordinates of all calculated 3D point clouds and the
provides a strong basis for fundus image research. recovered camera projection matrix are output, as shown in
 After completing the initial stage, the next stage is the Figure 4.
iterative stage. Since there are already some reconstructed 3D Finally, this reconstruction result is reprocessed and the
points in space, a new view (called view three) is added at this final output is obtained by minimizing the reprojection error
time, and view three and view two are matched due to the using beam levelling. The input of this part is the recon-
ordered image set; those matching points between view three structed 3D point cloud coordinates and the camera pro-
and view two that have completed the reconstruction of 3D jection matrix [24]. The reconstructed 3D points are
points in space can be searched for, and the camera pose of projected to the image plane using the projection matrix,
view three can be calculated using the correspondence be- and the resulting image plane coordinates will be in error
tween these 2D points and their 3D points, and then the pose with the left side of the initial plane. The point cloud co-
of view three and view two can be triangulated. The remaining ordinates and the camera projection matrix are jointly ad-
matching points are reconstructed. This process is repeated justed by the beam levelling method to minimize this error,
until all the views are rebuilt. After 6 iterations and 10 iter- and the point cloud coordinates are then more accurate. The
ations, the processed reconstruction result can be obtained result of this process is output. The body plotting algorithm
[23]. The point cloud results are continuously dense and the is to process each voxel in the 3D data field and map the data
model reduction is gradually increasing. After all the views of the 3D data field to the 2D data plane according to the
have been calculated, the iteration phase is finished. At this characteristics of the optical model. The core idea of volume
point, the complete spatial point cloud coordinates are ob- mapping is that each voxel in the 3D data field has reflection,
tained, but there are still some errors in them. The reason for projection, and refraction of light, so the light from the light
this is that in the process of recovering the spatial point co- source may be absorbed or reflected or projected through the
ordinates, the solution of the eigenmatrix, camera pose, and voxel, making each voxel have a different light intensity and
triangulation is theoretically inaccurate at the time of calcu- colour properties, synthesizing all the voxel data and finally
lation. This error will be further accumulated after more synthesizing the data model. The model drawn by the body
images are added in successive iterations, which affects the drawing algorithm can not only reveal the surface infor-
final reconstruction quality. Therefore, the algorithm needs to mation of the object but also highlight the internal structure
process this result to minimize the reprojection error. Since the of the object. Body drawing algorithms include a ray pro-
derivative function matrix of the 3D reprojection problem is jection algorithm, a sputtering method, shear deformation,
sparse, the efficiency of the beam levelling method is ideal here, snowball throwing method, etc., among which the most
as shown in Section 2.1. After the error minimization process, widely used is the ray projection algorithm. The basic
the result is the final output. principle of light projection algorithm is as follows: set each
Journal of Healthcare Engineering 7

 HADB client HADB client HADB client HADB client HADB client

 Client-server network

 Internode network

 Initial network

 Initial
 input vector

 Output
 Bin-counts of Ahs
 (train and test Update
 group)
 PSO velocity and
 position
 OSNR estimation
 Select pbest Update pbest
 Fitness value value
 and gbest and gbest
 IBPSO (reduction of
 dimensionality)
 Population

 Initial weights Optimized weights
 and thresholds and thresholds Output
 Sparse input
 vector Sparse
 network

 Figure 3: Visualization design framework for medical images.

voxel to start with an initial colour value, from the light signal by using wavelet decomposition, the low-frequency
source, emit a parallel light to each voxel in the 3D data field, signal is a reduced model of the original model, and this part
the light passes through the 3D data field, then do equal of the signal is obtained by the weighted average of the
distance sampling for each light passing through the 3D data neighbourhood of the vertices of the original model, and the
field, then do three linear interpolations for the 8-pixel simplified model consists of a combination of the low-fre-
points in the spatial neighbourhood of each sampled point, quency signal and the filtered high-frequency signal. This
and recalculate the value of each sampled point. Finally, the method is efficient and easy to implement but has a small
colour values and opacity of the recomputed sampling range of use and high requirements for the model.
points on each ray are summed and synthesized to obtain the
final image, as shown in Table 1. 3. Analysis of Results
 In medicine, the body drawing algorithm, by accumu-
lating the colour and opacity of each voxel, forms a 3D 3.1. Analysis of Algorithm Results. The experimental data are
model that can well represent the internal tissues and organs obtained from the vascular model by the MC improvement
of the human body, but the drawing process takes a lot of algorithm, which is simplified by the original QEM algo-
time and memory to calculate each voxel, which makes the rithm and the improved QEM algorithm, and the time
3D reconstruction as well as the model rendering slow [25]. consumed by the two algorithms in achieving different
Wavelet decomposition is often used in the image processing simplification effects is recorded in Figure 5.
part of computer graphics, and now it also used in the field of From Figure 5, we can see the time consumed by different
mesh simplification. The basic idea of this algorithm is as grid models with the simplification rate divided into 20% and
follows: the original model is decomposed into two 40%, and the comparison shows that the improved algorithm
parts—the low-frequency signal and the high-frequency can improve the efficiency of model simplification very well. In
8 Journal of Healthcare Engineering

 LabVIEW
 Apache Visual feature
 Acoustic SQLVI
 generation
 characteristics
 model

 English MySQL CGI
 Target pronunciation Target
 Visual domain domain Acoustic
 characteristics pure voice pure voice characteristics
 data DSN data

 CDBL
 STM-RNN-based Visual
 auditory MySQL characteristics
 feature

 Complete process framework

 Data parser

 CNN-based audio-visual Tasks MySQL Web
 fusion scheduler

 LAMP CGI

 Figure 4: Complete process framework.

 Table 1: Algorithm experimental data parameters.
Name Dinosaur Corridor Merton College III Vercingetorix Alcatraz
View resolution 75 45 38 47 58
Number of views 4 5 6 7 8
Average value 12.5 9.4 9.9 8.6 1.5
Sum value 50 47 59 60 12

 Error rate

 1.0

 0.8
 Number of features

 0.6

 0 1 2 3 4 5 6 7 8 9
 0.4

 0.2

 0.0

 10% reduction rate 40% reduction rate
 20% reduction rate 50% reduction rate
 30% reduction rate 60% reduction rate
 Figure 5: Comparison of the effect of the original and optimized algorithms.
Journal of Healthcare Engineering 9

feature-based image alignment, due to the complexity of The evaluation was performed using 100 retinal image
retinal images (e.g., unavoidable noise, repetitive structures, pairs from multiple views, where 30 retinal image pairs with
occlusions, and multimodal data), the alignment process often less than 50% overlap were selected from the entire dataset to
results in a high percentage of incorrect feature matches. make the test data more challenging. Similarly, the intuitive
Accurate point matching is a crucial and challenging process. results of the method are given by the three typical retinal
The goal is to establish a reliable correspondence and find the image pairs in Figure 7. Clearly, the effect of the continuous
underlying spatial transformation between two sets of feature vessels in the checkerboard and the alignment overlap in the
points (also called key points). For feature-based alignment mosaic shows that the method of this paper can produce so
algorithms, the alignment process involves the feature many correct feature matches that the retinal image pairs can
matching process of points, and good feature matching can be accurately aligned. Since the same modal capture is used,
lead to better experimental results for subsequent feature it is known that edge map extraction may not be necessary
point-based image alignment algorithms. Meanwhile, we can for multiview retinal image alignment. Nevertheless, this
use feature matching as a by-product obtained from image paper still uses the edge map for experimental consistency.
alignment. In this way, we can use the number of correct
matches and the match rate available for indirect character-
ization of performance, where the match rate is defined as the 3.2. Analysis of Visualization Results. It is easy to find that
ratio of the number of correct matches retained to the total the blood vessels in the fundus image are concentrated near
number of matches retained. In our evaluation, the basic facts the optic disc, and the blood vessels far away from the optic
of match correctness are determined by manual inspection. disc are usually very small, while the blood vessels inside the
Although the judgment of correct or incorrect matches seems optic disc are disjointed, both of which are difficult to
to be arbitrary, we set benchmarks to ensure objectivity. identify. Therefore, we consider a circular region with the
 We perform experiments using four different retinal centre of the optic disc as the region of interest (ROI), as
image pairs to test the ability of the method in terms of shown in Figure 8. It is now necessary to determine how
feature matching. The evaluation criterion we use is the much the inner and outer diameters of the circle are more
match rate, comparing our method with GLMD, VFC, SIFT, meaningful for medical diagnosis.
CPD, and RSOC. The match rate is defined as the ratio of the Regarding the selection of the inner and outer diameters
number of correct matches retained to the total number of of the ROI, we considered the region of interest for mor-
matches retained. The results of the quantitative comparison phological analysis by adjusting the morphological analysis
are shown in Figure 6. The results show that our method of the fundus images of the patient population and the
provides the best performance in each group of experiments healthy population to identify the region in which the
and has the highest average feature matching rate. This analysis results of the patient population showed the most
facilitates the accurate estimation of the transformations. significant difference from the analysis results of the healthy
 Experiments were performed using 100 pairs of retinal population. To provide effective data support for the sub-
images. These images with different imaging modalities have sequent medical diagnosis, we finally selected the annular
large intensity variations. First, the intuitive results of the region of interest from 4-fold optic disc radius to 10-fold
method are given by the three typical retinal image pairs in optic disc radius or 12-fold optic disc radius as the region of
Figure 6. For each pair of experiments, the first row is the interest for morphological analysis. Among them, we finally
original retinal image pair, and the corresponding edge maps selected the annulus with a 4× to 10× optic disc radius as the
are placed on the next row. As can be seen from the figure, region of interest.
some tissues in the retinal image pairs, especially the blood The optic nerve head (ONH) transmits visual infor-
vessels and optic nerve discs, have very different intensity mation from the retina to the brain. It acts as the central
structures. However, their corresponding edge maps are very retinal artery and central retinal vein into the entrance and
similar. Therefore, the algorithm can align multimodal exit areas of the eye, providing nourishment to the retina.
retinal images by matching their edge maps with EOH-SIFT The ONH has a central part called the optic cup, which is
features. The third row shows the results of EOH-SIFT responsible for diagnosing glaucoma. Glaucoma is the
feature matching. The left and right sides of the last row second leading cause of vision loss in the world. Glaucoma
present the transformed image and the tessellation of the changes the shape of the cup region. Therefore, the cup-to-
target image, respectively. disc ratio (CDR) is a parameter that can be used as an early
 The mean and standard deviation of RMSE, SD and indicator of glaucomatous abnormalities. The progressive
MAE of the entire data set are shown in Figure 7. The intensity changes between the optic cup and the neuroretina
methods have the best performance in all cases compared to rim (periocular region) ends at the disc border, which can
SIFT, CPD, GLMDTPS, VFC, and RSOC. The average lead to other complications of using image processing
running time of the five methods after excluding the cost of methods for cup segmentation.
EOH-SIFT feature extraction on the test data is shown in To verify its advantages, a quantitative comparison in
Figure 7. In the absence of the cost of EOH-SIFT feature terms of sensitivity (Sn) was performed with the random
extraction, VFC is the most efficient algorithm in terms of resonance results in the global sense. When the first expert’s
average running time compared to the other five methods, manual segmentation results were used as the standard, the
but there is no doubt that the performance of the methods is average value of random resonance results in the global
still competent for the experiments. sense was Sn � 0.5005, while the average value of results

10 Journal of Healthcare Engineering

 1.2 1.0

 1.0
 0.8
 0.8
 Match rate

 Match rate
 0.6
 0.6
 0.4
 0.4
 0.2
 0.2

 0.0 0.0

 0 10 20 30 0 10 20 30
 Interior point rate Interior point rate

 Ours Ours
 SIFT SIFT
 (a) (b)
 1.2
 1.0
 1.0
 0.8
 0.8
 Match rate

 0.6
 Match rate

 0.6
 0.4
 0.4
 0.2
 0.2
 0.0
 0.0
 0 10 20 30
 0 10 20 30
 Interior point rate
 Interior point rate
 Ours
 Ours
 SIFT
 SIFT
 (c) (d)

 Figure 6: Feature matching results of different algorithms on different types of retinal images.

obtained by the multilevel segmentation method was smallest standard deviation from the results of the vessels of
Sn � 0.7012, and the difference between the two was 0.2007. the gold standard compared to the prior art, demonstrating
When the second expert’s manual segmentation results were the high practical value and accuracy and high stability of the
used as the standard, the average value of random resonance proposed method. Many systemic diseases can cause
results in the global sense was Sn � 0.5210, and the average changes in retinal vessel diameter, and the small artery-to-
value of results obtained by the multilevel segmentation vein diameter ratio (AVR) is an important quantitative
method was Sn � 0.7027, and the difference between the two biomarker for the diagnosis of these diseases. We propose
was 0.1817. From the data displayed in Figure 9 and the and validate a novel automated retinal vessel diameter
difference in the mean values, it can be seen that the sen- measurement method. Considering the binary segmentation
sitivity of the multilevel segmentation method in proposed of the fundus, a morphological approach is first used to
in this paper is significantly improved compared with the extract the centreline of the retinal vessels, which is then
global random resonance results, indicating that the method used to determine the location of points in the vessels. Then,
proposed in this paper has obvious advantages in the seg- the Hessian matrix was used to determine the initial ori-
mentation of vessels with low-intensity levels. entation of the vascular skeleton points. Finally, the vessel
 The vessel diameter measurements were performed on diameter is measured based on the determined vessel cen-
KPIs and VDIS in the REVIEW database. The proposed treline and orientation information. The method performs
method has the smallest mean diameter difference and the better compared to several existing techniques.
Journal of Healthcare Engineering 11

 10
 –5.000
 8 –10.00

 6 5.000 –7.500
 7.500
 4 –7.500
 –5.000
 –5.000
 5.000
 2 –2.500

 Values
 0 0.000

 –2 2.500

 –4 5.00 5.000
 5.000 7.500
 –6 –5.000 7.500
 7.500
 –8 10.00
 –7.500
 –5.000
 –10
 –10 –8 –6 –4 –2 0 2 4 6 8 10
 Position
 Figure 7: Comparison of the average running time of different algorithms in aligning multimodal retinal images.

 100
 Recognition rate (%)

 95

 90

 85

 80

 0 2 4 6 8 10
 Subject

 2–10 6–14
 4–12 8–16
 Figure 8: Results of t-test.

 0
 100

 25 80

 60
 Glo
 M

 50
 SV

 bal

 40

 75
 20

 100
 0
 0 20 40 60 80 100
 Multilevel
 Figure 9: Comparison of the sensitivity of the results.
12 Journal of Healthcare Engineering

4. Conclusion [4] W. G. O’Dell, A. K. Gormaley, and D. A. Prida, “Validation of
 the gatortail method for accurate sizing of pulmonary vessels
The geometric transformation algorithm approach uses from 3D medical images,” Medical Physics, vol. 44, no. 12,
separable spatial and channel flow and dense adjacent pp. 6314–6328, 2017.
vessel prediction to capture the maximum spatial corre- [5] G. Du, X. Cao, J. Liang, X. Chen, and Y. Zhan, “Medical image
lation between vessels. Image preprocessing is performed segmentation based on U-net: a review,” Journal of Imaging
to enhance retinal vessel contrast. Geometric transfor- Science and Technology, vol. 64, no. 2, pp. 20508–20512, 2020.
mations and overlapping patches are used in both the [6] S. Jeon, H. B. Song, J. Kim et al., “In Vivo photoacoustic
training and prediction phases to efficiently utilize the imaging of anterior ocular vasculature: a random sample
information learned in the training phase and to refine the consensus approach,” Scientific Reports, vol. 7, no. 1, pp. 1–9,
segmentation. The uncertainty of each pixel in the training 2017.
 [7] P. Afshar, A. Mohammadi, K. N. Plataniotis, A. Oikonomou,
phase is estimated approximately, and then a smaller
 and H. Benali, “From handcrafted to deep-learning-based
uncertainty is used to guide the subsequent segmentation
 cancer radiomics: challenges and opportunities,” IEEE Signal
network. We formulate a modified cross-entropy loss
 Processing Magazine, vol. 36, no. 4, pp. 132–160, 2019.
function. The Γ-convergence of such new models is ex- [8] V. Muneeswaran and M. P. Rajasekaran, “Automatic seg-
plored, and the 2D and 3D numerical results show that the mentation of gallbladder using bio-inspired algorithm based
models have better segmentation results. Then, the seg- on a spider web construction model,” The Journal of Super-
mentation model based on the coupled model of the computing, vol. 75, no. 6, pp. 3158–3183, 2019.
phase-field model and deep learning model is a research [9] X. Zhang, W. Chen, G. Li, and W. Li, “The use of texture
direction worth exploring. Because the phase-field model features to extract and analyze useful information from retinal
does not require too much convolution operation when images,” Combinatorial Chemistry & High Throughput
segmenting 3D brain images, thus saving some segmen- Screening, vol. 23, no. 4, pp. 313–318, 2020.
tation time, it is a valuable research problem if the deep [10] F. Alam, S. U. Rahman, S. Ullah, and K. Gulati, “Medical
learning model is used as a preprocessing step that may image registration in image guided surgery: issues, challenges
enhance the features of its segmented images, which can and research opportunities,” Biocybernetics and Biomedical
save segmentation time on the one hand and improve the Engineering, vol. 38, no. 1, pp. 71–89, 2018.
segmentation accuracy on the other hand. Also, we design [11] D. Motta, W. Casaca, and A. Paiva, “Vessel optimal transport
a building block called an inflated starting block (DIB) to for automated alignment of retinal fundus images,” IEEE
better generalize the model of interest and extract mul- Transactions on Image Processing, vol. 28, no. 12, pp. 6154–
tiscale features more efficiently. The various segmentation 6168, 2019.
 [12] P.-H. Lee, C.-C. Chan, S.-L. Huang, A. Chen, and H. H. Chen,
algorithms proposed in this paper have good segmenta-
 “Extracting blood vessels from full-field OCT data of human
tion performance, and the various morphological analysis
 skin by short-time RPCA,” IEEE Transactions on Medical
methods proposed have more practical application po-
 Imaging, vol. 37, no. 8, pp. 1899–1909, 2018.
tential. It plays a role in promoting the application of [13] V. Satyananda, K. V. Narayanaswamy, and K. Karibasappa,
fundus image analysis in computer-aided disease diag- “Hard exudate extraction from fundus images using water-
nosis systems. In the future, we will conduct more in- shed transform,” Indonesian Journal of Electrical Engineering
depth research and discussion. and Informatics (IJEEI), vol. 7, no. 3, pp. 449–462, 2019.
 [14] J. Zhang, Y. Qiao, M. S. Sarabi et al., “3D shape modeling and
 analysis of retinal microvasculature in OCT-angiography
Data Availability images,” IEEE Transactions on Medical Imaging, vol. 39, no. 5,
 pp. 1335–1346, 2019.
The data used to support the findings of this study are [15] D. A. Da Rocha, A. B. L. Barbosa, D. S. Guimarães et al., “An
available from the corresponding author upon request. unsupervised approach to improve contrast and segmentation
 of blood vessels in retinal images using CLAHE, 2D Gabor
Conflicts of Interest wavelet, and morphological operations,” Research on Bio-
 medical Engineering, vol. 36, no. 1, pp. 67–75, 2020.
The authors declare that they have no conflicts of interest. [16] S. S. Joseph and A. Dennisan, “Three dimensional recon-
 struction models for medical modalities: a comprehensive
 investigation and analysis,” Current Medical Imaging For-
References merly Current Medical Imaging Reviews, vol. 16, no. 6,
 [1] M. Arif and G. Wang, “Fast curvelet transform through ge- pp. 653–668, 2020.
 netic algorithm for multimodal medical image fusion,” Soft [17] L. E. Carvalho, A. C. Sobieranski, and A. Von Wangenheim,
 Computing, vol. 24, no. 3, pp. 1815–1836, 2020. “3D segmentation algorithms for computerized tomographic
 [2] Y. Huang, G. Hu, C. Ji, and H. Xiong, “Glass-cutting medical imaging: a systematic literature review,” Journal of Digital
 images via a mechanical image segmentation method based Imaging, vol. 31, no. 6, pp. 799–850, 2018.
 on crack propagation,” Nature Communications, vol. 11, no. 1, [18] A. Taruttis, A. C. Timmermans, P. C. Wouters,
 pp. 1–15, 2020. M. Kacprowicz, G. M. Van Dam, and V. Ntziachristos,
 [3] D. Maji and A. A. Sekh, “Automatic grading of retinal blood “Optoacoustic imaging of human vasculature: feasibility by
 vessel in deep retinal image diagnosis,” Journal of Medical using a handheld probe,” Radiology, vol. 281, no. 1,
 Systems, vol. 44, no. 10, pp. 1–14, 2020. pp. 256–263, 2016.
Journal of Healthcare Engineering 13

[19] H. Zhao, N. Chen, T. Li et al., “Motion correction in optical
 resolution photoacoustic microscopy,” IEEE Transactions on
 Medical Imaging, vol. 38, no. 9, pp. 2139–2150, 2019.
[20] M. Paknezhad, S. Y. M. Loh, Y. Choudhury et al., “Regional
 registration of whole slide image stacks containing major
 histological artifacts,” BMC Bioinformatics, vol. 21, no. 1,
 pp. 1–20, 2020.
[21] B. Liu, C. Zhu, X. Qu et al., “A cerebrovascular image seg-
 mentation method based on geometrical feature point clus-
 tering and local threshold,” Current Medical Imaging Reviews,
 vol. 14, no. 5, pp. 748–770, 2018.
[22] L. Ji, X. Jiang, Y. Gao, Z. Fang, Q. Cai, and Z. Wei, “ADR-Net:
 context extraction network based on M-Net for medical image
 segmentation,” Medical Physics, vol. 47, no. 9, pp. 4254–4264,
 2020.
[23] F. K. S. Chan, X. Li, and A. W.-K. Kong, “A study of dis-
 tinctiveness of skin texture for forensic applications through
 comparison with blood vessels,” IEEE Transactions on In-
 formation Forensics and Security, vol. 12, no. 8, pp. 1900–1915,
 2017.
[24] V. Deepa, C. Sathish Kumar, and S. Susan Andrews, “Au-
 tomated detection of microaneurysms using Stockwell
 transform and statistical features,” IET Image Processing,
 vol. 13, no. 8, pp. 1341–1348, 2019.
[25] J. De Moura, J. Novo, P. Charlón, N. Barreira, and M. Ortega,
 “Enhanced visualization of the retinal vasculature using depth
 information in OCT,” Medical & Biological Engineering &
 Computing, vol. 55, no. 12, pp. 2209–2225, 2017.
You can also read