Road Show presentation - March 2021 - IGD SiiQ
←
→
Page content transcription
If your browser does not render page correctly, please read the page content below
Road Show presentation

                         March 2021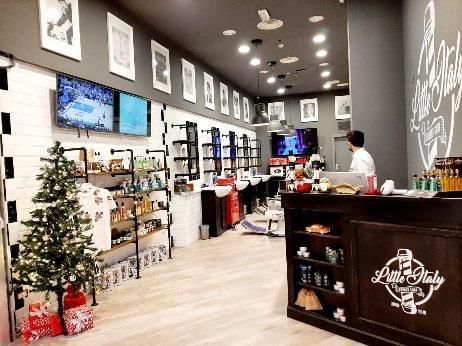
Disclaimer

  This presentation does not constitute an offer or an             These statements include financial projections and
  invitation t o subscribe for or purchase any securities.         estimates and their underlying assumptions, statements
                                                                   regarding plans, objectives and expectations with
  The securities referred t o herein have not been registered      respect t o future operations, products and services, and
  and will not be registered in the United States under the        statements regarding plans, performance.
  U.S. Securities A c t of 1933, as amended (the “Securities
  Act”), or in Australia, Canada or Japan or any other             Although the management of IGD SIIQ SPA believes
  jurisdiction where such an offer or solicitation would           that the expectations reflected in such forward-looking
  require the approval of local authorities or otherwise be        statements are reasonable, investors and holders of IGD
  unlawful. The securities may not be offered or sold in           SIIQ are cautioned that forward-looking information
  the United States or t o U.S. persons unless such                and statements are subject t o various risk and
  securities are registered under the Securities Act, or an        uncertainties, many of which are difficult t o predict
  exemption from the registration requirements of the              and generally beyond the control of IGD SIIQ; that
  Securities A c t is available. Copies of this presentation are   could cause actual results and developments t o differ
  not being made and may not be distributed or sent into           materially from those expressed in, or implied or
  the United States, Canada, Australia or Japan.                   projected by, the forward-looking statements.

  This presentation contains forwards-looking information          These risks and uncertainties include, bu t are not limited
  and statements about IGD SIIQ SPA and its Group.                 to, those contained in this presentation.

  Forward-looking statements are statements that are               Except as required by applicable law, IGD SIIQ does not
  not historical facts.                                            undertake any obligation t o update any forward-
                                                                   looking information or statements.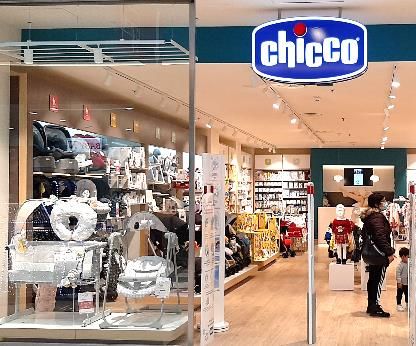
Index

   1    Introduction to
        IGD
                            Pag. 4
                                      5
                                      Dividend and
                                      Outlook          Pag. 41

   2    Operating
        performances
        in 2020             Pag. 10   6
                                      Sustainability

                                                       Pag. 44

   3    Portfolio and
        projects
                            Pag. 22   7
                                      Appendix
                                                       Pag. 46

   4    FY2020
        Financial results
                            Pag. 31

                                                                 3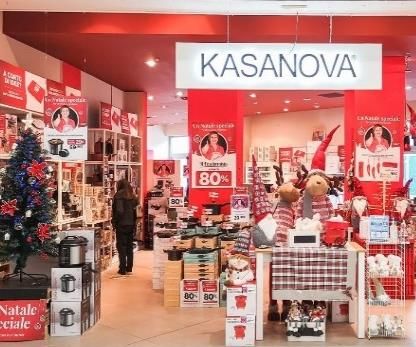
1
Introduction to IGD

IGD at a Glance

   IGD is the leading Italian listed developer and operator of Italian quality retail real estate properties: develops
   and manages shopping centers across the country and has also a presence in retail distribution in Romania

                                         IGD #1 italian retail SIIQ (REIT) - Portfolio
                   €2,265.7mn Portfolio
                Mainly Malls / Retail Parks /                    75 asset          Rental Income c.150MM                5.3% EPRA Net Initial Yield
                       Hypermarkets
                                                                                                                        5.4% net initial yield topped-up
                                     ITALY                                                ROMANIA

                                                                                                                        65.3% Ebitda margin*
                                                                                  Bistrita
                                         27 shopping malls                       Cluji        Piatra Neamnt
                                               in Italy
                                                                               Turda                   Vaslui
                                         65% of totalvalue
                                                                                                                        94.3% financial occupancy
                                 6
                                                                                                       Galati

25 hypermarkets in Italy
  25% oftotalvalue                                                               Valcea      Ploiesti          Tulcea   EPRA NAV and EPRA NRV
                                                                                                   BuzauBraila
                                                                                   Slatina
                                                                                                                        €10.38/share
                                                                                       Alexandria
  # n° of properties                                                                                                    FFO/share
      Northern Italy (58%)
      Central Italy (30%)                                                                                               €0.54
      South Italy (12%)

                          60 Properties in 12 Regions                          15 Properties in 13 Cities
                            (c. 94% of total value)                            (c. 6% of total value)                   49.9% LTV (excl IFRS16 c.47.8%)
                           (94.3% of Rental Income)                            (5.7% of Rental Income)

                          Data as at 31/12/2020 unless differently indicated
                          *Margin from freehold properties
                                                                                                                                                     5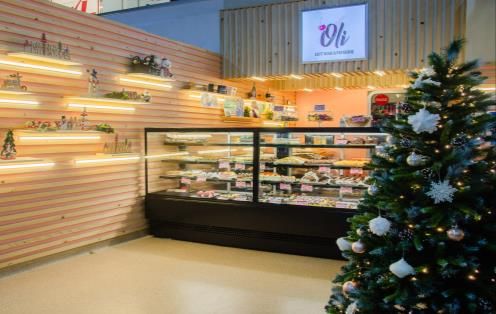
IGD Business Model
Explained
 A distinctive competitive positioning in the fragmented Italian retail real estate market

1       Well Diversified Across Italy
                        39.2k                      GDP Per-capita
                                                                     2     Strategic Positioning
                                                                                                                 3   Strong Food Anchor (COOP)
                                                                                                                                                                4    Strong Track-Record of
                                                                                                                                                                     Direct Management

                                                   €34.6k – €42.6k
                           1    30.9k
35.2k
                38.0k                              €30.0k – €34.5k
                                                   €20.6k – €29.9k
                                                                                                                                                                             Services
                    3          5 33.1k
        2                                          €16.8k – €20.5k
   30.3k 1
                        22 35.3k                          €28,500
            31.6k                                  Italian average                                                                                                           Personal and
                                                                                      Ravenna
                        30.4k       7
                                 26.8k
                                                        €29,200                                                                                                              Healthcare
                           6 24.5k                    EU average
            #              7         2
 n° of properties
                                   5 24.7k
                                           19.8k
                                                                                     4 km                                                                                    Local and
                            32.7k                     18.4k
                                             2
                                                                                                                                       Hypermarket                           international
            20.6k
                                         18.2k      21.1k            Centro Commerciale                                                                                      brands
                                                                              ESP
                                                     17.2k

                                         17.5k
                                                                                                                                                                             Sharing economy
                                            4

                                                                                                                                                                  Proactive Approach, Carefully Selected
                                                                        We strive to Be the Dominant Retail          The Food Hypermarket Plays a Critical
            With Strategic Focus on High GDP per                                                                                                                  Merchandising Mix, Marketing Activity
                                                                      Destination in Mid-Sized Wealthy Italian     Attraction Role in Our Retail Assets Fresh   Adapted to Each Context and Wide Offer of
                capita Northern Mid-Size Cities                        Cities, at Easy Reach from City Centre    food, Daily Shopping, Sticky Consumer Habits          Customer Related Services

                                                                                 2 Average Gla: about 25,000 sqm
                                                                           M                                                                     Easily reachable: about 4 k m from city center
                          Modern portfolio                                           Catchment area: about 370,000                               Average parking places: 2,013
                          Average age 10 years                                       inhabitants within 2 0 minutes
                          (from opening/restyling)                                                                                               Centers reached by public transport: 24 (89%)
                                                                                     Average footfalls per center/year: 3.3
                                                                                     million*                                                    Centers reached by cycle path: 16 (59%)

                            * Data at 31 Deceber 2019
                                                                                                                                                                                                            6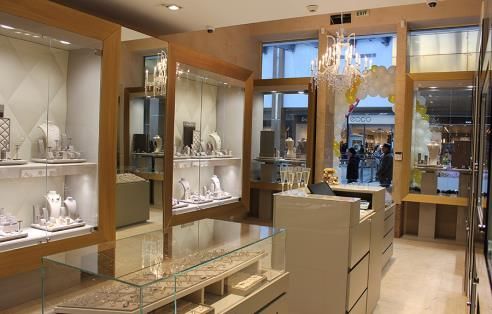
Our shareholding structure

Listed on the Italian Stock Exchange in the
STAR segment (“high requirements”)                                               Freefloat equal to 45.02%, majority of institutional investors, of which*
                                                                                                                                Italy
          Number of shares: 110,341,903
                                                                         EUROPA PLUS (GWM)
                                                                                                                        30%     Mediolanum, Banca d’Italia
                                                                              4,20%
                                                                                                                                UK & Ireland
                                                                                                                        1%
                                                               Unicoop Tirreno
                                                                   9,86%                                                        Legal & general Group,
          Share Capital: about €650 m                                                                                           Interactive Group
                                                                                                                                US & Canada
                                                                                                        majority of     42%     Vanguard, Blackrock
          Net Equity: about €1.1Bn                                                                      institutional
          (31/12/2020 )                                                                                                         Luxembourg Netherlands Belgium
                                                                                                        investors
                                                     Coop Alleanza 3.0                                                  2%      Banque de Groof,
                                                         40,92%                                                                 Banque et Caisse d’Epairgne
          Average 2020 Market Capitalization:
          about €424mn                                                                                                          France
                                                                                                  Free float
                                                                                                                        5%      Societe Genrale BNP Paribars
                                                                                                   45,02%
          Average 2020 daily trading:                                                                                           Rest of the World
          about 261,262 shares                                                                                          20%     Codan Forsikring, Japan TRSV

Governance – Best-in-Class Board Composition
                                                                                                                                Elio Gasperoni (1953)
                                                                                                                                Chairman

                                                                                                                                • Chairman of IGD's Board since April 2017
                                                                                                                                • Board member of IGD since 2015

              11                                                                       63.6% Male (7)                           Claudio Albertini (1958)
                                        63.6% Independent (7)
       Members of Board                                                               36.4% Female (4 )                         Chief Executive Officer
                                        36.4% Non Independent
         of Directors
                                                 (4 )                                                                           • Appointed in May 2009
                                                                                                                                • Board member at IGD since 2006
             3 committees entirely composed by independent directors

               *Internal processing by IGD
                                                                                                                                                                        7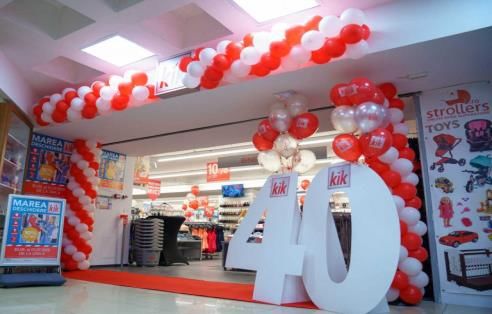
Coop world and our main
Shareholders

          7 Legal entities throughout Italy                                Coop world key data*:
             17 Regions covered by Coop
                                                                           Turnover ~ EUR 14.7 bil € (12.9 % of italian large scale retail)
                                                                           No. of stores: ~1,200

                                                                           Employees ~52,000

                                                                           Members ~ 6.7 Mn people

                                                                                               Coop Alleanza 3.0**      Unicoop Tirreno**

                                                                             Revenues                ~4.0 Bil EUR      ~890 Mn EUR
                                                                             N° of stori es               ~378                ~100
                                                                             Employee s                   ~21,900             3,410
                                                                             Members                      ~2.3 Mn        ~607,000
                                                                          Deposits
                                                                          from mem      Bers
                                                                                                      ~3.2 Bil EUR     ~602 Mn EUR

                                                                          Strategic investments in listed companies:

                                                                                (Insurance and banking)

     * data as at 31/12/2018 **data as at 31/12/2019
     • Sources: Coop Alleanza 3.0 and Unicoop Tirreno financial reports, www.e-coop.it and Rapporto COOP 2019,
                                                                                                                                              8
       Source: Nielsen, survey GNLC 2020;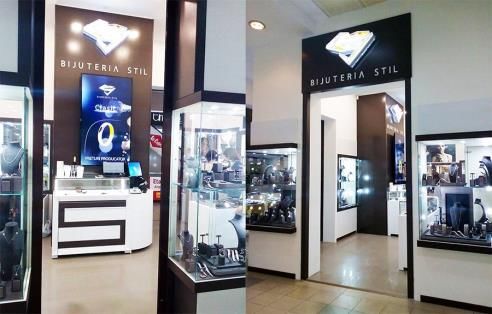
Our Top Management

Elio Gasperoni (1953) Chairman                                                              Claudio Albertini (1958) Chief Executive Officer

             • Chairman of IGD's Board since April 2017                                                   • Appointed in May 2009
             • Board member of IGD since 2015                                                             • Board member at IGD since 2006
             • He has held numerous roles in Public Adminstrations and Local                              • More than 20 years of experience wt h Unipol Group, wehere he
               institutions                                                                                 ultimately acts as General Manager of Unipol Merchant
                                                                                                          • Certified financial auditor registered in Bologna

Daniele Cabuli (1958) Chief Operating Officer                                               Roberto Zoia (1961) Director of Asset Management, development & network mgt
             • More than 20 years of experience in retail distribution                                    • Director of Asset Management and Development since 2006
             • Joined IGD in 2008 as Network Management Director and COO since                            • Joined GS Carrefour Italia Group in 1999 as Head of Hypermarket and
               2009                                                                                         Shopping centre Development
             • Worked for Coop Adriatica since 1986 with several roles: Head of Projects                  • Head of Asset Management and Development for Carrefour Italia from
               in the Marketing Division (1989), Head of different geographical areas and                   2005
               Hypermarket Manager (until 2003), Director of Marketing and                                • Previously, Business Manager at Coopsette (since 1986)
               Commercial Development (from 2003)

Andrea Bonvicini (1963) Director of Finance Division                                        Raffaele Nardi (1976) Director of Planning, Control and Investor Relations

             • Head of the IGD Group's Finance Division since September 2009                              • Head of the division t o wich 3 different departments report:
             • In July 2012 he was appointed Director of Finance and Treasury                               planning, control and investor relations
               Department                                                                                 • Joined IGD in October 2010
             • More than 20 years of professional experence in the world of credit,                       • Head of the Advisory Service of UGF Merchant, bank of the Unipol
              first in Cooperbanca and, subsequent t o 1997, in the Bank of Bologna                         Financial Group, where he matured more than ten years of experience
                                                                                                          • Graduated in Business Economics

Carlo Barban (1978) Director of Administration, Legal & Corporate Affairs
             • Director of Administration, Legal & Corporate Affairs since Jan 2019
             • CEO of Winmarkt group in the period Ap r 2014 – Dec 2018. Worked in
               Winmarkt as Operating & Reporting Manager since January 2009 with
               responsibilities also for administration, planning and control and finance
             • Previously working as a qualified accountant and for international
               consultancy companies
             • Graduated in Economics and Commerce

                                                                                                                                                                              9
Titolo
titolo

                2   Operating performances
                    in 2020

         note

                                             37
Covid-19 emergency in Italy
Jan-20 Feb-20 Mar-20 Apr-20 May-20 Jun-20 Jul-20 Aug-20 Sep-20 Oct-20 Nov-20 Dec-20
POSITIVE NATIONAL EASING NEW RESTRICTIONS
START OF LOCKDOWN OF THE Closure of cinemas, gyms, bars and
THE YEAR RESTRICIONS restaurants + Regions variable
coloring system based on changes in
infection rates
IMPACTS ON IGD’S SC: IMPACTS ON IGD’S SC:
66 days of restrictions 21 days of restrictions
(weekends, holidays)*
IGD’S shopping centers always open
but with «non-essential» stores closed for 87 days throughout 2020
* The 21 days of closure of non-essential activities on weekends and on holidays weight for approx. 40% of November and December tenant sales.
11IGD’s response to Covid-19
IGD immediately implemented precautions and measures
to ensure the safety of the shopping centre visitors
TEMPERATURE MONITORING
OBSERVE SOCIAL DISTANCING SANITIZING GEL DISPENSERS
AVAILABLE TO VISITORS
AIR RECICLYING
MASK REQUIRED
FROM OUTSIDE
SANITATION OF STAGGERED ENTRIES
COMMON AREAS
12Negative trends due to restrictions…
Positive Lockdown Positive quick answer when the New restrictions
start restrictions were eased
10%
0%
-10%
-20%
-30%
-40%
-50%
-60% ON AVERAGE YEAR 2020vs 2019 (Italy):
-70% Mall tenants sales -27.6% (CNCC -29.9%)*
-80% Hypermarket sales -2.8%
Footfalls -29.5% (CNCC -34.2%)*
-90%
-100%
Jan-20 Feb-20 Mar-20 Apr-20 May-20 Jun-20 Jul-20 Aug-20 Sep-20 Oct-20 Nov-20 Dec-20
*CNCC: National Council of Shopping Centers (Consiglio Nazionale dei Centri Commerciali)
* 13…but no rushed conclusions
Evidence emerged after restrictions were eased*…
Fewer but more targeted visits… Approx. 87% of footfalls recovered
…with an increase in average
ticket …
€ 26.0, +17% (+€3.8)
…resulting in a slight increase in
Tenant sales +0.3%
overall purchases
Quick answer from visitors; shopping centers still attractive
despite limitations on organized events and leisure activities
*figures refer to the period of August, September and October 2020 for Italian malls
14Performances considerably diversified
depending on the merchandise category
MERCHANDISE CATEGORIES WITH
MERCHANDISE CATEGORIES
BETTER PERFORMANCES THAN
MORE PENALIZED BY RESTRICTIONS
IGD’S PORTFOLIO AVERAGE*
✓ Household goods ✓ Restaurants
✓ Consumer electronics ✓ Entertainment
✓ Personal and health care ✓ Clothing
✓ Culture, leisure, gift items ✓ Footwear
✓ Sports equipments ✓ Services
*Comparison with IGD’s mall operating performances
15Maintained a controlled
risk profile
73.4% 26.3%
MALLS of rental
income HYPER of rental
income
LEASING
ITALY
MANAGEMENT • Always open
FINANCIAL
CONTRACTS: OCCUPANCY* • The shopping centres’ civil role
• No changes on existing
Renewals 55 turnover 46
(downside -0.38%)
94.3% contracts became even stronger in their
catchment areas
• Deferred payments and
temporary reductions • Small size on average with
ROMANIA granted sales area2020 Rent collection rate*
Italian Porfolio Romanian Porfolio
Collected>91% Collected>94%
To be collected in To be collected in
2021Leasing and commercial activities
did not stop
The evolution in consumption styles, accelerated by Covid, has led us to innovate by means of
digital communication and the introduction of new brands and services in the malls
NEW MERCHANDISE CATEGORIES DIGITAL COMMUNICATION AND
INTRODUCED TENANT INITIATIVES
30 led walls for digital
communication
installed in the malls
Apps and touch
screens made available
by tenants to order
Introduction of pharmacies and diagnostic safely
clinics
In Italy, project for diagnostic clinics developed
Home Delivery
in partnership with a primary insurance group
organized by tenants
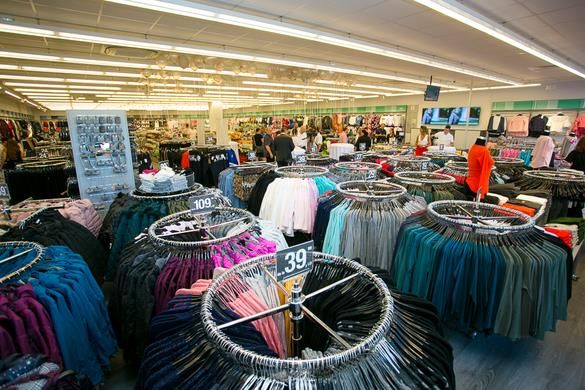
18Retailers continued to open
in Italy…
Frwrd - Le Porte di Napoli (NA) Chicco - La Torre (PA) – Tiburtino (RM) Wycon cosmetics - Katanè (CT) JD Store - Centro Nova (BO)
Pepco - Centro Borgo (BO) Mondo Convenienza - ESP (RA) Little Italy Barber Shop - Centro Kasanova - Centro d’Abruzzo (CH)
Leonardo (BO)
19…and in Romania
KIK (clothing) - Cluj KIK (clothing) - Slatina Bijuteria Stil (jewellery) - Braila
Bijuteria Stil (jewellery) - Tulcea Cofetaria Oli (restaurant) - Ploiesti Big Mageda Crafts (gift items) - Ploiesti GC
20True omnichannel passes
through the shopping center
IGD’s path toward
omnichannel
Definition of the first Digital Definition of a dialogue
Marketing Plan and between tenants and
implementation of a Customer customers which can benefit
Relationship Management of personalized offering
Installation of Amazon (22) and Structured use of shopping center (CRM) system inside our based on their consumption
Poste Italiane (2) lockers social media (FB and IG) shopping centers preferences
Develop a system to
Create/maintain a Increase customer
Connect online and collect contacts,
high level of shopping loyalty and
Targets offline shopping profile and dialogue
centers visitors’ personalization of the
experience with tenants and
engagement offering
visitors
2019 2020 2021 Next years
213 Portfolio and projects
IGD: a portfolio of high
quality assets

                                                          Centro Sarca
                                North                   Sesto S.Giovanni
                                                                                Esp           Le Maioliche        Centro Borgo       Centro Lame           Puntadiferro
                                                              (MI)            Ravenna         Faenza (RA)           Bologna           Bologna                 Forlì

        IGD - Main                                      Centro Leonardo         Conè          Centro Piave
                                                                                              San Donà di
                                                                                                                     Clodì            Centro Nova
                                                                                                                                     Villanova di
                                                                                                                                                           Mondovicino
                                                                                                                                                             Sc&Rp
                                                          Imola (BO)       Conegliano (TV)                       Chioggia (VE)
        Italian Asset                                                                         Piave (VE)                            Castenaso (BO)        Mondovì (CN)

                                        Nuova Darsena      Millennium        La Favorita       Gran Rondò         Lungo Savio       Centro Luna              I Bricchi
                                                            Gallery
                                           Ferrara       Rovereto (TN)        Mantova          Crema (CR)           Cesena           La Spezia          Isola d'Asti (AT)

                      Piazza Mazzini       Tiburtino       Maremà           Centro Porto     Cttà delle Stelle   FontiFonti
                                                                                                                      del Corallo      Casilino               Centro
                                                            Maremà                                                          del
Center                   Livorno        Guidonia (RM)      Grosseto
                                                                               Grande
                                                                                              Ascoli Piceno         Livorno
                                                                                                                       Corallo
                                                                                                                                       Caslino
                                                                                                                                       Roma
                                                                                                                                                            d'Abruzzo
                                                                                                                                                         Centro d’Abruzzo
                                                           Grosseto         Porto d'Ascoli                                             Roma                  Pescara
                                                                                                                                                             Pescara
                                                                                                                      Livorno

                                                                             >75% of the market value
                        Le Porte
                                          La Torre         Katané               of Italian Malls and             Future                        Offcine Storche
                                                                                                                                              Officine Storiche
South                   di Napoli                                                                                                                   Livorno
                     Afragola (NA)        Palermo          Catania           Hypermarkets dominant⁽1⁾            Opening                          Livorno
                                                                              in respective catchment
                                                                                        areas

                                                                                                                                                                   23
                1. Dominant assets: assets that are reference points for the consumers in their catchment area in terms
                of attractivity and offer quality
                   Key assets malls with> € 7 0 m n mkt value
The main characteristics of our portfolio
2,265.7 € mn
42% of this portfolio consists of 8 “Key” assets
of which 6 are Shopping centres (mall + hypermarket)
On average every shopping centre is 10 years old
Romania (last restyling/opening)
6% North western Italy
15%
Southern Italy
12%
Full ownership of 16 Shopping centres (mall+hyper) in Italy
(60.8% of Italy core market value)
Central Italy
25%
North eastern
Italy
42% 18 out of 25 Hyper/Super in Italy are small
(sales areaIGD’s portfolio market value
(1/2)
Gross Initial EPRA Net Initial EPRA Net Initial
FY 2019 * FY 2020 Δ%
Yield Yield Yield topped up
Malls Italy 1,574.54 1,473.30 (-6.43%) 6.53%
5.3% 5.4%
Hypermarkets Italy 564.58 558.97 (-0.99%) 6.02%
Romania 150.29 138.64 (-7.75%) 7.35% 6.0% 6.2%
Porta a Mare + development + other 91.99 94.78
Total IGD's portfolio 2,381.41 2,265.69 (-4.86%)
Leasehold properties (IFRS16) 54.80 43.32
Total IGD's portfolio including leashold 2,436.21 2,309.01 (-5.22%)
25
*Values at 31/12/2019 of Malls Italy and Hypermarkets Italy have been reclassified because of the Casilino realized in 2H 2020.IGD’s portfolio market value
(2/2)
ITALY ROMANIA
€ 2,381.4mn 7.5
7.5
Other 3.9%
(91.99 €mn)
Romania 6.3% -115.3
(150.29 €mn) -115.3 € 2,265.7mn
10.3 -6.5 0.5 -12.2
10.3
Other 4.2%
-6.5 0.5 -12.2 (94.78 €mn)
Romania 6.1%
(138.64 €mn)
FV change is due to DCF
2,381.4 assumptions (rates) for
Malls 66.1%
2,381.4
(1,574.54 €mn) approx. 29% and to change in
cash flows including COVID
2,265.7
Malls 65.0%
impacts for approx. 71* (1,473.30 €mn)
2,265.7
Asset
Hypervalue at
23.7% Projects and capex Change in market Projects and capex Change in market Projects and capex Change in market AssetHyper
value at
31/12/2019
(564.58 €mn) Italy value Italy Porta Medicea value Porta Medicea Romania value Romania 31/12/2020
24.7%
(558.97 €mn)
Asset value at Projects and capex Change in market Projects and capex Change in market Projects and capex Change in market AssetFY2020
value at
FY2019
31/12/2019 Italy value Italy Porta Medicea value Porta Medicea Romania value Romania 31/12/2020
*Estimate calculated excluding Casilino Shopping Center that was remodeled
26EPRA Metrics
€ per share FY 2020 FY 2019 Δ%
NRV and NAV 10.38 11.40 -8.9%
NTA 10.31 11.29 -8.7%
NDV 10.42 10.81 -3.6%
-0.23 0.54
-1.32
0.00
11.40
10.38
EPRA NRV/NAV 31 Resolved dividend FFO Change in asset fair Change in financial EPRA NRV/NAV 31
Dec 2019 value instruments fair Dec 2020
value and other
27Strong repositioning
of the Romanian Portfolio
1 5 9 13
2 6 10 14
1 7
2 Bistrita Piatra Neamt 8
Cluj-Napoca Vaslui
7 11
3 9
3
Turda Galati
14 Key Strategical points
4 10 1
13 12
Ramnicu Valcea 1
Buzau Braila Tulcea • Further capex
Ploiesti for safety, maintenance
5
4 8 12
and commercial
Slatina Bucuresti - Hq improvements
6 • Growth trend of rents
Alexandria
• Attention on operational
costs
• Focus on sustainability
2008 2009 2010 2011 2012 2013 2014 2015 2016 2017 2018 2019-2021
Acquisition
Surfaces recovery/Tenant Repositioning and complete external/internal refurbishement
Consolidation
New Plan
c.€22mn of investments (2008- c.€70.+5mn of dividends generated since
Self-financing of the 2020) for the upgrade and
No financial leverage
investments carried the acquisition⁽1⁾
repositioning of the portfolio
out
Romanian portfolio considerably repositioned, currently generating important free-cash flow
1. Until December 2020 28Flexible and sustainable
asset management
2020 2021/2022
✓ In order to strenghten the Group’s financial ✓ Priorities: non defferable activities,
solidity some projecys and capex were extraordinary maintenance, update of
postponed as early March 2020. systems as well as fit out adaptations in order to
continuosly attract tenants and visitors.
✓ Lower cash-out for approx. €40mn ✓ Our asset type enables us to be flexible in
compared to what expected for the year offering spaces for different uses like flagships
for physical and/or online sales, logistics
hubs…
2020 Total Investments €18.3mn No major transformations/reconversions
are necessary, just few adjustmens in the
merchandising mix
292021-2022 Projects
CASILINO PORTO GRANDE LA FAVORITA PORTA A MARE
(Officine Storiche –
retail/residential)
Asset
Restyling and
Restyling Restyling Creation of more
Description hypermarket/mall
than 15,000 m²
remodeling
devoted to retail +
42 seafront flats
End of work H1 2022 End of 2022 End of 2022 H1 2022
The projects slowdown will be used for fine tuning
on merchandising and tenant mix
304 FY2020 Financial Results
FY 2019 and FY2020
main results

                                                          2019     vs 2018             2020      vs 2019
 REVENUES
  Rental Income                                         €155.3 mn +2.3%             €145.6mn      -6.2%
  Net Rental Income                                     €136.6mn +10.1%             €109.5 mn    -19.8%

 EBITDA
  EBITDA (Core Business )                               €125.2 mn +10.1%             €99.4 mn    -20.6%
  EBITDA Margin (Core Business)                           77.5% +560pts               65.4%      -121pts
  EBITDA Margin From Freehold                             79.7%    -60pts             65.3%

 GROUP NET PROFIT                                       €12.6 mn   -72.9%            €-74.3 mn     n.a.

 Core Business Funds From Operations (FFO)              €83.3 mn    +4.5%            €59.3 mn    -28.8%
 Core Business FFO per share *                            0.75                         0.54

The results of 2020 were impacted by the exceptional containment measures adopted in Italy to limit the spread of
Covid-19

         1. Calculated on the year-end no. of share                                                            3
                                                                                                               322
Net Rental Income
(€mn)
-€8.6mn Italy -€27.1mn
-6.3% -19.9% -19.8%
Romania
-19.3%
-5.3 -3.3
-18.5 *
136.6 128.0
109.5
Net rental income 2019 Change in rental income Change in rental costs Net rental income 2020 adj COVID net direct impacts Net rental income 2020
Malls Italy -€4.0mn: Increase in direct costs
Due to lower variable revenues and mainly due to greater provisions
fewer temporary rents in addition to for trade receivables and
higher vacancy due to delayed or condominium fees
missed openings
Not like-for-like Italy -€0.8mn
Romania -€0.5mn
*Covid-19 net direct impacts include Covid temporary reductions already granted for €4.4mn and Covid effects included in direct costs for €14.1mn.
Some figures may not add up due to rounding. 33Core business Ebitda
(€mn)
-€7.3mn -€25mn
-5.8% -20.6%
-8.6 1.1
0.2
-18.5*
125.2 117.9
99.4
Ebitda 2019 Net Rental Income Net Service Income Change in G&A expenses Ebitda 2020 adj COVID net direct impact Ebitda 2020
Decrease in G&A expenses
(-8.8%)
EBITDA MARGIN
Thanks to the Group’s cost cutting
Core business
65.4%
activities
EBITDA MARGIN 65.3%
freehold
*Covid-19 net direct impacts include Covid temporary reductions already granted for €4.4mn and Covid effects included in direct costs for €14.1mn.
Some figures may not add up due to rounding
34Financial management
(€mn)
Figure, net of accounting items and negative carry, is further decreasing
(-4.7% vs FY2019)
Total Total
€ 36.8mn € 36.2mn
-4.7% 3.8 Negative carry
5.45.4 3.8
€400mn bond issue + SACE
2.8
2.8
IFRS16 and non-recurring charges
31.0 29.6
31.0 29.6 Finacial Mgt. Adj:
-€1.4mn vs 2019 (-4.7%)
FY 2019 FY 2020
FY 2019 FY 2020
Financial management Adj. IFRS16 and non-recurring charges Negative Carry
Financial management Adj. IFRS16 and non-recurring charges Negative Carry
Some figures may not add up due to rounding
35Funds From Operations
(FFO)
-€5.5mn -€24.0mn
-6.6% -28.8%
-7.3 0.2
1.4
FFO p.s.
-18.5 0.54€
83.3
77.8
59.3
FFO_2019 Change in core Change in financial Change in taxes and FFO_2020 adj COVID net direct FFO_2020
business Ebitda adj* management adj other impacts
The result is substantially in line with the guidance provided (-25%/-28%)
*Change in core business Ebitda Adj: equal to change in core business Ebitda adjusted by approx. €0.7mn of non recurring expenses.
Perdue
Some figures may not add up il calcolo dell’FFO sono state considerate le locazioni passive e rettificato il dato della gestione finanziaria
to rounding.
36Financial activities
during the year
Committed €36.3mn loan Ratings: Early repayment
credit lines granted by Banca of the Notes
renewed by 2 Monte dei Paschi di Fitch »300,000,000 2.500
leading credit Siena guaranteed BBB- negative per cent. Notes due
institutions (€40mn by SACE Spa (6 31 May 2021»
+ €20mn) and years, cost Standard&Poor’s
maturity including BB+ negative Outstanding €70.7mn
extended to government Repayment date 1/3/21
2023 guarantee in line NO bond step up
with the Group’s clause has been
average cost of triggered
debt )
37Financial structure
Debt breakdwon* Net debt
€1,155.5 mn**
MARKET SECURED
56.5% 25.0%
BANKING
SYSTEM
43.5%
L.T.
1,272.80
UNSECURED
75.0%
CASH
-117.34
31/12/2019 31/12/2020
LTV 47.6% 49.9% • Net Debt remained nearly
(adj. IFRS16 c. 46.4%) (adj. IFRS16 c. 47.8%)
stable during the year
(€1,162mn in 2019)
ICR 3.8x 3.2x
• Increasing LTV due to fair
Average cost value decrease
2.35% 2.30%
of debt
*Debt calculated excluding the IFRS16 effect
**Net debt including IFRS16 effect (if excluded €1,106.4mn) 38Debt maturity
€100mn: 2.25% 7y
€400mn: 2,.25% 5y
2.1%
5y*
2.65% 500
7y 209
2.5%
5y
154
71 9
2 9
67 7
52 53 46
25 27 6
2021 2022 2023 2024 2025 2026 >2026
Secured bank debt Unsecured bank debt Bonds
Taking into account the cash-on-hands equal to €117mn and the committed and uncomitted credit
lines, the Group has already enough resources to cover the financial maturities of 2021 and first
months of 2022
*rate and duration refers to €200mn loan
39Disposals to rebalance the
financial structure
✓ Consistent with 2019-2021 Strategic Plan, the procedure for the disposal of
a portfolio of stand-alone hypermarkets/supermarkets was started
✓ Mandate granted to CBRE, a premiere international advisor
✓ Value approx. €185mn
Asset class with a Attractive Stable cash-flow
good appeal on Net Initial yield with long-term
the market leases
The proceeds from the transaction will be used to reduce the
Loan-To-Value and strenghten the financial structure
405 Dividend and Outlook
Dividend

                  2020                                     Next few years
✓ Loss of the Parent company IGD SIIQ SPA        ✓ As soos as external conditions allow, IGD
✓ Safeguard of the financial stability and the     intends to resume paying dividends and
  investment grade profile                         providing its shareholders with attractive
                                                   remuneration

           NO DIVIDEND                                   IGD share remains
           DISTRIBUTION                                  a «dividend play»

           Decision triggered by
         exceptional circumstances

                                                                                          42
Outlook
The first few months of 2021 will undoubtely still be difficult for shopping center
operations due to the restrictions that are still in place, and it is therefore plausible that the
Company will again be impacted directly and indirectly by the pandemic
Basic assumptions
• Effective implementation of the NEW OUTLOOK
vaccination plan FFO
• Strengthening of the economic FY2021
recovery starting from 2° half 2021
(without further significant
restrictions)
+3/4%
• Not taking into account the disposal
vs FY2020
impact
436 Sustainability
Sustainability: committment continues
  despite the pandemic
  Most short-term goals achieved, work in progress on the medium/long-term targets.

 GREEN                    RESPONSIBLE                         ETHICAL                   ATTRACTIVE                       TOGETHER
• €1.2mn invested in     • Stable level of                 • UNIISO37001 «Anti         • Digital Plan defined and    • Dialogue with the
  energy efficiency        employment and                    bribery management          existing shopping centers     stakeholders
  measures                 Corporate Welfare Plan            system» certification       web instruments               strengthened for a more
• 19 EV charging           confirmed                         obtained in Italy           (websites and social          unitary emergency
  stations installed     • Training activity for all the   • Second renewal of three     networks) updated to          management: for ex.
• ISO14001                 employees and a new               stars Legality Rating       increase contacts with        Post lockdown surveys
  certification for 4      activity of «Virtual Team»        obtained (maximum score     visitors                      had been carried out to
  more shopping            tested                            awarded)                  • Communication Campaign        better understand the
  centers and Breeam     • Implemented measures            • Code of Conduct and         realized to reassure          visitors’ needs
  in Use certification     for the safety of                 Organizational              visitors about the safety
  for 3 more shopping      employees and visitors            Management and Control      and the offering of the
  centers                  both in the headquarters          Model updated               shopping centers post
                           and in the shopping             • Adhesion to United          lockdown
                           centers                           Nations Global Compact

                                                                                                                                       45
Titolo
titolo
7 Appendix
note
65Consolidated Income
Statement
GROUP CONSOLIDATED (a) (b) Δ
FY_CONS_2019 FY_CONS_2020 (b)/(a)
Revenues from freehold rental activities 142.7 133.8 -6.3%
Revenues from leasehold rental activities 12.6 11.9 -5.6%
Total income from rental activities 155.3 145.6 -6.2%
Rents and payable leases 0.0 0.0 -27.1%
Direct costs from rental activities -18.7 -36.1 93.3%
Net rental income 136.6 109.5 -19.8%
Revenues from services 6.4 6.3 -0.8%
Direct costs from services -5.5 -5.2 -5.0%
Net services income 0.9 1.1 25.4%
HQ Personnel expenses -6.8 -6.3 -7.8%
G&A Expenses -5.5 -4.9 -10.0%
CORE BUSINESS EBITDA (Operating income) 125.2 99.4 -20.6%
Core business Ebitda Margin 77.5% 65.4%
Revenues from trading 0.4 0.7 74.4%
Cost of sale and other costs from trading -1.0 -1.4 38.1%
Operating result from trading -0.6 -0.7 15.1%
EBITDA 124.6 98.7 -20.8%
Ebitda Margin 76.9% 64.7%
Impairment and Fair Value adjustments -72.8 -146.0 n.a.
Depreciation and provisions -1.4 -5.0 n.a.
EBIT 50.3 -52.3 n.a.
FINANCIAL MANAGEMENT -36.8 -36.2 -1.5%
ENTRAORDINARY MANAGEMENT 0.0 -0.1 n.a.
PRE-TAX RESULT 13.6 -88.6 n.a.
Taxes -1.0 14.2 n.a.
NET RESULT OF THE PERIOD 12.6 -74.3 n.a.
(Profit/Loss) for the period related to third parties 0.0 0.0 n.a.
GROUP NET RESULT 12.6 -74.3 n.a.
Some figures may not add up due to rounding
47Reclassified balance
sheet
Sources - Uses of funds (€/000) 31/12/2020 31/12/2019 Δ Δ%
Fixed assets 2,234,484 2,365,214 130,730 5.9%
Assets under construction 42,673 40,827 -1,846 -4.3%
Other non-current assets 17,374 21,845 4,472 25.7%
Other non-current liabilities -29,130 -28,998 132 -0.5%
NWC 29,181 18,441 -10,740 -36.8%
Net deferred tax (assets)/liabilities -10,286 -26,313 -16,027 155.8%
TOTAL USE OF FUNDS 2,284,296 2,391,018 106,721 4.7%
Net equity 1,114,441 1,211,014 96,572 8.7%
Net (assets)/liabilities for derivative instruments 14,396 17,365 2,969 20.6%
Net debt 1,155,458 1,162,638 7,181 0.6%
TOTAL SOURCES 2,284,296 2,391,018 106,722 4.7%
0,95 1,03
GEARING RATIO (€000)
0.95 1.03
1,225,020 1,125,417
1,225,020 1,125,417
1,162,638 1,155,458
1,162,638 1,155,458
2019 2020
Net debt Net equity adj
2019 2020
Net debt Net equity adj
48Funds From Operations
(FFO)
Funds from Operations CONS_2019 CONS_2020 Δ 2019 Δ%
*
Core business Ebitda 125.194 99.446 -25.7 -20.6%
IFRS16 Adjustment (Payable leases) -10.302 -10.31 0.0 0.1%
Financial management adj -31.384 -33.405 -2.0 6.4%
Extraordinary management adj 0.000 0.000 0.0 n.a.
Current taxes for the period adj -1.148 -0.946 0.2 -17.6%
FFO 82.361 54.782 -27.6 -33.5%
Una tantum Marketing 0.575 0.659 0.1 14.6%
FFO 82.936 55.441 -27.5 -33.2%
Negative Carry 0.349 3.843 3.5 n.a.
FFO ADJ 83.284 59.284 -24.0 -28.8%
* Considera nelle locazioni passive la riduzione di una mensilità (in linea con le stime interne di riduzione delle locazioni derivanti 49
dagli impatti COVID)Other Epra metrics
EPRA Performance Measure 31/12/2020 31/12/2019
EPRA NRV/NAV (€'000) 1,145,827 1,258,008
EPRA NRV/NAV per share € 10.38 € 11.40
EPRA NTA 1,137,258 1,245,473
EPRA NTA per share € 10.31 € 11.29
EPRA NDV 1,149,534 1,192,894
EPRA NDV per share € 10.42 € 10.81
EPRA Net Initial Yield (NIY) 5.8% 5.9%
EPRA 'topped-up' NIY 5.9% 6.0%
EPRA Vacancy Rate Malls Italy 7.6% 4.5%
EPRA Vacancy Rate Hypermarkets Italy 0.0% 0.0%
EPRA Vacancy Rate Total Italy 5.7% 3.2%
EPRA Vacancy Rate Romania 6.5% 2.4%
EPRA Performance Measure 31/12/2020 31/12/2019
EPRA Cost Ratios (including direct vacancy costs) 17.9% 18.5%
EPRA Cost Ratios (excluding direct vacancy costs) 15.3% 16.1%
EPRA Earnings (€'000) € 62,941 € 87,335
EPRA Earnings per share € 0.57 € 0.79
50More financial highlights
31/12/2019 31/12/2020
Gearing ratio
0.95X 1.03X
Average lenght of long-term debt 4.1 years 3.2 years
Hedging on long term debt+ bond 94.8% 93.0%
Share of M/L debt
95.4% 98.3%
Uncommitted credit lines
granted €161 mn* €151 mn*
Uncommitted credit lines
available €161 mn €151 mn
Committed credit lines
granted and available
€60 mn €60 mn
Unencumbered assets €1,480.0 mn €1,434.9 mn
*Some banks allowed us to transform them in medium/long-term not granted credit lines.
51Italian Portfolio:
hypermarkets and shopping malls
27 shopping malls 25 hypermarkets Tenants of hypermarkets
Centro D'Abruzzo - Pescara Centro D'Abruzzo - Pescara Coop Alleanza 3.0
Clodì - Chioggia Clodì - Chioggia Coop Alleanza 3.0
Porto Grande - Porto d'Ascoli (AP) Porto Grande - Porto d'Ascoli (AP) Coop Alleanza 3.0
ESP - Ravenna ESP - Ravenna Coop Alleanza 3.0
Centro Borgo - Bologna Centro Borgo - Bologna Coop Alleanza 3.0
Conè Retail Park - Conegliano (TV) Conè Retail Park - Conegliano (TV) Coop Alleanza 3.0
Le Maoliche - Faenza Le Maoliche - Faenza Coop Alleanza 3.0
Full ownership
Lungo Savio - Cesena Lungo Savio - Cesena Coop Alleanza 3.0
16 shopping centres Città delle Stelle - Ascoli Piceno Città delle Stelle - Ascoli Piceno Coop Alleanza 3.0
(mall + hypermarket) Katanè - Catania Katanè - Catania Coop Alleanza 3.0
Centro Lame - Bologna Centro Lame - Bologna Coop Alleanza 3.0
Centro Leonardo - Imola (BO) Centro Leonardo - Imola (BO) Coop Alleanza 3.0
La Torre - Palermo La Torre - Palermo Coop Alleanza 3.0
Casilino - Roma Casilino - Roma Uncoop Tirreno
Le Porte d Napoli - Afragola(NA) Le Porte d Napoli - Afragola(NA) Distribuzione Centro Sud Srl (ipercoop)
Tiburtino - Guidonia (RM) Tiburtino - Guidonia (RM) Distribuzione Centro Sud Srl (ipercoop)
Millennium Gallery - Rovereto (TN)
Puntadiferro - Forlì (FC)
Centroluna - Sarzana (SP)
La Favorita - Mantova
Maremà - Grosseto
11 shopping malls Centro Sarca - Sesto S. Giovanni (MI) Hypermkts not owned by IGD
Mondovicino Retail Park - Mondovì (CN)
Gran Rondò (Crema)
Piazza Mazzini (Livorno)
I Bricchi - Isola d'Asti (AT)
Darsena City - Ferrara
Supermkt Civita Castellana (Viterbo) Unicoop Tirreno
Supermkt Cecina (Livorno) Unicoop Tirreno
Hypermkt Le Fonti del Corallo - Livorno Unicoop Tirreno
Hypermkt Schio-Schio (Vicenza) Hypermkt Coop Alleanza 3.0
9 hypermarkes Malls not owned by IGD LUGO - Lugo (RA) Coop Alleanza 3.0
Hypermkt IL MAESTRALE - Senigallia (AN) Coop Alleanza 3.0
Hypermkt MIRALFIORE - Pesaro Coop Alleanza 3.0
Supermkt AQUILEJA - Ravenna Arca SpA (Famila)
Hypermkt I MALATESTA - Rimini Coop Alleanza 3.0
52Contracts and key
tenants Italy
Malls
Product Turnover
TOP 10 Tenant Contracts
category impact N 237 N 202 N 208 N 768
clothing 3.0% 14
54.3%
16.8% 14.3% 14.7%
clothing 2.5% 9
2021 2022 2023 >2023
clothing 2.1% 10 Average residual maturity: 4.2 years
Top 10
Tenants
Gallerie electronics 2.1% 8 Total contracts: 1,415 of which 55 renewals with the same tenant
and 46 signed with a new tenant
Romania Downside -0.38%
personal care 1.8% 17
Rotation Rate 3.3% (% new tenant on tot. contracts)
clothing 1.8% 25
Hypermarkets
clothing 1.7% 28
N 24
N1
94.2%
shoes 1.6% 6
jewellery 1.4% 25
jewellery 1.3% 19 5.8%
2021 2022 2023 >2023
Total 19.3% 161 Average residual maturity: 14.1 years
Total contracts: 25
53Contracts and key
tenants Romania
Product Turnover
TOP 10 Tenant Contracts
category impact
Winmarkt
supermarket 11.1% 11
N 261 N 144 N 39 N 69
clothing 7.2% 6
clothing 5.2% 10 33.0% 34.0%
clothing 4.6% 11 23.0%
10.0%
drugstore 2.8% 5
jewellery 2.2% 5 2021 2022 2023 >2023
personal care 2.2% 4
offices 1.7% 1
Average residual maturity: 4.3 years
restaurants 1.3% 1 Total contracts: 547 of which 290 renewals with the same tenant
and 80 signed with a new tenant
Downside -0.47%
entertainment 1.2% 1
Rotation Rate 14.6% (% new tenants on tot. contracts)
Total 39.5% 55
54Merchandising &
Tenants Mix
Italy Romania
Culture, leisure, gift Supermarkets
Household Household goods
Restaurants items 11%
goods 5%
7% 3%
Culture, leisure, 9%
gift items Electronics Personal care Electronics
6% 11% 4% 2%
Personal care Services
4% 9%
Services
7% Merchandising Restaurants
Mix* 7%
Entertainment
4% Other Clothing
3% 42%
Clothing
Entertainment
52%
14%
International
Local brands brands
13%
Local brands 37%
International 43%
brands
40%
Tenant
Mix*
National
brands National brands
47% 21%
*elaborazione interna su montecanoni
55Governance
Directors and Committees
IGD’s governance has been in line with the criteria of the Self Regulatory Code of Italian Stock Exchange since it was listed. An internal
Corporate Governance Code has been in use since 2008
Chairman CEO
Executive
Elio Gasperoni Claudio Albertini
Vice Chairman
Rossella Saoncella Eric Jean Veron Luca Dondi Dall'Orologio
Granarolo Vailog - General Manager Nomisma - CEO
Former General Manager
Independent Timothy Santini
Former Eurocommercial
Head of Italian activities
Elisabetta Gualandri Livia Salvini
Università di Modena - Professor Lawyer
Università LUISS di Roma - Professor
Non Executive Non Gian Maria Menabò Alessia Savino
Coop Alleanza Unicoop Tirreno
Independent
Head of Asset Management and Development Head of Finance and Asset Management
Committees: Internal Control and Risk Management System
Nominations and compensation Committee Held by Chairman, including the
Control and Risks Committee International Audit and Risk Management
Committee for Related Parties Transactions
556
6Raffaele Nardi Director of Planning, Control and investor relations raffaele.nardi@gruppoigd.it Claudia Contarini, Investor Relator T. +39 051 509213 claudia.contarini@gruppoigd.it Elisa Zanicheli, IR Team T. +39. 051 509242 elisa.zanicheli@gruppoigd.it Federica Pivetti, IR Team T. +39. 051 509260 federica.pivetti@gruppoigd.it Follow us on
You can also read