Investor Presentation - Investor Relations | Gaming ...
←
→
Page content transcription
If your browser does not render page correctly, please read the page content below
Investor Presentation
      June 2020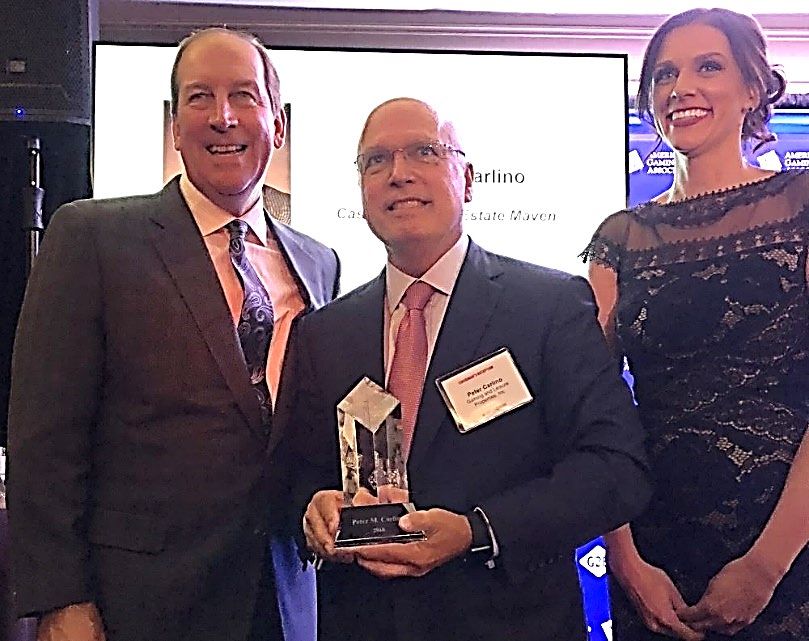
Company
                                           Forward      Overview
                                                   Looking Statements

Certain statements contained in this presentation may constitute “forward-looking statements” within the meaning of the safe harbor from civil
liability provided for such statements by the Private Securities Litigation Reform Act of 1995 (set forth in Section 27A of the Securities Act of 1933,
as amended (the “Securities Act”), and Section 21E of the Securities Exchange Act of 1934, as amended (the “Exchange Act”). Forward-looking
statements are subject to known and unknown risks, uncertainties and other factors that may cause the Company’s actual results, performance or
achievements to be materially different from any future results, performance or achievements expressed or implied by such forward-looking
statements. Forward-looking statements include information concerning the Company’s business strategy, plans, goals and objectives. Forward-
looking statements contained in this presentation include, but are not limited to, information and statements regarding the potential impact of the
novel coronavirus (COVID-19) pandemic on the Company’s financial results, the Company’s ability to grow its portfolio of gaming facilities,
information concerning the acquisition of certain real property assets from Penn National Gaming, Inc. (“Penn”) located in Las Vegas, Nevada and
Morgantown, Pennsylvania and the transactions related thereto (collectively, the “Transactions”), and the impact of the Transactions on the
Company’s business and results of operations, and the potential impact of environmental and community stewardship on shareholder value.
Statements preceded by, followed by or that otherwise include the words “believes,” “expects,” “anticipates,” “intends,” “projects,” “estimates,”
“plans,” “may increase,” “may fluctuate” and similar expressions or future or conditional verbs such as “will,” “should,” “would,” “may” and “could”
are generally forward-looking in nature and not historical facts. You should understand that the following important factors could affect future
results and could cause actual results to differ materially from those expressed in such forward-looking statements: (1) the availability of, and the
ability to identify, suitable and attractive acquisition and development opportunities and the ability to acquire and lease the respective properties on
favorable terms; (2) the degree and nature of the Company’s competition; (3) the Company’s increased reliance on Penn as its largest tenant; (4)
the ability to maintain the regulatory approvals required to own and/or operate the Company’s properties; (5) the effects of the Transactions on the
Company, including the impact of rent credits in lieu of cash to consummate the Transactions and the post-acquisition impact on the Company’s
financial condition, operating results, strategy and plans; (6) the Company’s ability to maintain its status as a real estate investment trust (“REIT”),
given the highly technical and complex Internal Revenue Code provisions for which only limited judicial and administrative authorities exist, where
even a technical or inadvertent violation could jeopardize REIT qualification and where requirements may depend in part on the actions of third
parties over which the Company has no control or only limited influence; and (7) additional factors discussed in the sections entitled “Risk Factors”
in the Company’s Annual Report on Form 10-K for the year ended December 31, 2018, and in the Company’s Quarterly Reports on Forms 10-Q,
which you should read in conjunction with this presentation.

Other unknown or unpredictable factors may also cause actual results to differ materially from those projected by the forward-looking statements.
Most of these factors are difficult to anticipate and are generally beyond the Company’s control. Given these uncertainties, you should not place
undue reliance on these forward-looking statements. You should consider the areas of risk described above in connection with considering any
forward-looking statements that may be made by the Company generally and any forward-looking statements that are contained in this
presentation specifically. The Company undertakes no obligation to release publicly any revisions to any forward-looking statements, to report
events or to report the occurrence of unanticipated events unless required to do so by law.

                                                                                                                                                1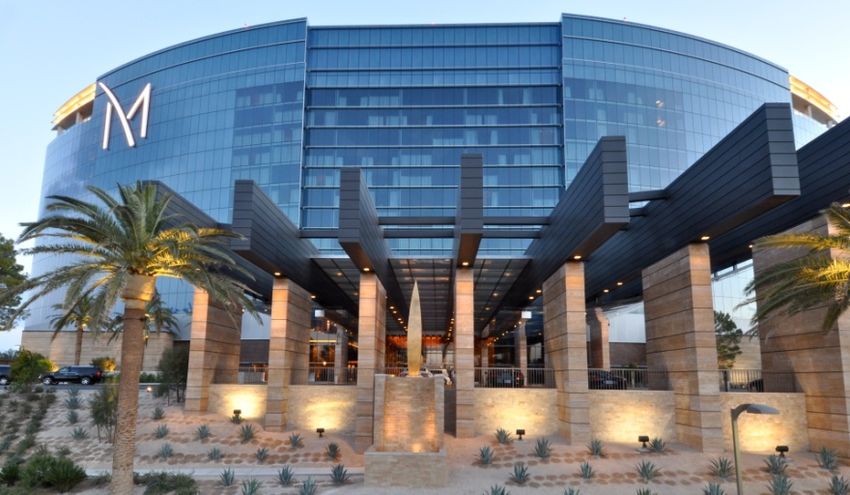
Investment  Highlights
   Company Highlights

         Cash Flow Durability & Stability
                        Portfolio Quality p.4
                    Portfolio Diversification p.5
                        Tenant Strength p.6
                   Master Lease Protections p.7-8
           Alignment of Interests from Gaming Taxes p.9
                Back-testing Cash Flow Stability p.10

               History of Transactions
              Successful transaction track record p.11

               Balance Sheet Strength
       Staggered debt maturity profile, strong liquidity, and
           demonstrated access to capital markets p.12

                         COVID-19
           Corporate Actions & Resulting Positioning p.13
Tropicana Transaction & Related Agreements with Penn National p.14

                      ESG Highlights
            Environmental & Social Responsibility p. 15
                   Corporate Governance p. 16

                                                                     2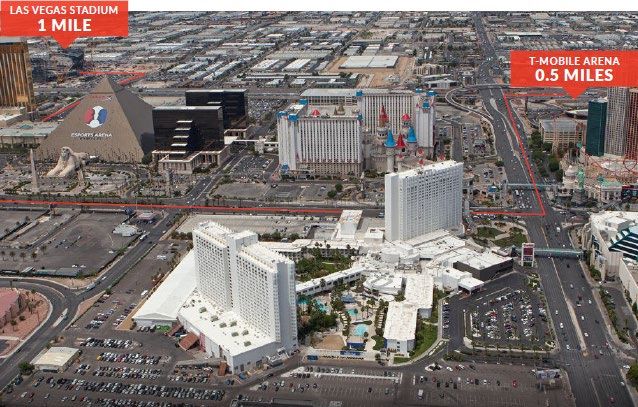
Gaming & Leisure Properties, Inc. Overview
(2)
(3)
Fast Facts
(2)
Snapshot
(1)
GLPI is the most diversified owner
46 16
of gaming assets in the country
Properties States Total Enterprise Value: $13.3 BIL
Dividend Yield 7.0%
95%+ of combined Real Estate
23.5M 5,638 13,307 Cash NOI/TRS EBITDA comes from
Property Sq. Acres Owned Hotel Rooms premier publicly traded gaming
Footage or Leased
companies PENN, BYD, and ERI
(1) Represents GLPI’s property metrics as reported in the 10-K on February 21, 2020 adjusted for the acquisition of the Tropicana Las Vegas and the agreed upon
acquisition of a ground lease in Morgantown, PA. Detailed information is provided in the Appendix.
(2) As of 5/31/20 based on 2.40/yr annual Q1 2020 dividend run rate and 5/29//20 closing price, 95%+ figure based on Q1 actuals; Source: Company Filings, Earnings
Releases and Bloomberg
3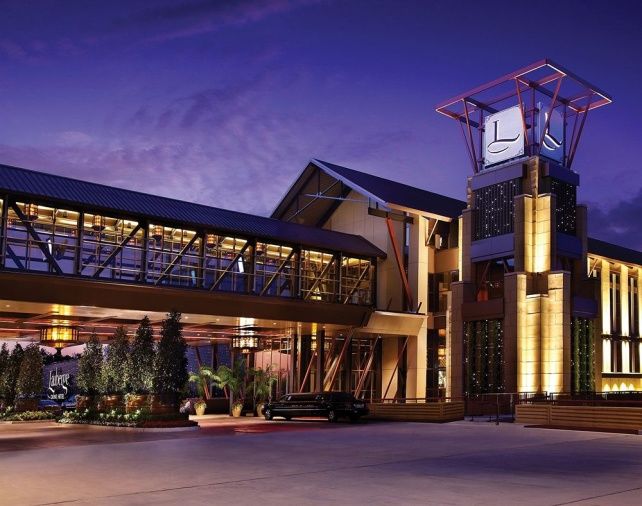
High Quality Real Estate Portfolio
               The quality and relevance of our portfolio is demonstrated by the solid property performance
           of our market leading properties, driving gross Gaming Revenue (GGR) for our portfolio to over
                                                  $6.2 billion in 2019

A                                    B                                    C                                          D                                  E    Hollywood Casino
                            (1)
 Ameristar Black Hawk                 Ameristar Kansas City                   Ameristar St. Charles                      Hollywood Casino                        Columbus
  #1 Casino in Colorado               #1 Casino in Kansas City                #1 Casino in St. Louis                           Toledo                       #1 Casino in Columbus
                                       2019 GGR: $193mm                        2019 GGR: $267mm                          #1 Casino in Toledo                 2019 GGR: $229mm
                                                                                                                         2019 GGR: $202mm

F                                    G                                                                                                         #1
    Hollywood Casino
                                     Hollywood Casino at Penn
     at Charles Town
                                       National Race Course
     #1 Casino in WV
                                       #1 Casino in Central PA
    2019 GGR: $358mm
                                         2019 GGR: $252mm
                                                                                                                                D
                                                                                                                           #1            #1
                                                                                                                                #1
                                                                                                                                     #1
                                                                                                                                          G             H
                                                                           #1
                                                                                                   #1                                                       Tropicana Evansville
                                                                               A                            #1       #1    E                                #1 Casino in Evansville
                                                                                               B                                     F                       2019 GGR: $141mm
                                                                                                                      H
                                                                                                        C
I                                    J
                        (1)
    Ameristar Vicksburg               L’Auberge Baton Rouge
     #1 Casino in Central             #1 Casino in Baton Rouge                                              #1   I
         Mississippi                     2019 GGR: $150mm

                                                                                                             #1

                                                                                                             J

                                                                                    Denotes #2 ranked casino in respective market
                                                                                              Denotes a property with no competitor within 60 minutes
(1) Gaming revenue is not reported by property in these states
Note: Based on 2019 annual gaming revenues as reported by each respective gaming commission. Market is defined as a 60 minute drive time. Number of gaming
      positions is used to rank properties in states that do not report property level gaming revenue (MS, NV, CO, NM)                                                      4
Source: Company Filings, Earnings Releases and State gaming commissions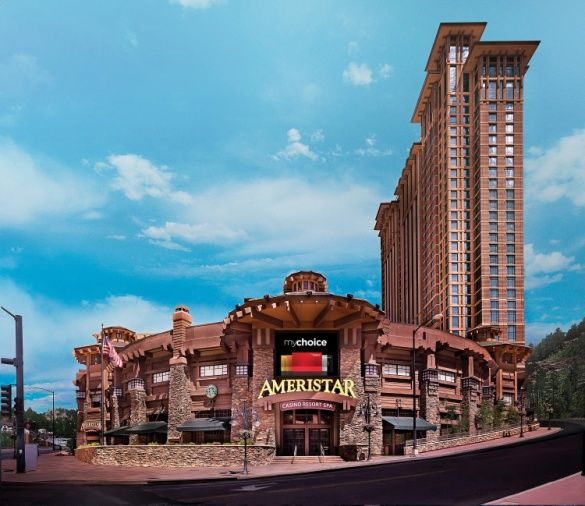
Strength & Durability Through Diversification

                                     Diversification across states / licensing jurisdictions is a key factor in ensuring our cash flow’s
                                                      durability. Our diverse footprint across 16 states is by design.

      No single property                                                                            PENN Operated Casino
   generates > 5.7% of 2019
                                                                                                    Casino Queen
    pro forma gross gaming
          revenues (2)                                                                              BYD Operated Casino   (1)

                                                                                                    Casinos Owned & Operated

                                                                                                    ERI Operated Casino   (1)

(1) Include two properties for which GLPI has provided loans as well as the Tropicana and Morgantown properties
(2) Based on 2019 annual gaming revenues reported by gaming commissions. Management estimates were utilized in jurisdictions which do not report by
    property gaming revenue results                                                                                                                   5
Source: Company Filings and Earnings Releases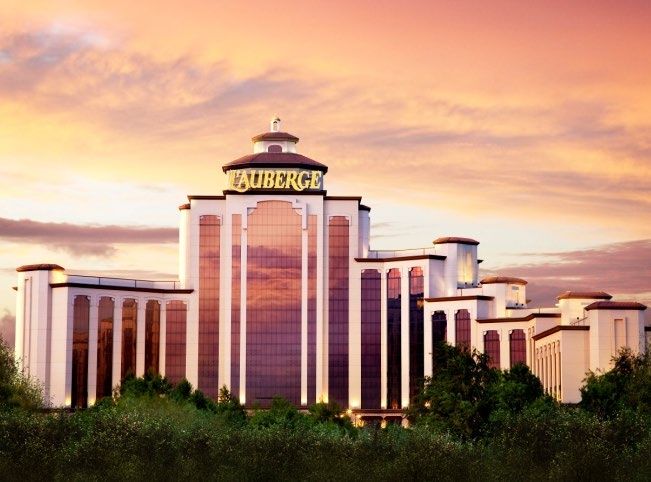
Tenant Strength Enhances Cash Flow Durability

        Our Major Tenants are Credit Worthy Public Companies with: Strong
        Balance Sheets, Institutional Quality Operational Platforms, Extensive
                         Experience, and Established Brands

      The largest U.S. regional gaming                                 A leading multi-jurisdictional              A highly-respected operator of a large
    operator of 40 gaming entertainment                                    operator of 29 gaming                   and diversified portfolio of 28 regional
      properties in 18 jurisdictions, with                            entertainment properties in 10               gaming assets in 13 jurisdictions, with
     approximately $5.3 billion in annual                            jurisdictions, with approximately              approximately $2.5 billion in annual
                net revenue (1)                                      $3.3 billion in annual net revenue                        net revenue (1)
                                                                                         (1)

                Enterprise Value:                                             Enterprise Value:                             Enterprise Value:
                $15.5 Billion +(2)                                             $6.8 Billion +(2)                             $5.1 Billion +(2)

              Equity Market Cap:                                             Equity Market Cap:                            Equity Market Cap:
               $4.4 Billion +(2)                                              $2.3 Billion +(2)                             $2.7 Billion +(2)

            Longest-dated (1/27)                                         Longest-dated (12/27)                           Longest-dated (9/26)
           unsecured debt yield to                                       unsecured debt yield to                          unsecured debt yield
              maturity: 6.47%(2)                                           maturity: 6.13%(2)                            to maturity: 4.83%(2)

    Master Lease payments are not subject to debt subordination or restricted payment limitations

     In order to cease Master Lease payments, a tenant would be required to reject the portfolio of
    leases via bankruptcy, vacate all leased properties, and participate in a sale process to transfer
                                   the gaming license to a successor
(1) 2019 revenue figures as presented by Bloomberg                                                                                                    6
(2) Based on 5/29/20 closing quotes; debt yields are closing mid YTM; enterprise value as presented by Bloomberg
Source: Bloomberg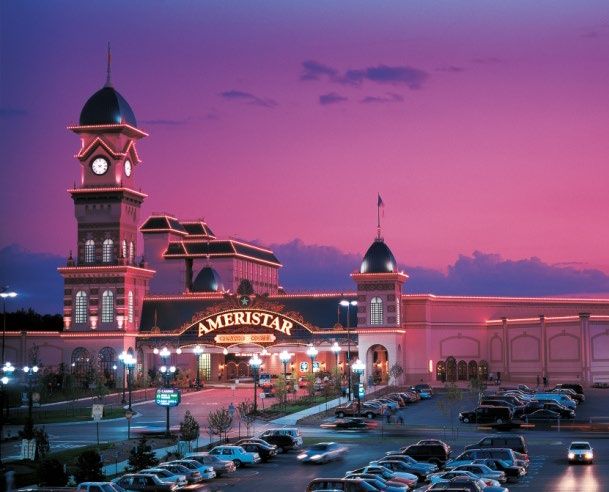
Superior Master Lease Characteristics
Lease Characteristic GLPI Checks All The Boxes
Achieves High Occupancy
Rate
• GLPI has operated at 100% occupancy since inception
• Master lease requires tenant to sell all operating assets to new tenant, including the gaming license
Minimizes Period a Vacated
Property Remains with No
• In the event a tenant does not elect to renew a lease, lease mechanics provide a time frame for tenants to sell their
Tenant operating assets without disrupting the lease stream to GLPI or the gaming tax revenue to the host state
Minimizes Period a Property
is Not Operated after Lease
• Only a greenfield project would require a delay - all other leased properties have demonstrated no operational impact
Signing • Casino remodeling is generally done in phases with limited impact to operations
Maximizes the Likelihood
Maximizes
thatthat
the the
Remain
Property
Open Open
Likelihood
Remains
Properties
or Re-open
in a Downside
• Governments have incentives to help casinos succeed
in a Downside Scenario
Scenario • Governments want to protect their receipt of gaming taxes and employment provided by casinos
Limits the Negotiating
All or None Terms Protect
Power of the Tenant in a
against cherry picking
• Cross-collateralization eliminates the risk of being forced to make a concession to a single property facing difficulties
Stress Scenario (1)
• Obligations under the master lease are guaranteed by the operators' parents
Increases Tenant
Uniquely High Credit
Level
Transparency
Quality
of
• GLPI reports rent coverage metrics which provides a clear indication of the credit quality
• Certain state jurisdictions report gaming revenue performance monthly
GLPI’s assets and lease terms provide significant stability of rental income
(1) BYD master lease does not have a parent guarantee but has a higher default coverage ratio of 1.4x 7
Master Leases Offer Long-Term Stability
GLPI’s Lease Terms Provide Enhanced
Rent Stability & Protection Over Long Lease Terms
Amended PNK
PENN PENN ERI BYD
Property Count 19 12 5 3
Number of States 10 8 5 2
Corporate Guarantee from Master
Guarantee Lease Subsidiary
Default Adjusted
Rent to Revenue 1.10x 1.20x 1.20x 1.40x
Coverage *
Master Leases Generated over 90% of GLPI’s Combined Real Estate Cash NOI & TRS EBITDA in 2019
Note: Casino Queen and Meadows lease terms not shown as they are single asset leases; Mortgage properties and TRS properties also not included in master lease detail above
* Given the COVID-19 backdrop and its impact, we have no interest in defaulting our tenants as long as they are engaged with GLPI in a collaborative dialogue
8
Casino Property Taxes are Critical Assets to State Revenues
State and local governments have a vested interest in the success of our properties. They rely heavily on
gaming tax revenues to support their budgets.
The importance of gaming property taxes to state and local economies provides an added layer of credit
protection that other real estate sectors do not provide
Protected, limited license jurisdictions tend to have much higher tax rates. The more “protected” the
competitive landscape, often the higher the tax rate, and the higher the alignment of interests in ensuring the
longevity and durability of the business
To better demonstrate the financial impact, GLPI looked at the gaming tax revenue paid in each of its top 7
limited license jurisdiction states based on total gross gaming revenue (GGR) reported at its currently owned
properties:
Estimated Gaming Tax Rates by State
Year Ended 2019 Nevada
South Dakota
6.8%
8.0%
State GGR Taxes New Jersey
Mississippi
9.3%
11.2%
Missouri $ 1,084 $ 227 Michigan
Colorado
18.0%
20.0%
Ohio 777 223 Missouri
Louisiana
21.0%
21.5%
Louisiana 705 151 Iowa
Connecticut
22.0%
25.0%
Indiana 612 180 Kansas 27.0%
Pennsylvania 491 197
Average 35.6%
Florida 35.0%
Illinois 369 101 Indiana
Maine
35.0%
39.0%
(1)
West Virginia 358 165 Oklahoma
New Mexico
41.0%
46.0%
Total $ 4,396 $ 1,244 Maine
Illinois
47.8%
50.0%
Delaware 52.0%
Pennsylvania 55.0%
West Virginia 58.0%
New York 66.0%
Maryland 67.0%
Rhode Island 72.6%
0.0% 10.0% 20.0% 30.0% 40.0% 50.0% 60.0% 70.0% 80.0%
Note: $ in millions, excludes GLPI’s one mortgaged property Source: State Gaming C ommissions; Wells Fargo Securities, LLC 's estimates.
(1) Estimated based on tax rates and 2019 GGR figures 9
Source: State gaming commissions and Fantini researchDemonstrated Durability of Regional Gaming Markets
GLPI’s Regional Markets Have Proven More Profitable And Stable During a
Major Downturn Than The Las Vegas Market
Gaming Adj. EBITDA Growth ⁽¹⁾ (%) Rent Coverage ⁽¹⁾
PENN PNK (2) Vegas (3) Vegas Adj. (4)
0.0% 2.0x
1.9x
(5.0%) (1.3%)
1.8x
(10.0%)
(15.0%)
(17.0%)
1.6x 1.6x
(20.0%)
(25.0%) 1.4x
(30.0%)
1.2x
(35.0%)
1.1x
(40.0%)
(42.8%) 1.0x
1.0x
(45.0%) (47.1%)
(50.0%) 0.8x
2007 2008 2009 2010 2007 2008 2009 2010
(1) Excludes BYD because BYD assets were owned by PNK. Excludes Tropicana because it predominantly consisted of Atlantic City portfolio at that time. Assumes rent was at
the same terms as existing master leases during the time period shown
(2) Excludes St. Louis and Ameristar assets
(3) Includes Las Vegas assets for CZR, LVS, MGM (excluding City Center due to negative Adjusted EBITDA) and WYNN
(4) Same as Vegas, adjusted to account for an assumed 4% cost of capital on $4.1bn of capital expenditures related to Palazzo and Encore 10
Note: Excludes corporate overhead and includes the impact from smoking bans and cannibalization
Source: Company Filings and Earnings ReleasesTrack Record of Transaction Success
GLPI’s unique competitive advantages have supported an annual sourcing of transactions with
a value of over $1 Billion at an average yield of over 8.4% since inception.
Date Closed Properties Purchase Price Initial Cash Yield/Rent Cap Rate
TBD Morgantown Ground Lease $ 30.0 $ 3.0 10.0%
4/20/2020 Tropicana Las Vegas $ 307.5
10/15/2018 Plainridge Park Casino $ 250.9 $ 25.0 10.0%
PENN/PNK Lease Adjustment $ 13.9
10/15/2018 Belterra Park (Mortgage) $ 57.7 $ 6.4 11.1%
10/1/2018 Lumiere (Mortgage) $ 246.0 $ 22.4 9.1%
10/1/2018 Tropicana Atlantic City $ 992.5 $ 87.6 8.8%
Tropicana Evensville
Tropicana Laughlin
Tropicana Casino Greenville
Belle of Baton Rouge
5/1/2017 1st Jackpot Casino $ 82.9 $ 9.0 10.9%
Resorts Casino&Hotel Tunica
9/9/2016 Meadows Racetrack and Casino $ 323.3 $ 25.4 7.9%
4/28/2016 Ameristar Casino Resort Spa Black Hawk $ 4,779.0 $ 377.0 7.9%
Ameristar Casino Hotel East Chicago
Belterra Casino Resort
Ameristar Casino Hotel Council Bluffs
L'Auberge Casino & Hotel Baton Rouge
Boomtown Casino & Hotel Bossier City
L'Auberge Casino Resort Lake Charles
Boomtown Casino New Orleans
Ameristar Casino Hotel Vicksburg
Ameristar Casino Hotel Kansas City
Ameristar Casino Resort Spa St. Charles
River City Casino & Hotel
Cactus Petes
The Horseshu
1/23/2014 Casino Queen $ 140.7 $ 14.0 9.95%
TOTAL $ 7,210.5 $ 583.7 8.46%
11
Note: Purchase prices include transaction fees; Tropicana Las Vegas excluded from cap rate calculation given the transaction’s unique constructBalance Sheet Strength
Durability of our income stream, well-laddered Demonstrated Access to Capital
debt maturity profile, and healthy duration give
the company a firm foundation
Achieved cross-over Investment Grade
All existing debt is unsecured Status in 2018
Demonstrated commitment to maintaining robust Amended $1.175bn revolver to provide
liquidity and sound governance additional liquidity
Fungible pooled asset cash flow from master In August 2019, Issued $400mm of 5 year
leases de-risks individual asset performance, notes with a 3.372% YTM and $700mm of
anchoring balance sheet and providing flexibility long 10 year notes with a 4.03% YTM
through market cycles
Debt Maturity Profile GLPI Issue Rating by Agency
Standard & Poor's
BBB-
Fitch
BBB-
Moody's
Ba1
12COVID-19 Related Actions
Given our early appreciation of the pandemic’s potential impact, we have taken
a number of decisive steps, in an abundance of caution, in the effort to
strengthen our platform for the benefit of shareholders, we:
• Drew $531mm of cash from revolver to bolster liquidity
• Structured and completed the March 27th Penn National Transaction (which
included the Tropicana transaction)
• Adjusted the dividend to accommodate the non-cash nature of the Tropicana
transaction while incorporating a more conservative payout ratio given the
uncertainty surrounding COVID
• Engaged in the effort to complete a satisfactory rent deferral agreement for
our Casino Queen property
• Mitigated operating costs at our two operating properties through a furlough
of 86% of GLPI’s overall workforce; while continuing benefits at least
through 6/30
GLPI is well positioned with:
• Strong cash balance of $559mm+ as of 3/31/20
• Rent collection of 98.6% of contractual rent due in April and May
• Control of the Tropicana Vegas Hotel and Casino, oversight of ongoing
sales process, and potential for optionality in the future 13March 27th Penn National Transaction
GLPI agreed to acquire the Tropicana Las Vegas Hotel and Casino redevelopment
site from Penn Gaming along with a ground lease at Morgantown, PA and in a
novel transaction structure that granted Penn Gaming $337.5mm of rent credit.
Win-Win transaction that:
• Enhanced certainty of economic wholeness for GLPI shareholders a stronger liquidity roadmap
for Penn National
• Strengthened the credit support behind GLPI’s lease payments
• Granted PENN runway & visibility that ultimately supported PENN’s capital market access
• Protects GLPI from the impact of property carry costs for up to 5 years while grating Penn
National participation in upside for the initial 2 years post transaction
• Gave GLPI access to a land lease at Penn’s Morgantown development property at a 10% cap rate
The overall transaction agreement
created additional value for GLPI
shareholders through:
• Acquisition of a ground lease at
Morgantown for an additional $30
million of rent credit at a 10 cap rate.
• Early renewal of both master leases
to which Penn National is a party,
moving the next lease renewal date
to 2031 for the Amended Pinnacle
lease and to 2033 for the original
Penn Master lease.
• Granting Penn an option to purchase
the operations at our Perryville TRS
asset, which if exercised would be
added to a new master lease along
with the Morgantown ground lease.
14ESG Highlights
(2)
(3)
We believe that environmental and community stewardship is an integral component of growing
shareholder value and we are committed to fostering a corporate culture that encourages and seeks
the betterment of GLPI and the communities in which we operate or conduct business.
Environmental Stewardship Social Responsibility
• GLPI’s workforce is comprised of 48% women (as of
• We promote sustainable practices and
12/31/19)
environmental stewardship throughout the
organization, with a particular emphasis on energy • Corporate environment fosters a sense of
efficiency, recycling, water conservation, indoor community and well-being
environmental quality and environmental
• Senior level management conducts “town-hall” style
awareness
meetings with corporate employees to address
• For all acquisitions, a Phase I Environmental Site topics such as business operations, strategy, and
Assessment is utilized to identify environmental market conditions
conditions that may have a material adverse
• Encouragement of an open feedback culture
impact on the property being assessed or its
immediate surrounding area • Our Leadership Academy cultivates management
and leadership skills to empower our employees to
• LED lighting and motion sensors installed at our
succeed in their careers
owned properties to conserve energy, reduce cost
• We provide tuition reimbursement, professional
• Smoke free environments at our owned properties
development reimbursement and internal growth
• Sophisticated rain water management system and advancement opportunities
installed at our corporate HQ to help reduce
• Commitment to diversity & inclusion awareness
flooding and pollutants in water run-off
• We participate in educational and recruitment
• Ongoing engagement with our tenants on
outreach programs including local college and
sustainability best practices, which has led to the
university job fairs, veteran career expos, on-site
installation of guest room occupancy based
open house recruitment and internship opportunities
thermostats, building management systems
upgrades and electronic vehicle charging stations • Responsible Gaming Policy facilitates employee and
customer awareness on responsible gaming
• Community support through non-profit partnerships
and sponsorships
15ESG Highlights
(2)
Corporate Governance
Our Board of Directors is collectively responsible for the leadership, management and long-term
success of the company. Our Board strives to maintain a governance environment where the
interests of all stakeholders, including the impact of our operations on the environment, and the
social well-being of our employees, the local community and broader society, are considered in
developing policies and making decisions intended to ensure the long-term prosperity of GLPI.
• Three Board committees • Formal commitment to diversity representation
on the board including, but is not limited to,
• Audit and Compliance Committee
gender, race, ethnicity, age, education, tenure,
• Compensation Committee background, professional experience and
• Nominating and Corporate Governance independence
Committee • Stock ownership guidelines for non-employee
• Board oversight of ESG matters directors
• Declassified board • Overall oversight of enterprise risk management
activities
• Lead Independent Director
• Organization-wide compliance and ethics training
• Majority voting standards annually
• Shareholder engagement • Independent reporting hotline
In March 2020, we amended the charter of our Nominating and Corporate Governance Committee to
formally establish the committee’s responsibility for GLPI’s strategies, activities, policies and
communications regarding sustainability and ESG matters. In addition, we enhanced our Corporate
Governance Guidelines to further demonstrate our commitment to Board diversity and added
additional information to our Code of Business Conduct about our policies concerning equal
employment opportunity, non-discrimination, anti-harassment and anti-bribery, among others.
For more details on our corporate governance policies, please view our most recent Proxy
Statement by visiting www.glpropinc.com
16Talented, Best In Class Management Team
Peter Carlino - Chief Executive Officer and Chairman of the Board
1972-1974, 1974-1994 Served first as President of Mountainview Thoroughbred Racing Association,
predecessor to Penn National Gaming
1997 – Led the charge for the successful passage of slot machine gaming at Charles Town Races in
West Virginia after two unsuccessful attempts by previous owners
2003 – Acquired Hollywood Casino Corporation, which doubled the size of the Company at the time
2004 – Named “Best Performing CEO” by HVS Executive Search based on prior year
performance relative to his peers for corporate financial growth and decision making
methodology
2005 – Acquired Argosy Gaming Company, again nearly doubling the size of the Company
2007 — Penn National was honored for appearing a record six consecutive years on Fortune
Magazine's list of “100 Fastest Growing Companies”
2009 – Penn National played a leading role in amending the Ohio State Constitution, resulting in two
new casino properties and eventually two racinos
2010 – Fulfilled nearly 30 year quest for passage of gaming in Pennsylvania
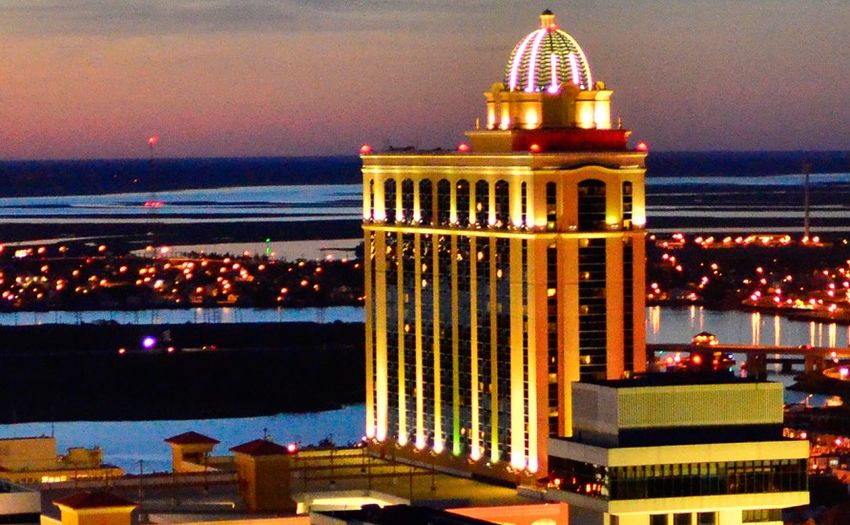
2011 – Penn National acquired M Resort Las Vegas
2013 – Oversaw the creation of the first gaming REIT, named CEO & Chairman of GLPI
2016 – Gaming & Leisure Properties acquired the real estate of Pinnacle Entertainment in a complex
transaction
2018 - Inducted into the Gaming Hall of Fame in 2018, Carlino was honored for his 30-year record
as an industry visionary and for his accomplishments in driving racetrack and casino owner Penn
National Gaming's consistent growth from a single racetrack to what is today the nation's largest
regional gaming operator and subsequently creating and leading the nation’s first gaming REIT
Steven Snyder - Chief Financial Officer & Senior Vice President
May 2018 – Current Serves as GLPI’s CFO
2013 – 2018 GLPI’s SVP of Corporate Development from founding of Company with responsibility for all
strategic endeavors
2003- 2013 SVP of Corporate Development of Penn National Gaming
1998 – 2003 VP of Corporate Development
Pre 1998 Career in investment banking regionally in the Mid Atlantic region
Education: MSIA from Carnegie Mellon University Graduate School of Industrial Administration;
BA from Dickinson College
17Appendix
Properties
(1)
Tenant Occupied Properties Location Tenant/Operator Approx. Property Square Footage Owned Acreage Leased Acreage (2) Hotel Rooms
Hol l ywood Casi no Lawrenceburg Lawrenceburg, IN Penn 634,000 73.1 32.1 295
Hol l ywood Casi no Aurora Aurora, IL Penn 222,189 0.4 1.7 -
Hol l ywood Casi no Jol i et Jol i et, IL Penn 322,446 275.6 - 100
Argosy Casi no Al ton Al ton, IL Penn 124,569 0.2 3.6 -
Hol l ywood Casi no Tol edo Tol edo, OH Penn 285,335 42.3 - -
Hol l ywood Casi no Col umbus Col umbus, OH Penn 354,075 116.2 - -
Hol l ywood Casi no at Charl es Town Races Charl es Town, WV Penn 511,249 298.6 - 153
Hol l ywood Casi no at Penn Nati onal Race Course Grantvi l l e, PA Penn 451,758 573.7 - -
M Resort Henderson, NV Penn 910,173 83.5 - 390
Hol l ywood Casi no Bangor Bangor, ME Penn 257,085 6.4 37.9 152
(3)
Zi a Park Casi no Hobbs, NM Penn 109,067 317.4 - -
Hol l ywood Casi no Gul f Coast Bay St. Loui s, MS Penn 425,920 578.7 - 291
Argosy Casi no Ri versi de Ri versi de, MO Penn 450,397 37.9 - 258
Hol l ywood Casi no Tuni ca Tuni ca, MS Penn 315,831 - 67.7 494
Boomtown Bi l oxi Bi l oxi , MS Penn 134,800 1.5 1.0 -
Hol l ywood Casi no St. Loui s Maryl and Hei ghts, MO Penn 645,270 220.8 - 502
Hol l ywood Gami ng at Dayton Raceway Dayton, OH Penn 191,037 119.7 - -
Hol l ywood Gami ng at Mahoni ng Val l ey Race Course Youngstown, OH Penn 177,448 193.4 - -
1st Jackpot Casi no Tuni ca, MS Penn 78,941 52.9 93.8 -
Ameri star Bl ack Hawk Bl ack Hawk, CO Penn 775,744 104.1 - 536
Ameri star East Chi cago East Chi cago, IN Penn 509,867 - 21.6 288
(3)
Ameri star Counci l Bl uffs Counci l Bl uffs, IA Penn 312,047 36.2 22.6 160
L'Auberge Baton Rouge Baton Rouge, LA Penn 436,461 99.1 - 205
Boomtown Bossi er Ci ty Bossi er Ci ty, LA Penn 281,747 21.8 - 187
L'Auberge Lake Charl es Lake Charl es, LA Penn 1,014,497 - 234.5 995
Boomtown New Orl eans New Orl eans, LA Penn 278,227 53.6 - 150
Ameri star Vi cksburg Vi cksburg, MS Penn 298,006 74.1 - 148
Ri ver Ci ty Casi no and Hotel St. Loui s, MO Penn 431,226 - 83.4 200
(4)
Jackpot Properti es Jackpot, NV Penn 419,800 79.5 - 416
Pl ai nri dge Park Casi no Pl ai nvi l l e, MA Penn 196,473 87.9 - -
(3)
The Meadows Racetrack and Casi no Washi ngton, PA Penn 417,921 155.5 - -
Casi no Queen (3) East St. Loui s, IL Casi no Queen 330,502 67.2 - 157
Bel terra Casi no Resort Fl orence, IN Boyd 782,393 167.1 148.5 662
Ameri star Kansas Ci ty Kansas Ci ty, MO Boyd 763,939 224.5 31.4 184
Ameri star St. Charl es St. Charl es, MO Boyd 1,272,938 241.2 - 397
Bel terra Park Gami ng & Entertai nment Center Ci nci nnati , OH Boyd 372,650 160.0 - -
Tropi cana Atl anti c Ci ty Atl anti c Ci ty, NJ El dorado 4,232,018 18.3 - 2,364
Tropi cana Evansvi l l e Evansvi l l e, IN El dorado 754,833 18.4 10.2 338
Tropi cana Laughl i n Laughl i n, NV El dorado 936,453 93.6 - 1,487
Trop Casi no Greenvi l l e Greenvi l l e, MS El dorado 94,017 - 7.4 40
Bel l e of Baton Rouge Baton Rouge, LA El dorado 386,398 13.1 0.8 288
TRS Operating Properties
Hol l ywood Casi no Baton Rouge Baton Rouge, LA GLPI 95,318 25.1 - -
Hol l ywood Casi no Perryvi l l e Perryvi l l e, MD GLPI 97,961 36.3 - -
2020 Acquisition Properties
(5)
Tropi cana Las Vegas Las Vegas, NV Penn 1,451,842 35.1 - 1470
Morgantown Ground Lease (5) Morgantown, PA Penn - 36.0 - -
Total 23,544,868 4,840 798 13,307
(1)
Square footage includes air-conditioned space and excludes parking garages and barns
(2)
Leased acreage reflects land subject to leases with third-parties and includes land on which certain of the current facilities and ancillary supporting structures are located as well as parking lots and access rights
(3)
These properties include hotels not owned by the Company. Square footage and rooms associated with properties not owned by GLPI are excluded from the table above
(4)
Encompasses two gaming properties in Jackpot, Nevada: Cactus Pete's and The Horseshu
(5)
Pro forma additions since the 12/31/19 10-K; the Tropicana Las Vegas is owned by GLPI while the Morgantown Ground Lease is subject to a binding agreement but has yet to close. Tropicana LV data is based on an architectural report,
property records, and marketing materials.Definitions of Non-GAAP Financial Measures Funds From Operations (“FFO”), Adjusted Funds From Operations (“AFFO”) and Adjusted EBITDA, which are detailed in the reconciliation tables that accompany this release, are used by the Company as performance measures for benchmarking against the Company’s peers and as internal measures of business operating performance, which is used for a bonus metric. The Company believes FFO, AFFO, and Adjusted EBITDA provide a meaningful perspective of the underlying operating performance of the Company’s current business. This is especially true since these measures exclude real estate depreciation, and we believe that real estate values fluctuate based on market conditions rather than depreciating in value ratably on a straight-line basis over time. In addition, in order for the Company to qualify as a REIT, it must distribute 90% of its REIT taxable income annually. The Company adjusts AFFO accordingly to provide our investors an estimate of taxable income for this distribution requirement. Direct financing lease adjustments represent the portion of cash rent we receive from tenants that is applied against our lease receivable and thus not recorded as revenue and the amortization of land rights represents the non-cash amortization of the value assigned to the Company's assumed ground leases. FFO, AFFO and Adjusted EBITDA are non-GAAP financial measures, that are considered a supplemental measure for the real estate industry and a supplement to GAAP measures. NAREIT defines FFO as net income (computed in accordance with generally accepted accounting principles), excluding (gains) or losses from sales of property and real estate depreciation. We have defined AFFO as FFO excluding stock based compensation expense, amortization of debt issuance costs, bond premiums and original issuance discounts, other depreciation, amortization of land rights, straight-line rent adjustments, direct financing lease adjustments, losses on debt extinguishment, retirement costs and goodwill impairment charges reduced by capital maintenance expenditures. Finally, we have defined Adjusted EBITDA as net income excluding interest, taxes on income, depreciation, (gains) or losses from sales of property, stock based compensation expense, straight-line rent adjustments, direct financing lease adjustments, the amortization of land rights, losses on debt extinguishment, retirement costs and goodwill impairment charges. FFO, AFFO and Adjusted EBITDA are not recognized terms under GAAP. These non-GAAP financial measures: (i) do not represent cash flow from operations as defined by GAAP; (ii) should not be considered as an alternative to net income as a measure of operating performance or to cash flows from operating, investing and financing activities; and (iii) are not alternatives to cash flow as a measure of liquidity. In addition, these measures should not be viewed as an indication of our ability to fund all of our cash needs, including to make cash distributions to our stockholders, to fund capital improvements, or to make interest payments on our indebtedness. Investors are also cautioned that FFO, FFO per share, AFFO, AFFO per share and Adjusted EBITDA, as presented, may not be comparable to similarly titled measures reported by other real estate companies, including REITs due to the fact that not all real estate companies use the same definitions. Our presentation of these measures does not replace the presentation of our financial results in accordance with GAAP.
You can also read


