2020 Full Year Results Presentation - 18 August 2020 - Bell Direct
←
→
Page content transcription
If your browser does not render page correctly, please read the page content below
SecondBite CEO Jim Mullan accepts donations from Coles during the COVID-19 pandemic. By the end of FY20, Coles had donated the
equivalent of 116 million meals to SecondBite since 2011 and the equivalent of 32 million meals to Foodbank since 2003. This is the equivalent of
148 million meals to people in need since 2003.

      2020 Full Year Results Presentation
      18 August 2020
Disclaimer
This presentation contains summary information about Coles Group Limited (ACN 004 089 936) and its related bodies corporate (together, Coles) and Coles’ activities as at the date
of this presentation. It is information given in summary form only and does not purport to be complete. It should be read in conjunction with Coles’ other periodic corporate reports
and continuous disclosure announcements filed with the Australian Securities Exchange (ASX), available at www.asx.com.au
This presentation is for information purposes only and is not a prospectus or product disclosure statement, financial product or investment advice or a recommendation to acquire
Coles shares or other securities. It has been prepared without taking into account the investment objectives, financial situation or needs of individuals. Before making an investment
decision, prospective investors should consider the appropriateness of the information having regard to their own investment objectives, financial situation and needs and seek legal,
taxation, business and/or financial advice appropriate to their circumstances. Past performance is no guarantee of future performance.
No representation or warranty, express or implied, is made as to the fairness, accuracy, completeness or correctness of the information, opinions and conclusions contained in this
presentation. To the maximum extent permitted by law, none of Coles or its directors, employees or agents, nor any other person, accepts liability for any loss arising from the use of
this presentation or its contents or otherwise arising in connection with it, including, without limitation, any liability from fault or negligence on the part of Coles or its directors,
employees, contractors or agents.
This presentation contains forward-looking statements in relation to Coles, including statements regarding Coles’ intent, belief, goals, objectives, initiatives, commitments or current
expectations with respect to Coles’ business and operations, market conditions, results of operations and financial conditions, and risk management practices. Forward-looking
statements can generally be identified by the use of words such as ‘forecast’, ‘estimate’, ‘plan’, ‘will’, ‘anticipate’, ‘may’, ‘believe’, ‘should’, ‘expect’, ‘intend’, ‘outlook’ and
‘guidance’ and other similar expressions.
The forward-looking statements are based on Coles’ good faith assumptions as to the financial, market, risk, regulatory and other relevant environments that will exist and affect
Coles’ business and operations in the future. Coles does not give any assurance that the assumptions will prove to be correct. The forward-looking statements involve known and
unknown risks, uncertainties and assumptions and other important factors, many of which are beyond the control of Coles, that could cause the actual results, performances or
achievements of Coles to be materially different to future results, performances or achievements expressed or implied by the statements.
Readers are cautioned not to place undue reliance on forward-looking statements, which speak only as at the date of the presentation. Except as required by applicable laws or
regulations, Coles does not undertake any obligation to publicly update or revise any of the forward-looking statements or to advise of any change in assumptions on which any
such statement is based.

Non-IFRS financial information
To support an understanding of comparable business performance, this 2020 Full Year Results Presentation presents results on a retail (non-IFRS basis). Retail results reflect a retail
calendar (which ends on the last Sunday in June) and include adjustments for the following non-comparable items:
• FY20
          • impacts of applying AASB 16 Leases, which was effective for the Group from 1 July 2019
          • impacts of significant items
• FY19
          • impacts of moving to a commission agent model under the new alliance agreement with Viva
          • impacts of the sale of Spirit Hotels
          • impacts of discontinued operations of Kmart, Target & Officeworks
          • impacts of significant items

Balance sheet and cash flow information presented in this 2020 Full Year Results Presentation is consistent with the information disclosed in the statutory presentation in the Appendix
4E Full Year Financial Report. In relation to the comparative period, Coles’ external auditors have performed certain agreed upon procedures relating to the adjustments between
the statutory and retail calendar profit and loss disclosures.

Due to rounding, numbers presented throughout this document may not add up precisely to the totals provided and percentages may not precisely reflect the absolute figures.

                                                                                                                                                                                             1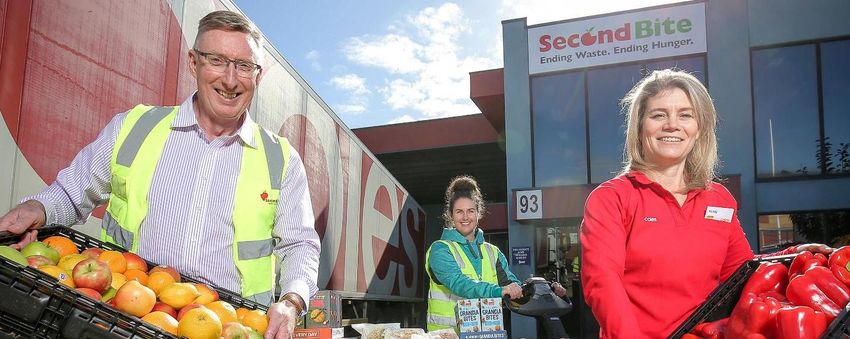
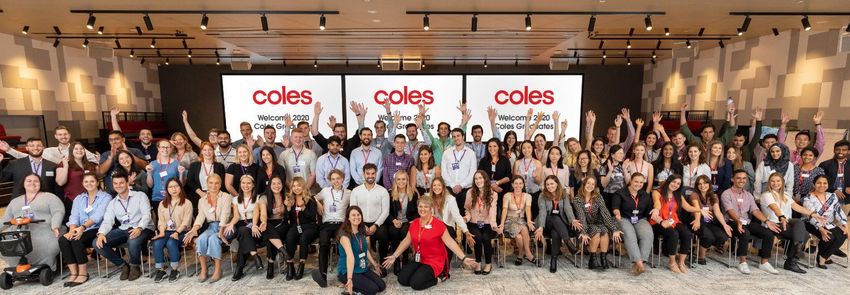
Coles 2020 graduates in February at the Store Support Centre in Melbourne (pre-social distancing). Coles was named the Most Popular Retail
and FMCG Employer in the Top100 Graduate Employers 2020 Awards.

   FY20 summary
FY20 financial highlights
First year strategy delivered whilst supporting team members, suppliers and
community through droughts, bushfires and COVID-19

     Total sales revenue                                                                     EBIT                                            Supers comp sales
                                                                                                                                              growth of 5.9%2
                                 $37.4bn                                                            $1,387m                                                        51 quarters of
                             6.9% vs.          pcp1                                              4.7% vs.          pcp1                                             consecutive
                                                                                                                                                                      growth

          Smarter Selling                                                    Gross operating                                               Operating cash flow
                                                                                 capex
                              >$250m                                                 $833m                                                                            $2,240m
                             in cost-out                                                                                                                              111% cash
                                                                                             on an accrued
                              initiatives                                                                                                                             realisation
                                                                                                 basis

                 Dividend3                                                Net financial debt                                                                 Safety
                                                                                                                                                              22.7 TRIFR4
                             57.5 cents per                                                        $362m                                                           18.3%
                              share fully-                                                     pre dividend
                                                                                                                                                                improvement
                                franked                                                          payment
                                                                                                                                                                  vs. FY19

1 Sales revenue excludes Fuel sales and Hotels in FY19. EBIT is based on a retail (non-IFRS) basis and is pre-AASB 16 in FY20 and excludes Hotels and significant items in FY19.
2 To better align the timing of comparable sales between the FY20 and FY19 financial periods, FY19 is based on 2 July 2018 to 30 June 2019.
3 The Coles Board has declared a fully-franked final dividend of 27.5 cents per share. Coles paid an interim dividend of 30.0 cents per share on 27 March 2020.
4 Total Recordable Injury Frequency Rate.
                                                                                                                                                                                    3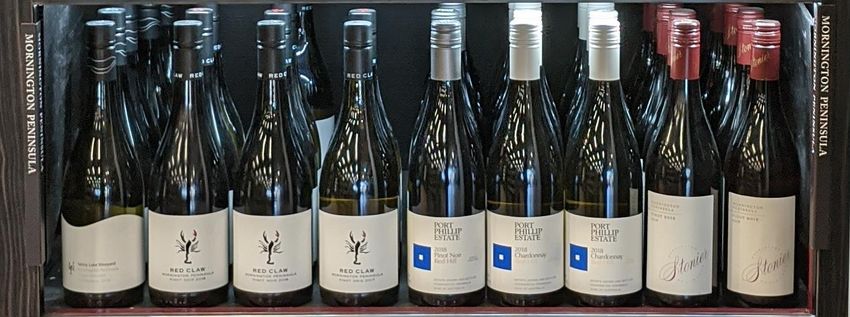
Winning in our second century
Coles Group Values launched in second half building on the existing Look ahead,
Energise everyone and Deliver with pride (LEaD) behaviours framework

                                                                   We value…

                                                     Enabled by our behaviours…

                                    look ahead                     energise everyone                   deliver with pride
                            know your stuff ∙ have a plan ∙   build it together ∙ empower and   own it ∙ stay the course ∙ have fun
                                  explain the why              support ∙ celebrate progress                     with it

                                                                                                                                      4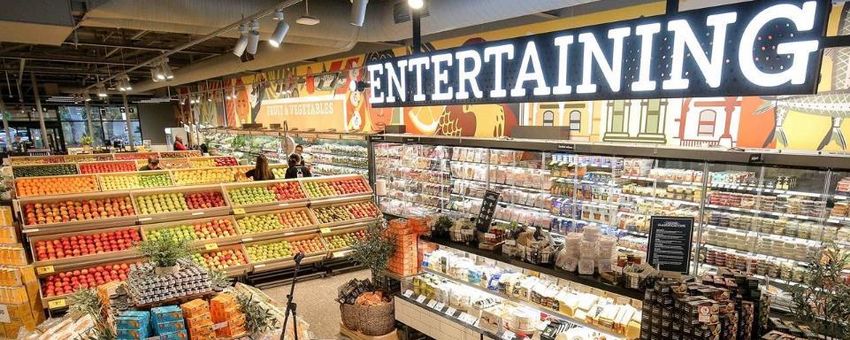
Strengthened leadership team with five new executives

                                                                                        Steven Cain
                                                                                   Chief Executive Officer

        Leah Weckert               Greg Davis               Matt Swindells            Darren Blackhurst        Ben Hassing             Thinus Keevé            George Saoud
    Chief Financial Officer      Chief Executive       Chief Operations Officer     Chief Executive Liquor    Chief Executive       Chief Sustainability,      Chief Executive
                               Commercial & Express                                                            eCommerce         Property & Export Officer   Emerging Businesses

       David Brewster                Kris Webb              Roger Sniezek                Lisa Ronson          Daniella Pereira          Ian Bowring            Sally Fielke
Chief Legal & Safety Officer    Chief People Officer   Chief Information Officer   Chief Marketing Officer   Company Secretary       Group Executive         General Manager
                                                                                                                                      Transformation         Corporate Affairs

                                                                                                               Joined in FY20
                                                                                                                                                                                   5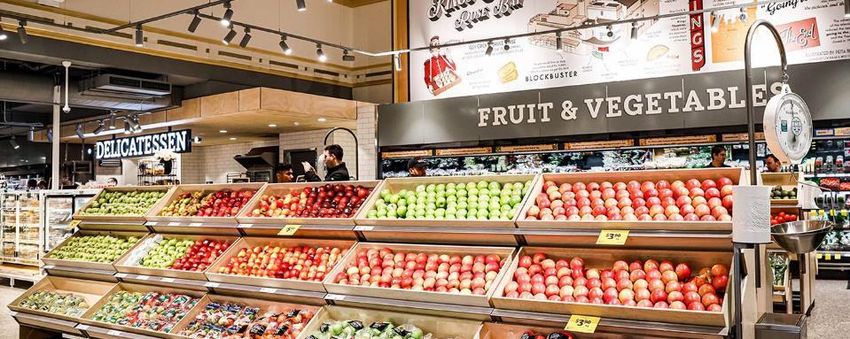
Progress against strategy: Inspire Customers
Improvement in customer satisfaction across Supermarkets, Liquor and Express in Q4
                                                              ▪   Data driven ranging tools enable one of the largest tailored range
                                                                  change across stores in many years with >1,600 new SKUs
                                                              ▪   Delivered trusted value through the “Helping lower the cost of…”
                                                                  campaign
                                                              ▪   Lowered the cost of living for customers with >1,500 new products
                                                                  on everyday low prices
                                                              ▪   >$10 billion in Own Brand sales growing by 10% with >1,850 products
                                                                  launched
                                                              ▪   Introduced a dedicated convenience meals section across almost
                                                                  150 supermarkets with >240 new lines launched including the new
Contactless Click & Collect has now been rolled out to more       Coles Kitchen range from our recently acquired Jewel
than 400 supermarkets.
                                                                  manufacturing facility in Sydney
                                                              ▪   Almost doubled online capacity through rapid roll out of contactless
                                                                  Click & Collect
                                                              ▪   Re-platformed coles.com.au and all three Liquor banners websites
                                                              ▪   Significant investment in flybuys to build a cloud-based data
                                                                  analytics and loyalty management platform that will benefit
                                                                  members through a seamless digital experience
                                                              ▪   Refreshed Liquor strategy focusing on being a simpler, more
                                                                  accessible, locally relevant drinks specialist
                                                              ▪   Double-digit revenue growth in meat Export business with strong
                                                                  growth in Asia

The expanded convenience range at Tooronga, Victoria.

                                                                                                                                         6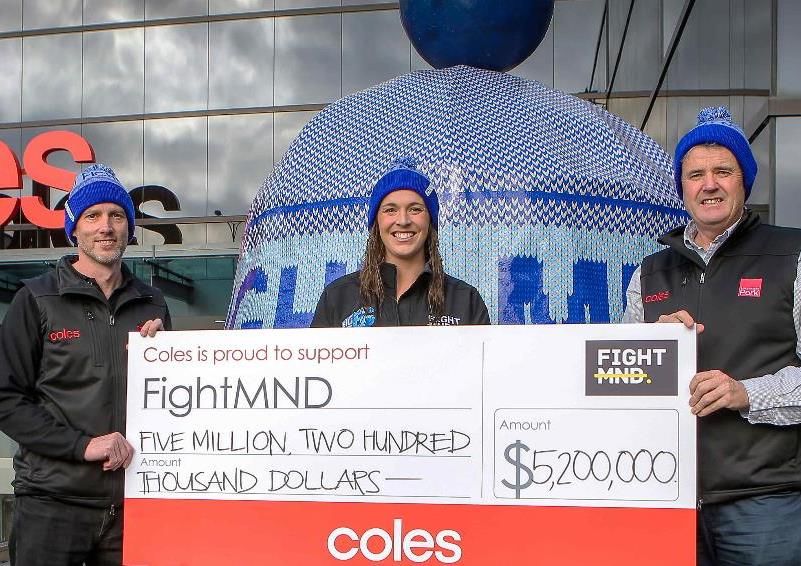
Progress against strategy: Smarter Selling
Achieved cost savings >$250m as Coles pivots to greater use of technology to
drive efficiencies
                                                             ▪   Streamlined SSC with removal of 450 roles and implementation of
                                                                 new systems across Finance and Procurement
                                                             ▪   Establishment of transport hubs in Victoria and NSW enabling Coles
                                                                 to optimise logistics and significantly increase backhaul
                                                             ▪   Improved labour productivity through end-to-end supply chain
                                                                 optimisation (e.g. delivery frequency and full pallet picks)
                                                             ▪   New data and technology-led solutions in store (e.g. Deli easy
                                                                 ordering and bakery production tools)
                                                             ▪   Energy and waste management reductions (e.g. LED lights and
                                                                 refrigeration control system)
                                                             ▪   Implemented measures to reduce loss in store (e.g. glass panels at
A transport hub driving efficiencies in the supply chain.        front of store, anti-sweep shelving)
                                                             ▪   Renewed 70 supermarkets in the year including 10 Format A, 31
                                                                 Format C and 3 Coles Local
                                                             ▪   Developed AI tools to drive greater efficiencies across the business in
                                                                 areas such as forecasting and dynamic markdowns
                                                             ▪   Technology enabled transition of >3,000 SSC team members
                                                                 Australia-wide to remote working
                                                             ▪   Entered into long-term leases for development of Ocado sites in
                                                                 Sydney and Melbourne, construction commenced on Melbourne site
                                                             ▪   Structural work at Witron automated distribution centre in
                                                                 Queensland progressing, NSW distribution centre at approvals
                                                                 stage
Coles team members attending a virtual forum while working
remotely during COVID-19.                                                                                                              7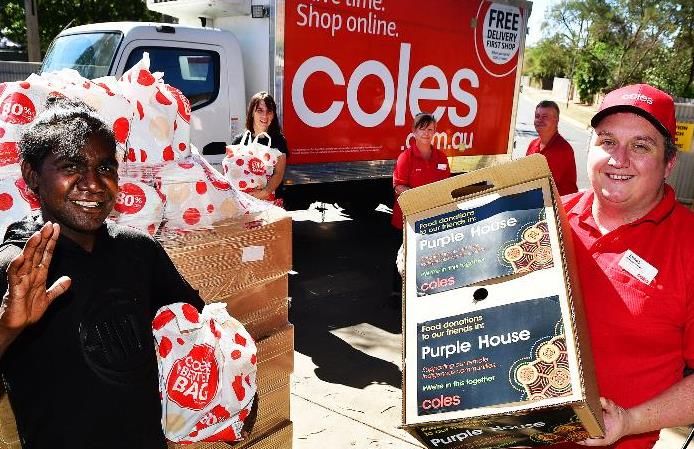
Progress against strategy: Win Together
Improvements in team member engagement (+7pp) and safety scores
(TRIFR reduction of 18.3%)
                                                             ▪   Almost $1 million raised for SecondBite Winter Appeal in just 2
                                                                 weeks
                                                             ▪   $5.2 million raised for FightMND to support research into finding
                                                                 effective treatments and a cure for Motor Neurone Disease
                                                             ▪   >$6 million contributed to rural firefighters and bushfire relief
                                                             ▪   Launched Coles Group Values to guide the day-to-day decisions
                                                                 and actions of all team members, building on the existing LEaD
                                                                 behaviours framework
                                                             ▪   More than 4,700 Aboriginal and Torres Strait Islander people across
                                                                 our stores, store support centres and distribution centres,
                                                                 representing 3.8% of Coles team members
Coles team members present a cheque to Bec Daniher from
FightMND's on behalf of the Coles meat team and Aussie
pork farmers.                                                ▪   Coles named the Most Popular Retail and FMCG Employer in the
                                                                 Top100 Graduate Employers 2020 Awards
                                                             ▪   Entered into five-year agreement to be the official supermarket to
                                                                 the Australian Football League and the AFLW
                                                             ▪   Partnered with Stephanie Alexander’s Kitchen Garden Foundation
                                                                 to promote healthy eating
                                                             ▪   Continued sponsorship of the highly successful MasterChef
                                                             ▪   Announced direct milk sourcing model to SA and WA following the
                                                                 successful roll out in VIC, Southern and Central NSW

Patrick Dangerfield from Geelong's AFL team, Stephanie
Chiocci, captain of Collingwood's AFLW team and Kylie
Rogers, GM Commercial at the AFL after Coles announced its
5 year partnership with the AFL.                                                                                                       8
Progress against strategy: Win Together
Continued to play a significant role to support community and team members through
COVID-19
                                                              ▪   Provided a safe in-store environment for team members and
                                                                  customers through additional sanitiser, cleaning, safety screens,
                                                                  store signage to assist physical distancing and security
                                                              ▪   Ensured Australia’s elderly and most vulnerable together with
                                                                  emergency and healthcare workers were provided better access
                 CHANGE                                           to groceries through Community Hour
                                                              ▪   Launched Coles Online Priority Service and Coles Online Remote
                                                                  Delivery Service
                                                              ▪   Increased total headcount by >5,000 during the year, including
                                                                  uplift in casual team members through COVID-19
A customer shopping during Community Hour at Coles            ▪   Additional food donations to the value of $7.9 million to
Southland, Victoria.                                              SecondBite and Foodbank
                                                              ▪   One-off thankyou payment to store and supply chain team
                                                                  members
                                                              ▪   Double discount on shopping and subsidised flu vaccinations
                                                                  offered to all team members
                                                              ▪   Mental well-being and staying connected packs sent to 110,000
                                                                  team members and their families

Coles Alice Springs team members deliver a food donation to
Purple House, an Indigenous-owned and run health service.

                                                                                                                                      9
Coles’ strategy tracker
KPIs Progress
Reduced safety TRIFR ▪ 18.3% reduction in TRIFR compared to FY19
Increased team member
▪ Improved mysay team engagement score by 7pp
engagement
Improved customer
▪ Customer satisfaction1 improved to 88.2% (Q3: 83.4%)
satisfaction
Sales growth at least in ▪ Supermarkets headline sales revenue growth of 6.8%
line with the market ▪ ABS Total Market Growth of 6.7%2
▪ Supermarket sales density increased by 5.0% YoY to $17,547/sqm
Increased sales density
▪ Liquor sales density increased by 7.6% YoY to $15,438/sqm
▪ In excess of $250m of cost-out achieved driven by streamlining of SSC,
establishment of transport hubs in VIC and NSW, improved labour
$1bn cost-out by FY23 productivity through end-to-end supply chain optimisation, data and
technology-led solutions in store, energy and waste management
reductions and measures to reduce loss in store
▪ Return to full year Group EBIT growth for the first time in four years,
EBIT growth
increasing by 4.7%
Cash realisation3 >100% ▪ Cash realisation of 111% (107% post-AASB 16)
1 Customer satisfaction based on Tell Coles data.
2 Source: ABS Retail Trade Figures, Table 11. Retail Turnover, State by Industry Subgroup, Original. Total Food Retail excl. Li quor (Smkt & Grocery plus Other
Specialised Food Retailing).
3 Cash realisation is calculated as operating cash flow excluding interest and tax, divided by EBITDA (excluding significant it ems). 10The expanded gin and spirits range at the new Liquorland trial concept store in Oakleigh, Victoria. Refreshed Liquor strategy
We have reviewed our business through 4 lenses...
                Our Customers                                               Our Suppliers

▪   Ensure stores are easy to shop, with clear navigation   ▪   Simplify the way we work
    and less clutter
                                                            ▪   Provide clear strategic direction and framework for
▪   Focus on friendliness and team member availability          growth
    and service
                                                            ▪   Build longer term plans and partnerships
▪   Be relevant and offer more craft, local and
    boutique products
                                                            ▪   Respond faster to innovation in new products

▪   Provide competitive prices everyday

                   The Market                                                 Our Business

▪   Overall consumption decline, growth in premium          ▪   A passionate and dedicated team
    and key categories

                                                            ▪   3 distinct formats in convenient locations with
▪   The online channel is becoming increasingly                 potential for growth
    important for customers

▪   Supporting local producers
                                                            ▪   Strong and developing ELB portfolio

                                                            ▪   Largely fixed cost base, now requires investment
                                                                supported by top line growth

                                                            ▪   Headroom for growth in online

                                                                                                                      12
We have now set a strategic framework for growth
Our “Be a simpler, accessible,
Vision locally relevant drinks specialist”
Smarter Inspire Win
Selling Customers Together
6 • Simplify the • Differentiate our • Build capability
Priorities operating model offer & serve our • Engage safely,
• Refocus the customers better responsibly &
business • Be more relevant sustainably
and accessible
3
• Simplify & Refocus • Differentiate • Grow
Horizons
Our
Values
13Our 6 priorities…
Smarter Selling Inspire Customers Win Together
Simplify the operating Differentiate our offer & Build Capability
model serve our customers better
1Refocus the business Be more relevant and accessible Engage safely, responsibly and
sustainably1
Wine
Source Buy Move Sell
region
1Image showing the “BeeSAFE” team member safety pin reflecting the “Be Safe” framework at Coles Liquor. 14Coles has partnered with Stephanie Alexander’s Kitchen Garden Foundation giving thousands of children across Australia access to a food
education program that helps them develop a healthy relationship with food, self-confidence and life skills.
Group financial overviewFY20 results – Group
Group EBIT (pre-AASB 16 and significant items) growth for the first time in four years
Retail basis
$m FY20 FY191 Change
Sales revenue 37,408 35,0012 6.9%
EBIT (post-AASB 16, pre-significant items)3 1,762 N/A N/M
EBIT (pre-AASB 16, pre-significant items)3 1,387 1,325 4.7%
EBIT margin % (pre-AASB 16, pre-significant items)3 3.7% 3.8% (8)bps
Net profit after tax (pre-AASB 16, pre-significant items)3 951 888 7.1%
Basic earnings per share4 (cents) 71.3 66.5 7.1%
Interim dividend per share5 (cents) 30.0 - N/M
Final dividend per share5 (cents) 27.5 24.0 14.6%
Special dividend per share5 (cents) - 11.5 N/M
Total dividend per share5 (cents) 57.5 35.5 N/M
1 Given the existence of a 53rd week in FY19, Coles has opted to disclose retail results for 52 weeks for the purposes of comparability with the current financial period. The
FY19 statutory results are 52 weeks and one day. These financial periods are consistent with the presentation of the FY19 full year results.
2 FY19 retail (non-IFRS) results have been adjusted as follows: (i) fuel sales revenue has been removed as the Group now recognises commission income following
commencement of the New Alliance Agreement in March 2019; and (ii) sales revenue associated with Hotels has been removed to reflect the sale of this business in
April 2019.
3 Retail (non-IFRS) EBIT and NPAT excludes Hotels to reflect the sale of this business in April 2019, and significant items.
4 Basic earnings per share attributable to equity holders of the Company from continuing operations, pre-AASB 16 and significant items.
5 Dividends announced or paid.
N/M denotes not meaningful.
16FY20 results – segment financials
Sales revenue growth across all segments and strong EBIT growth in Supermarkets
Retail basis
$m FY20 FY19 Change
Sales revenue
Supermarkets 32,993 30,890 6.8%
Liquor 3,308 3,063 8.0%
Express 1,107 1,048 5.6%
Group sales revenue 37,408 35,001 6.9%
Statutory AASB 16 Retail Retail Retail
$m FY20 impact FY20 FY19 Change
EBIT
Supermarkets 1,618 (308) 1,310 1,183 10.7%
Liquor 138 (18) 120 120 0.0%
Express 33 (49) (16) 50 N/M
Other¹ (27) - (27) (28) 3.6%
Group EBIT 1,762 (375) 1,387 1,325 4.7%
¹ Includes corporate costs, Coles’ 50% share of flybuys’ net result, the net gain or loss generated by Coles’ property portfo lio and self-insurance provisions.
N/M denotes not meaningful.
17Normalised cash flow
Cash realisation of 111% (pre-AASB 16) driven by strong trading performance
Normalised cash flow¹ Comments
FY20 ▪ Working capital impacted by increased inventories
$m FY20 pre-AASB 16 FY19 offset by an uplift in trade and other payables to
support heightened trading activity during Q4
Statutory EBIT pre- ▪ Higher provisions related to Award covered salaried
significant items
1,762 1,387 1,343
team member review and annual leave provision
with less team members taking entitlements in the
Depreciation and latter part of the year
amortisation
1,495 634 640
▪ Reported FY20 depreciation reflects adoption of
Statutory EBITDA pre- AASB 16
significant items
3,257 2,021 1,982 Cash realisation²
107% 111% 110%
Change in working
capital
60 60 81
Change in provisions
and other
168 159 125
Operating cash flow
(excl. interest and tax)
3,485 2,240 2,188
FY20 post-AASB 16 FY20 pre-AASB 16 FY19
1 FY19 based on statutory reporting, cash flows have been normalised for demerger items relating to self-insurance provisions and intercompany balances.
The proceeds from the sale of the Hotels business in FY19 are not included in the above reconciliation to net cash from opera ting activities as they are
classified as investing cash flow for statutory purposes.
² Cash realisation is calculated as operating cash flow excluding interest and tax, divided by EBITDA (excluding significant items). 18Capital expenditure
Investment in-line with guidance despite COVID-19 impacts
Capital expenditure breakdown Key capital expenditure initiatives
Statutory Store renewals ▪ Store resets across
$m FY20 FY19 Supermarkets store fleet (70)
▪ Liquor Market conversions (30)
Store renewals 161 146
Growth initiatives 151 191 Growth ▪ New stores in Supermarkets (8)
initiatives and Liquor (20)
Efficiency initiatives 275 297 ▪ Convenience offering rollout
to almost150 stores
Maintenance 246 259 Efficiency ▪ Supply Chain Modernisation
initiatives Project
Gross operating capital
833 893 ▪ Investment in reducing and
expenditure
preventing loss
Maintenance ▪ Refrigeration and electrical
Property acquisitions 78 146 ▪ Lifecycle maintenance of
in-store technology
Property divestments (245) (269) Property ▪ FY20 net property inflow of
($167m), in-line with guidance
Net property capital
(167) (123)
expenditure
Net capital expenditure 666 770
19Balance sheet
Investment grade credit metrics with flexibility for future growth
Balance sheet summary Comments
Statutory ▪ Recognition of a net lease liability of $1,423 million
28 June 2020 following the adoption of AASB 16 which also
$m post-AASB 16 30 Jun 2019 largely drove the movement in net tax balances
▪ Net debt of $362m and balance sheet leverage
Inventories 2,166 1,965
ratio of 0.4x¹
Trade and other receivables 434 360 ▪ Gross debt of $1.4bn due to change in debt profile
with $700m of external debt repaid and converted
Trade and other payables (3,737) (3,380) into a longer dated $600m bond issuance with
favourable coupon
Working capital (1,137) (1,055)
▪ Increase in inventory and trade payable days
PP&E and equity investments 4,344 4,331 reflects change to the recognition of duties and
taxes on tobacco, and the exclusion of fuel
Intangibles 1,597 1,541 inventory and payables
Other (1,295) (1,304) Inventory and trade payable days
Capital employed 3,509 3,512 33
29
Right-of-use assets 7,660 - 27
25
Lease liabilities (9,083) -
Lease balances (1,423) -
Net debt (362) (520)
Net tax balances 891 365
Inventory days Trade payable days
Total net assets 2,615 3,357
FY20 FY19
1 Calculated as gross debt less cash at bank and on deposit ($902m), divided by EBITDA (pre-
20
AASB 16) for the 12 months ended 28 June 2020 pre-significant items ($2,021m).Capital management
Attractive fully-franked dividend and lengthened debt maturity profile at
favourable rates
Debt facility maturity profile ($m)
Dividend
▪ Fully-franked FY20 final dividend of 27.5 cents per
share
▪ Total FY20 dividends of 57.5 cents per share
500
1,005
Funding and liquidity
▪ Weighted average drawn down debt maturity
of 5.6 years provides funding stability 677
‒ Undrawn facilities of $2.2bn, providing 610
appropriate headroom
285 300 300
‒ Cash at bank and on deposit of $452m 150
73 1
▪ Coles issued $300m seven-year and $300m FY20 FY21 FY22 FY23 FY24 FY25 FY26 FY27 FY28 FY29 FY30
10-year senior unsecured fixed-rate medium- Drawn Undrawn
term notes in October
Leverage ratio
▪ Coles is committed to diversifying funding
sources and extending the debt maturity profile
over time 3.1x2
Credit ratings
▪ Coles is committed to solid investment grade
credit ratings with S&P and Moody’s
0.5x 0.4x
1 Includes bank guarantees.
2 Leverage ratio post-AASB 16, calculated as Net financial debt ($902m), add
FY19 FY20
lease liabilities ($9,083m), divided by EBITDA (post-AASB 16) $3,258m.
21The recently opened Coles Local in Hawthorn, Victoria.
SupermarketsSupermarkets key metrics
51 consecutive quarters of comparable sales growth
Total sales revenue Comp sales growth1 Sales per sqm
$33.0bn 5.9% $17,547
+6.8% vs. pcp vs. pcp +5.0% vs. pcp
Own Brand sales Coles Online sales Customer satisfaction
+9.7% +18.1% 88.2% (4Q20)
vs. pcp vs. pcp +4.8pp on 3Q20
Gross margin EBIT EBIT margin
25.1% $1,310m 4.0%
+30bps vs. pcp +10.7% vs. pcp +14bps vs. pcp
1 To better align the timing of comparable sales between the FY20 and FY19 financial periods, FY19 is based on 2 July 2018 to 30 June 2019. 23Supermarkets FY20 results
Second half of improving profitability
FY20 results Key commentary
Retail basis ▪ Sales trajectory improving prior to Christmas and in the
early part of Q3, prior to COVID-19
$m FY20 FY19 Change
Key P&L items
▪ In addition to the sales uplift from COVID-19,
comparable sales growth of 5.9% was driven by trusted
Sales revenue 32,993 30,890 6.8% value campaigns, extensive range reviews and Coles’
tailored format strategy
EBITDA 1,879 1,735 8.3% ▪ Basket size grew strongly for the year, partially offset by
EBIT
lower transaction growth
1,310 1,183 10.7%
▪ Online sales grew by 18.1% for the year following the
temporary suspension of services during March and April
Key metrics ▪ Inflation ex tobacco and fresh of 1.5% driven by cost
Comparable sales growth (%) 5.9 2.7 320bps inflation, lower product availability and mix impacts
Gross margin (%) 25.1 24.8 30bps ▪ Gross margin increased by 30bps driven by favourable
mix, strategic sourcing benefits and a more efficient
CODB (%) (21.1) (20.9) (16)bps supply chain
EBIT margin (%) 4.0 3.8 14bps ▪ CODB increased by 16bps driven by higher store
expenses partially offset by Smarter Selling initiatives
Sales per square metre ($/m 2) 17,547 16,704 5.0%
▪ EBIT also includes a $16 million charge as a result of the
Price inflation (%) 2.4 0.8 154bps Award covered salaried team member review
Price in/(de)flation excl. ▪ Coles expects to incur incremental operating
1.5 (1.2) 265bps
tobacco and fresh (%) expenditure in FY22 and FY23 for the Witron and Ocado
projects. This operating expenditure relates to project
implementation costs, and in FY23, includes double-
running costs. In FY22, Coles expects these costs to
be up to $75 million
24A selection of local Mornington Peninsula wines at Liquorland, Oakleigh. Liquor
Liquor key metrics
    Sales growth driven by strong performance across all three banners

       Total sales revenue                                     Comp sales growth¹                                                Online sales

                                $3.3bn                                                    7.3%                                                   +40.3%
                            +8.0% vs. pcp                                               vs. pcp                                                   vs. pcp

            Award winning                                            FCLM renewals                                          Number of stores
               quality
                                                                                         61%                                                       910
                    372                                                                                                                         No change
                                                                                    of the fleet
                      ELB medals and
                                                                                     renewed                                                     vs. FY19
                          awards

              Gross margin                                                       EBIT                                             EBIT margin

                                 21.6%                                                   $120m                                                    3.6%
                          (72)bps vs. pcp                                             0.0% vs. pcp                                          (28)bps vs. pcp

     Note: The above data does not include the financial performance of Coles’ Hotels business, which was subject to the transacti on with Australian Venue Co
     that completed in April 2019.
1   To better align the timing of comparable sales between the FY20 and FY19 financial periods, FY19 is based on 2 July 2018 to 30 June 2019.                    26
Liquor FY20 results
EBIT in-line with last year with higher sales volume offset by margin pressure from
mix and ongoing clearance activity associated with range changes
FY20 results Key commentary
Retail basis
▪ The new leadership team have completed a
$m FY20 FY19 Change review of operations and reset the Liquor
Key P&L items strategic framework to become a simpler,
more accessible, locally relevant local drinks
Sales revenue 3,308 3,063 8.0% specialist
EBITDA 149 153 (2.6)% ▪ Targeted investment in online platforms across
all three banners supported strong online sales
growth of 40.3% for the year
EBIT 120 120 0.0%
▪ Continued the successful roll out of First
Choice Liquor Market with 61% of the fleet
Key metrics renewed
Comparable sales growth (%) 7.3 1.2 610bps ▪ Changes in mix during COVID-19 and ongoing
clearance costs associated with range
Gross margin (%) 21.6 22.3 (72)bps change impacted gross margin and EBIT
CODB (%) (17.9) (18.4) 44bps ▪ EBIT also includes a $4 million charge as a
result of the Award covered salaried team
EBIT margin (%) 3.6 3.9 (28)bps member review
Note: The above table does not include the financial performance of Coles’
Hotels business, which was subject to the transaction with Australian Venue Co
that completed in April 2019.
27Coles Express supporting the Rural Fire Service fuel replenishment during the Summer bushfires in Moss Vale, New South Wales. Express
Express key metrics
C-store sales growth driven by pantry stocking and strong basket size growth in
the latter part of the year. EBIT impacted by lower fuel volumes

     Total sales revenue1                                    C-store comp sales                                                       EBIT
                                                                   growth2
                                                                                                                                            ($16)m
                             $1,107m                                                    4.6%                                           following material
                          +5.6% vs. pcp                                                vs. pcp                                           decline in fuel
                                                                                                                                            volumes

         FY20 weekly fuel                                     Comp fuel volume                                           Number of sites
             volumes                                              growth
                          59.5mL/wk                                                 (2.5)%                                                      713
                          (2.3)% vs. pcp                                            vs. pcp                                                 -1 vs. FY19

1   Fuel sales have been excluded as Express no longer records fuel sales as sales revenue under the New Alliance Agreement with Viva Energy.
2   To better align the timing of comparable sales between the FY20 and FY19 financial periods, FY19 is based on 2 July 2018 to 30 June 2019.
                                                                                                                                                            29
Express FY20 results
Average weekly fuel volumes showed an improving trajectory throughout the
fourth quarter
FY20 results Key commentary
Retail basis
▪ Comparable c-store sales growth of 4.6%
$m FY20 FY19 Change driven by COVID-19 related pantry stocking
Key P&L items and strong basket size growth in the latter part
of the year
C-store sale revenue1 1,107 1,048 5.6%
▪ Invested in the customer offer, commencing
EBITDA 12 76 (84.2)% network wide roll out of new self-service
coffee machines in Q4
EBIT (16) 50 (132.0)%
▪ Average weekly fuel volumes of 59.5mL were
recorded in the year, prior to COVID-19 fuel
Key metrics volumes were trending positively
Comp c-store sales growth (%) 4.6 0.1 450bps ▪ CODB decreased by 153bps as a result of cost
control and efficiency measures
Weekly fuel volumes (mL) 59.5 60.9 (2.3)%
▪ Express recorded an EBIT loss for the full year of
Fuel volume growth (%) (2.3) (13.0) N/M $16m as a result of a material decline in fuel
volumes and in part c-store margin
Comp fuel volume growth (%) (2.5) (13.7) N/M
deterioration as customers shifted towards
top-up and non-food categories
Gross margin (%) 53.7 61.4 N/M1
CODB (%) (55.2) (56.7) 153bps
EBIT margin (%) (1.5) 4.7 N/M1
1 FY19sales exclude fuel sales and has been restated for flybuys. However, the
change in gross margin and EBIT margin may not be meaningful (‘N/M’) as
the fuel margin model has changed under the New Alliance Agreement
during FY19.
30The first Coles Local store outside Victoria was recently opened in Rose Bay, New South Wales. Outlook
Outlook for FY21
▪   In the first 6 weeks of 1QFY21, Supermarkets comparable sales remain broadly in-line with the levels
    achieved in the second half. In Online, following the significant increase of capacity in the second half,
    sales are up approximately 60% in the first 6 weeks of FY21, driven by Victoria
▪   Coles has continued to incur significant incremental COVID-19 costs in the early part of FY21. Given these
    incremental costs, Supermarkets is achieving an EBIT margin consistent with the FY20 full year. The extent
    and duration of these incremental costs will depend upon a number of factors as we continue to
    proactively manage the unfolding COVID-19 situation
▪   In Liquor, sales have remained elevated with any moderation of sales growth dependent on social
    distancing restrictions for hotels, pubs, clubs and licensed venue operators. Aside from incremental COVID-
    19 costs, Liquor also expects to step-up its investment in customer service in the coming 12 months as it
    implements its new strategy
▪   In Express, average weekly fuel volumes in the early part of the first quarter are broadly in-line with the June
    exit rate, with significant variation between states
▪   In Other, FY21 corporate costs are also expected to be slightly above FY20 recurring corporate costs driven
    by a market-wide increase in insurance costs, while net earnings from property operations are expected to
    be more modest than FY20 and weighted toward the first half due to lower anticipated disposal activity.
    Coles’ 50% share of flybuys’ net result is also expected to be broadly in-line with FY20
▪   Coles retains its $1 billion cost-out target to be achieved between FY20 and FY23. In FY21, Coles will
    continue to focus on realising cost-out opportunities however, the timing will be dictated, in part, by COVID-
    19
▪   Coles’ optimised store network and formats is already transforming the make-up and performance of our
    extensive store network with plans to renew approximately 65 stores and to open in the range of 15 to 20
    new stores in FY21, including five stores that were delayed in FY20 due to COVID-19
▪   Gross operating capital expenditure is expected to be approximately $1 billion and includes increased
    investment on the Witron ambient automated distribution centres as the project enters its third year. In
    addition, Coles also expects net property capex to be approximately +/- $100 million in FY21

                                                                                                                       32
The Hemphill family dairy farm in Kyabram, Victoria supplies milk to Coles under our direct milk sourcing model. Coles is bui lding long-term relationships with dairy farmers by extending the model to SA and WA following the successful roll out in VIC, Southern and Central NSW. Q&A
APPENDIX: Impact of AASB 16
Impact of new lease accounting standard AASB 16

Balance Sheet             1-Jul-19   28-Jun-20   Income Statement (FY20 impact)

Right-of-use assets   ↑   $7.5bn      $7.7bn     EBITDA                     ↑     $1,236m

Lease liabilities     ↑   $8.9bn      $9.1bn     Depreciation               ↑     $861m

Provisions1           ↓   $188m          -       EBIT                       ↑     $375m

Deferred tax assets   ↑   $356m       $365m      Finance costs              ↓     $(399)m

Retained earnings     ↓   $831m          -       Profit/(loss) before tax   ↓     $(24)m

                                                 Profit/(loss) after tax    ↓     $(17)m

                                                                                            34
You can also read