Comparison of C:N:P Stoichiometry in the Plant-Litter-Soil System Between Poplar and Elm Plantations in the Horqin Sandy Land, China
←
→
Page content transcription
If your browser does not render page correctly, please read the page content below
ORIGINAL RESEARCH
                                                                                                                                               published: 26 April 2021
                                                                                                                                        doi: 10.3389/fpls.2021.655517

                                             Comparison of C:N:P Stoichiometry
                                             in the Plant–Litter–Soil System
                                             Between Poplar and Elm Plantations
                                             in the Horqin Sandy Land, China
                                             Kai Wang 1* , Risheng Zhang 2 , Lining Song 3 , Tao Yan 4 and Enhang Na 1
                                             1
                                              College of Environmental Sciences and Engineering, Liaoning Technical University, Fuxin, China, 2 Liaoning Institute
                                             of Sandy Land Control and Utilization, Fuxin, China, 3 Institute of Applied Ecology, Chinese Academy of Sciences, Shenyang,
                                             China, 4 College of Pastoral Agriculture Science and Technology, Lanzhou University, Lanzhou, China

                                             Afforestation is among the most effective means of preventing and controlling
                                             desertification. Silver poplar (Populus alba) is commonly planted tree species for
                          Edited by:         afforestation of the Horqin Sandy Land of China. However, this species has exhibited
                          Iván Prieto,       some drawbacks such as top shoot dieback, premature senescence and mortality,
  Center for Edaphology and Applied
  Biology of Segura, Spanish National
                                             and soil and ecosystems degradation. In contrast, Siberian elm (Ulmus pumila) rarely
              Research Council, Spain        experiences these problems in the same regions. Ecological stoichiometry plays a vital
                      Reviewed by:           role in exploring ecological processes and nutrient cycle relationships in plant–litter–soil
                           Yuqiang Li,
                                             systems. To explore the differences in the carbon (C), nitrogen (N), and phosphorus (P)
                  Northwest Institute
  of Eco-Environment and Resources,          balance, the stoichiometry characteristics and stoichiometric homeostasis in elm and
Chinese Academy of Sciences (CAS),           poplar plantations in the Horqin Sandy Land, we measured C, N, and P concentrations
                                China
                       Julien Fortier,
                                             in leaves, branches, roots, litter, and soils and analyzed N and P resorption efficiencies
Fiducie de Recherche sur la Forêt des        in the two plantations. The results showed that soil C and N concentrations, C:P, and
            Cantons-de-l0 Est, Canada
                                             N:P were greater in the elm plantation than in the poplar plantation. The leaf and root
                *Correspondence:
                                             C:P and N:P during summer and litter N and P concentrations were greater, whereas
                        Kai Wang
         wangkai_2005@hotmail.com            N and P resorption efficiencies were lower, in the elm plantation than in the poplar
                                             plantation. Generally, elm exhibited greater N:P homeostasis than poplar. N and N:P
                   Specialty section:
                                             homeostasis were greater in roots than in leaves and branches in the elm plantation,
         This article was submitted to
             Functional Plant Ecology,       but they varied with soil N concentration and N:P in the poplar plantation. These
               a section of the journal      findings indicate that poplar exhibited more developed internal nutrient conservation
            Frontiers in Plant Science
                                             and allocation strategies but poor nutrient accumulation in soil, which may contribute
         Received: 19 January 2021
           Accepted: 06 April 2021           to degradation of poplar plantation. In contrast, elm tended to return more nutrients to
           Published: 26 April 2021          the soil, showing an improved nutrient cycle in the plant–litter–soil system and increased
                             Citation:       soil C and N accumulation in the elm plantation. Therefore, compared with poplar, elm
    Wang K, Zhang R, Song L, Yan T
                                             may be a more suitable afforestation tree species for the Horqin Sandy Land, in terms
and Na E (2021) Comparison of C:N:P
 Stoichiometry in the Plant–Litter–Soil      of promoting the accumulation of soil nutrients and enhancing nutrient cycling in the
     System Between Poplar and Elm           plant–litter–soil system.
Plantations in the Horqin Sandy Land,
  China. Front. Plant Sci. 12:655517.        Keywords: desertified region, forest decline, plant–litter–soil system, stoichiometric homeostasis, tree species
      doi: 10.3389/fpls.2021.655517          selection for afforestation

Frontiers in Plant Science | www.frontiersin.org                                    1                                            April 2021 | Volume 12 | Article 655517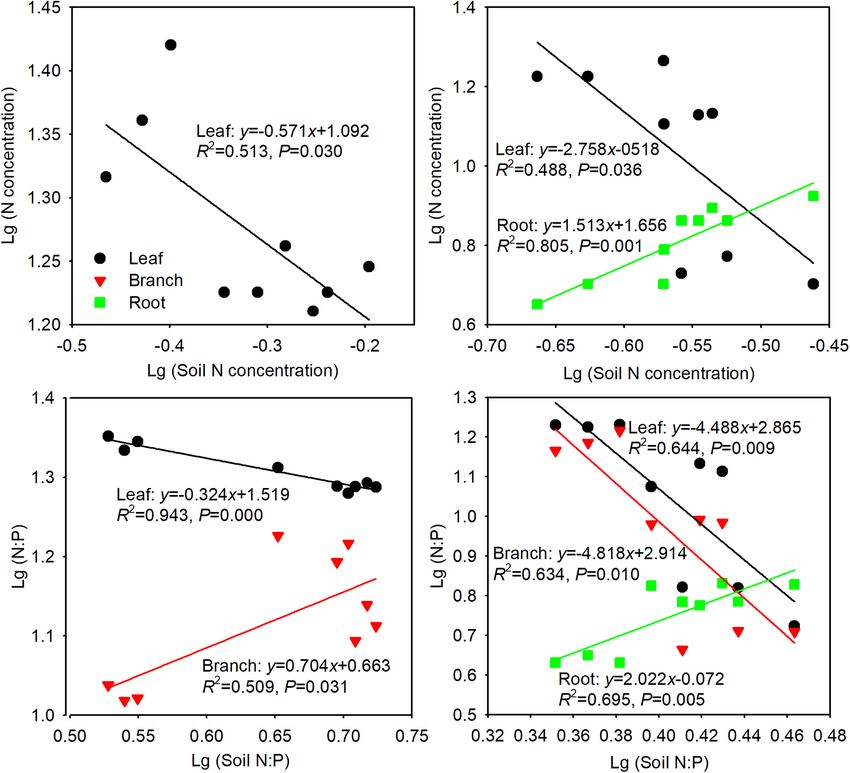
Wang et al.                                                                                                      Comparison Between Poplar and Elm

INTRODUCTION                                                                highly complex in plant–litter–soil systems (Manzoni et al., 2008;
                                                                            Yang et al., 2019).
Desertification is a serious global environmental problem, with                 Ecological stoichiometry, which is used to evaluate the
substantial effects on the survival and development of some plant           balances of energy and chemical elements in ecosystems, is
and animal species, human wellbeing and society, and ecosystem              a powerful tool for understanding ecological processes and
stability maintenance (Sterk et al., 2016; Capozzi et al., 2018).           relationships among element cycles in plant–litter–soil systems
The Horqin Sandy Land (42◦ 410 –45◦ 150 N, 118◦ 350 –123◦ 300 E)            (Elser et al., 2010). Plant C:N:P stoichiometry reflects the
is among the most seriously desertified and ecologically fragile            efficiency of plants nutrient use (Niklas and Cobb, 2005) and
regions in China’s agro-pastoral ecotone; originally a prairie,             can be used to determine nutrient limitations for growth
this sandy land developed due to climate change and human                   (Koerselman and Meuleman, 1996). Soil C:N:P stoichiometry
disturbances such as overgrazing, non-manure cropping, and                  reflects soil fertility and nutrient availability and regulates plant
arbitrary land use and management (Zeng and Jiang, 2006).                   growth and the nutrient state (Bui and Henderson, 2013).
During the desertification process, an estimated 90% of carbon              Stoichiometric homeostasis, a central concept of ecological
(C) and 86% of nitrogen (N) were lost from the ecosystem (Li                stoichiometry, is defined as the ability of plants to maintain a
et al., 2006). To combat and control desertification, afforestation         relatively stable nutrient composition, regardless of soil nutrients
programs have been launched since the 1970s, including the                  changes (Sterner and Elser, 2002). Higher stoichiometric
Three-North Shelterbelt Program, the Grain for Green Project                homeostasis in plants contributes to sustaining the functions and
and the Conversion of Cropland to Forest and Grassland                      stability of the ecosystem (Yu et al., 2010). When soil nutrients
Program (Wang, 2014; Bai et al., 2019; Chu et al., 2019).                   limit plant growth, plants can respond via multiple physiological
    These afforestation programs selected tree species with                 mechanisms to improve the internal availability and use efficiency
drought tolerance, rapid growth, and high timber production                 of the limiting nutrient, thereby maintaining stability and its
traits (Song et al., 2020). Silver poplar (Populus alba) is among           associated functions in the body at the limited nutrient level
the most common afforestation tree species due to its relatively            (Hessen et al., 2004). These mechanisms of nutrient conservation
high initial growth and seedling survival rates (Lindroth and               in plants include excreting hydrogen ions or enzymes into the
Clair, 2013), and it has been planted as a monoculture in large             soil (Yuan et al., 2019), altering the allocation of photosynthetic
areas for wind speed reduction, sand fixation, and soil and water           products and nutrients among different organs (Peng et al.,
conservation (Zhao et al., 2008; Ahmed et al., 2020). However,              2016), and remobilizing nutrients from senescent to other organs
these large-scale poplar plantations have many drawbacks                    before senescence (i.e., nutrient resorption) (Kobe et al., 2005;
including top shoot dieback, tree premature senescence and                  Wang et al., 2020). Therefore, evaluating C:N:P stoichiometry
mortality, and soil and ecosystem degradation (Wang et al., 2017;           and stoichiometric homeostasis in a plant–litter–soil system
Zhou et al., 2020). In contrast, Siberian elm (Ulmus pumila)                could improve our understanding of plant adaptive mechanisms,
rarely exhibits these problems in either natural or plantation              nutrient cycles and ecosystem stability.
forests in the same regions (Zhao et al., 2010). Nevertheless, elm              In this study, we examined seasonal variations in C, N, and P
is seldom planted for afforestation in the sandy land due to its            concentrations and their ratios in the leaves, branches, roots, and
slow growth rate and production of crooked trunks, which limit              soils of poplar and elm trees in plantations in the Horqin Sandy
its economic value (Wang et al., 2017). Vegetation conversions              Land, China, throughout the growing season. We quantified C,
after afforestation often involve tremendous changes in plant and           N, and P stoichiometry in leaf litter and analyzed the nutrient
soil nutrient concentrations, biomass production, soil quality,             resorption efficiency (NuRE) and stoichiometric homeostasis of
and nutrient cycling processes, which profoundly influence the              both tree species. One objective of this study was to determine
stability and sustainable development of ecosystems (Zhao et al.,           whether the soil C, N, and P concentrations are lower in the
2008; Liu et al., 2018; Luo et al., 2020). Therefore, it is necessary       poplar plantation than in the elm plantation, since poplar has a
to explore the differences in plant and soil nutrients and their            higher growth rate and greater biomass (Zhao et al., 2010) and
interactions between poplar and elm plantations to determine                therefore is expected to consume more nutrients than elm. We
which is more suitable for afforestation.                                   also aimed to determine whether poplar has lower plant N and
    C, N and phosphorus (P) are major macroelements necessary               P concentrations than those of elm, due to N and P dilution in
for life; their cycling in plant–litter–soil systems has substantial        response to higher poplar growth rates (Zhao et al., 2010), and
effects on the function and stability of ecosystems (Mulder                 whether elm, a native tree species, exhibits greater stoichiometric
and Elser, 2009). Soil C, N, and P greatly affect plant growth              homeostasis than does poplar, an exotic tree species, since native
and development and are simultaneously affected by organic                  tree species tend to adapt better than exotic species in local
matter, litter, and microbes (Sinsabaugh et al., 2008). Litter stores       environments (Song et al., 2020).
nutrients and returns them to soil; these processes are restricted
by nutrient resorption, which contributes to optimal nutrient
use efficiency by plants (Deng et al., 2019). Plants adjust their           MATERIALS AND METHODS
growth rates by coordinating the ratios of C, N, and P and
allocating nutrients among different organs to adapt to soil                Study Site
nutrient conditions (Daufresne and Loreau, 2001; Fang et al.,               This study was conducted at the Zhanggutai Experimental Base
2019). Thus, the balances and interactions of C, N, and P are               of Liaoning Institute of Sandy Land Control and Utilization,

Frontiers in Plant Science | www.frontiersin.org                        2                                       April 2021 | Volume 12 | Article 655517
Wang et al. Comparison Between Poplar and Elm FIGURE 1 | Location of the study area (A) and photos of the Siberian elm (B) and Silver poplar (C) plantations. Liaoning Province, China (42◦ 320 –42◦ 510 N, 121◦ 530 –122◦ 350 E; Experimental Design average elevation, 226 m), which is located in the southeastern In 2017, three plots were selected among pure elm and poplar region of the Horqin Sandy Land, China. This region has plantations, respectively on the Zhanggutai Experimental Base a semiarid climate, with a mean annual precipitation of (Figure 1). These plots had similar site conditions and history 474 mm, largely during June–August, and mean annual potential and land management prior to afforestation. The plantations evaporation of approximately 1,580 mm (Song et al., 2020). were established from non-vegetated sandy lands, and previous The mean annual temperature is approximately 6.8◦ C, with studies at the study region have shown that soil properties were minimum and maximum mean temperatures of −29.5 in homogeneous and similar in the non-vegetated sandy lands (Jiao, January and 37.2◦ C in July, respectively. The zonal soil in 1989; Zeng et al., 2009; Zhao et al., 2010). Based on investigation this region is classified in the Semiaripsamment taxonomic in the study region prior to afforestation, the distributions group, which develops from sandy parent material through of soil nutrients were homogeneous and the C, N, and P wind; the distributions of soil salinity, texture, and structures concentrations were 3.15, 0.24, and 0.09 g kg−1 , respectively. were homogeneous (Zhu et al., 2008). The main vegetation Thus, we considered that the initial soil properties were similar type is psammophytes, which are typical Inner Mongolia flora. prior to afforestation, and the differences in soil C, N, and P The Zhanggutai Experimental Base was established in 1978; stoichiometry after afforestation were induced by the different it covers an area of 2,620 hm2 and is characterized by flat, tree species plantations. All the selected plantations were planted stable sand dunes and large Pinus sylvestris var. mongolica and on flat topography, and shared the same soil type (arenosols) and P. alba plantations, interspersed with small patches of degraded similar elevation (Table 1). All plots were within 10 km to ensure grassland and U. pumila and Pinus tabulaeformis plantations. similar soil type and climatic condition. The selected trees were Frontiers in Plant Science | www.frontiersin.org 3 April 2021 | Volume 12 | Article 655517
Wang et al. Comparison Between Poplar and Elm
approximately 20 years old and therefore suitably represented
Sand (50–2,000
85.66 ± 2.24
83.54 ± 1.34
82.08 ± 2.00
93.76 ± 1.49
91.79 ± 1.20
89.68 ± 1.08
the effects of plant and soil interactions on nutrients following
Soil particle-size distribution (%)
µm)
afforestation (Zhao et al., 2010). No management techniques such
as fertilization, pruning, or thinning were conducted in any of the
plots. Three replicate subplots (20 m × 20 m) were established
within each plot.
11.31 ± 2.06
13.52 ± 1.49
14.71 ± 2.16
5.08 ± 1.41
6.65 ± 1.06
8.50 ± 1.13
Silt (2–50
Within each subplot, three healthy individuals with average
µm) diameter at breast height were randomly selected for plant sample
collection. Leaf, branch, root, and soil samples were collected
3.03 ± 0.21 in mid-May, July, and September (i.e., spring, summer, and
2.94 ± 0.15
3.21 ± 0.16
1.16 ± 0.08
1.56 ± 0.15
1.82 ± 0.20
Clay (0–2
autumn). From each selected tree, we collected three branches
µm)
from the upper, middle, and lower parts of the crown, and we
sampled branches of similar diameter (approximately 5 mm)
for each tree species during the different seasons. We selected
content (%)
8.63 ± 0.1 8
7.68 ± 0.09
7.79 ± 0.66
6.43 ± 0.19
6.50 ± 0.26
6.81 ± 0.07
Soil water
mature leaves without diseases and/or insect pests as leaf samples.
The fine roots (Wang et al. Comparison Between Poplar and Elm
specifically the dry mass ratio of litter leaves and mature leaves (Figure 2). Soil N:P tended to increase in the elm plantation but
(van Heerwaarden et al., 2003). remained stable in the 0–20 and 20–40 cm soil layers in the poplar
Using the nutrient stoichiometry of plant organs and soils, plantation during the growing season; soil N:P was higher in the
the homeostatic regulation coefficient (H) was derived from the elm plantation than in the poplar plantation (Figure 2).
following model (Sterner and Elser, 2002):
1 Plant C, N, and P Stoichiometry and
y=c+ × log x (2)
H Nutrient Resorption
Tree species did not have a significant effect on C concentrations
where y is the N or P concentration or N:P for leaves, branches,
in all three organs, although sampling time had a significant
and roots; x is the corresponding value in the soil layer; and
c is a constant. If the regression relationship is not significant effect, with an initial decreasing and subsequent increasing trend
(P > 0.05), then 1/H is set at zero, and the organism is considered (Figure 3). N concentrations decreased in leaves but increased
strictly homeostatic. If the regression relationship is significant and then decreased in branches and roots among elm samples
(P < 0.05), then species with | 1/H| ≥ 1 are considered not to during the growing season, whereas they increased and then
be homeostatic, where those with 0 < | 1/H| < 1 are classified decreased in poplar leaves and branches but showed the opposite
as follows: 0 < | 1/H| < 0.25, homeostatic; 0.25 < | 1/H| < 0.5, trend in poplar roots. N concentrations in leaves during spring
weakly homeostatic; 0.5 < | 1/H| < 0.75, weakly plastic; or | 1/H| and autumn, branches during autumn, and roots during spring
> 0.75, plastic (Persson et al., 2010; Bai et al., 2019). and summer were higher in elm than in poplar (Figure 3). P
concentrations tended to decrease in the leaves, branches, and
roots of elm and in the leaves and branches of poplar, whereas
Statistical Analyses
they increased in poplar roots during the growing season.
For all datasets, Kolmogorov–Smirnov and Levene’s tests were
Leaf and branch P concentrations during summer and root P
conducted to test the normality and homogeneity of variances
concentrations were higher in poplar than in elm (Figure 3).
before statistical analysis. Two-way ANOVAs were used to test
In elm samples, C:N ratio increased in leaves, whereas in
the effects of tree species and sampling time on C, N, and P
branches and roots, it initially decreased and then increased
concentrations and C:N, C:P, and N:P for each soil layer and
during the growing season; in poplar samples, C:N ratio initially
tree organ. Duncan’s test was conducted for post hoc multiple
decreased and then increased in leaves and branches but showed
comparisons. Nutrient stoichiometry of soil, plant, and leaf
the opposite trend in roots. Leaf and branch C:N ratio were
litter, as well as the NuRE, were compared between elm and
lower whereas root C:N ratio were higher in elm than in poplar
poplar using the two-sample t-tests. All figures were prepared
during autumn (Figure 3). C:P showed an upward trend in all
using SigmaPlot 10.0 software, and all data were analyzed
three organs of both elm and poplar samples over time, with
using SPSS 16.0 software for Windows (SPSS Inc., Chicago, IL,
the exception of poplar roots, in which it decreased and then
United States). Significance was evaluated at a level of 0.05.
increased. Leaf C:P during summer and root C:P during summer
and autumn were higher in elm than in poplar (Figure 3). N:P
RESULTS decreased in leaves but initially increased and then decreased
in branches and roots in elm samples over time, while it
Soil C, N, and P Stoichiometry increased and then decreased in leaves but showed the opposite
Soil C concentrations showed an upward trend during the trend in roots in poplar samples over time. Tree species had
growing season and were higher in the elm plantation than in a significant effect on N:P, with higher in elm than in poplar
the poplar plantation (Figure 2). Soil N concentrations tended except for branches during spring and summer and roots during
to increase in the elm plantation but remained unchanged in autumn (Figure 3).
the 0–20 and 20–40 cm soil layers in the poplar plantation over Leaf litter N and P concentrations were significantly higher,
time; soil N concentrations were higher in the elm plantation but C:N and C:P were lower, in the elm plantation than in the
than in the poplar plantation (Figure 2). Soil P concentrations poplar plantation, and no significant differences were found in
tended to decrease and then increase in the 0–20 and 40–60 cm C concentrations or N:P between the two plantations (Table 2).
soil layers but remained unchanged in the 20–40 cm soil layer in N and P resorption efficiencies were significantly greater in the
both the elm and poplar plantations over time, and no significant poplar plantation than in the elm plantation (Figure 4).
differences were found between plantations (Figure 2).
Soil C:N ratio in the 0–20 and 40–60 cm soil layers showed Stoichiometric Homeostasis
a downward trend but decreased and then increased in the 20– We detected the degree of stoichiometric homeostasis of N,
40 cm soil layer in the elm plantation over time, while it showed P, and N:P in leaves, branches, and roots of elm and poplar,
an upward trend in the 0–20 cm soil layer but initially decreased only significant relationships were shown in Figure 5. We
and then increased in the 20–40 and 40–60 cm soil layers in the found strict N concentration homeostasis in elm branches
poplar plantation over time. Higher soil C:N in the elm plantation and roots (P > 0.05) and weak plasticity in elm leaves.
than in the poplar plantation was found in spring (Figure 2). However, N concentrations were not homeostatic in poplar
Generally, soil C:P showed an upward trend over time and leaves or roots and were strictly homeostatic in poplar branches
was greater in the elm plantation than in the poplar plantation (P > 0.05) (Table 3). No significant relationships were found
Frontiers in Plant Science | www.frontiersin.org 5 April 2021 | Volume 12 | Article 655517Wang et al. Comparison Between Poplar and Elm FIGURE 2 | Differences in soil C, N, and P concentrations and C:N, C:P, and N:P across the growing season between Siberian elm and Silver poplar plantations (n = 3). in P concentrations between soil and organs (P > 0.05), thus P leaves, branches, and roots, respectively, whereas N:P was not concentrations were strictly homeostatic in the leaves, branches, homeostatic in poplar leaves, branches, or roots, decreasing and roots of both tree species (Table 3). N:P was weakly in leaves and branches and increasing in roots as soil N:P homeostatic, weakly plastic, and strictly homeostatic in elm increased (Table 3). Frontiers in Plant Science | www.frontiersin.org 6 April 2021 | Volume 12 | Article 655517
Wang et al.                                                                                                                   Comparison Between Poplar and Elm

  FIGURE 3 | Differences in organ C, N, and P concentrations and C:N, C:P, and N:P across the growing season between Siberian elm and Silver poplar plantations
  (n = 3).

TABLE 2 | The C, N, and P concentrations and their ratios in leaf litter of elm and poplar plantations.

Tree species                C (g kg−1 )                N (g kg−1 )              P (g kg−1 )                   C:N                C:P                      N:P

Siberian elm              449.54 ± 10.48              4.79 ± 0.20*             0.51 ± 0.02*               93.94 ± 1.83*    883.35 ± 14.56*            9.40 ± 0.03
Silver poplar             419.39 ± 13.56              3.84 ± 0.16              0.41 ± 0.01                109.30 ± 1.23    1,034.27 ± 8.93            9.47 ± 0.16

*Indicate significant differences between the tree species at P < 0.05.

Frontiers in Plant Science | www.frontiersin.org                                     7                                      April 2021 | Volume 12 | Article 655517
Wang et al.                                                                                                              Comparison Between Poplar and Elm

                                                                                     leaves and branches compared with elm during summer. These
                                                                                     findings indicated more nutrients were absorbed, assimilated,
                                                                                     and sequestrated by poplar, which may contribute to lower soil
                                                                                     C and N concentrations in the poplar plantation than in the
                                                                                     elm plantation. Additionally, our elm plantation samples had
                                                                                     higher N and P concentrations and lower C:N and C:P in
                                                                                     leaf litter (Table 2) and lower N and P resorption efficiencies
                                                                                     in leaves (Figure 4) compared with poplar samples, indicating
                                                                                     the return of high-quality litter to soil, which accelerated
                                                                                     litter decomposition and nutrient mineralization in the elm
                                                                                     plantation. Afforestation not only affects soil nutrients but also
                                                                                     affects soil texture. Soil granulometric composition significantly
                                                                                     correlated with soil nutrient concentrations on the sandy land
                                                                                     after afforestation (Deng et al., 2017), thus, more soil clay and
                                                                                     silt contents (Table 1) maybe one of the reasons for higher
                                                                                     soil C and N concentrations in the elm plantation (Deng
                                                                                     et al., 2017). However, there was no significant difference in
  FIGURE 4 | N and P resorption efficiencies of Siberian elm and Silver poplar       soil P concentrations between the poplar and elm plantations
  (n = 3).
                                                                                     (Figure 2), which was inconsistent with predictions, perhaps due
                                                                                     to the differences in soil P sources and transformation processes
                                                                                     compared with soil C and N. The accumulation of soil C and
                                                                                     N is driven mainly by the decomposition of plant litter and
DISCUSSION
                                                                                     dead roots, whereas soil P transformation is driven primarily by
                                                                                     phosphate decomposition which requires long periods of time
Comparison of Soil C, N, and P                                                       (Deng et al., 2019). The N and P cycles can become decoupled
Stoichiometry Between Elm and Poplar                                                 under drought stress (Delgado-Baquerizo et al., 2013), and soil P
Plantations                                                                          diffusivity is more sensitive to soil water than that of N (Lambers
Afforestation can improve plant and soil nutrient concentrations                     et al., 2008); therefore, cation exchange and P sorption capacity
and stocks, soil quality, and vegetation structure via more                          are very low in sandy soil (Leinweber et al., 1999). Thus, the total
efficient use of resources for primary production (Nosetto                           P in the soil remained at levels too low for adequate absorption
et al., 2006). Afforestation increases water-holding capacity and                    and use by plants (Ma et al., 2009). A similar result was reported
nutrient retention (Evrendilek et al., 2004), increasing the efficacy                for Pinus radiata in a temperate Andisol soil, in which the
of C sequestration and enhancing ecosystem biodiversity and                          P concentrations remained unchanged following afforestation
resilience in semiarid regions (Hernandez-Ramirez et al., 2011).                     (Farley and Kelly, 2004).
In this study, compared with nearby wild grassland without                               Generally, the soil C concentrations showed an upward trend
afforestation (the C, N and P concentrations were 4.50, 0.31                         in both plantations over time, and the increase was greater in
and 0.11 g kg−1 at 0–20 cm; 2.35, 0.12 and 0.10 g kg−1                               the elm plantation than in the poplar plantation (Figure 2). Hu
at 20–40 cm; and 1.54, 0.10 and 0.10 g kg−1 at 40–60 cm,                             et al. (2016) reported that soil C sequestration was driven mainly
respectively), both elm and poplar plantations increased the                         by root input rather than leaf litter input after afforestation.
concentrations of soil C and N, especially in deeper soil layers,                    Higher fine root biomass was found in the elm plantation than
whereas there was no significant influence on P concentrations                       in the poplar plantation (Wang et al., 2014), which produced
(Figure 2). Similar results were reported for P. sylvestris var.                     more root litter and exudates to facilitate soil C transformation
mongolica afforestation in the Horqin Sandy Land (Li et al.,                         processes. Soil N concentrations showed an increase trend in
2012); however, Zhao et al. (2008) reported that afforestation                       the elm plantation, but no significant changes were observed
significantly reduced soil P concentrations but had no significant                   in the 0–20 or 20–40 cm soil layers in the poplar plantation
effect on soil C or N concentrations, perhaps due to differences                     during the growing season (Figure 2), perhaps due to the leaf
in tree species or stand density. Thus, the choice of afforestation                  litter decomposition rate (Wojciech et al., 2019). Elm leaves are
species and plantation management technique may be key factors                       small and soft, whereas those of poplar are larger and tougher
for successful afforestation (Zhao et al., 2008; Bai et al., 2019;                   with a thicker wax layer. Elm had higher litter decomposition
Ahmed et al., 2020).                                                                 and nutrient release rates than does poplar (Zhang et al., 2013).
    As predicted, the soil C and N concentrations were greater                       Soil P concentrations tended to decrease and then increase in
in the elm plantation than in the poplar plantation (Figure 2),                      the 0–20 cm soil layer in both plantations (Figure 2), perhaps
perhaps due to possible nutrient consumption for plant growth                        because more P in topsoil was absorbed by plants during summer.
and nutrient return in the form of leaf litter. Poplar is a                          P cycling is driven mainly by plant P demand and sustained by
fast-growing, high-yield tree species (Ahmed et al., 2020) and                       forest leaf litter inputs (Chen et al., 2008).
had much larger total biomass than elm (Table 1), while it                               Soil C:N:P stoichiometry is an important indicator of nutrient
had similar N concentrations and higher P concentrations in                          cycling and elemental limitations in plants (Luo et al., 2020).

Frontiers in Plant Science | www.frontiersin.org                                 8                                      April 2021 | Volume 12 | Article 655517
Wang et al. Comparison Between Poplar and Elm
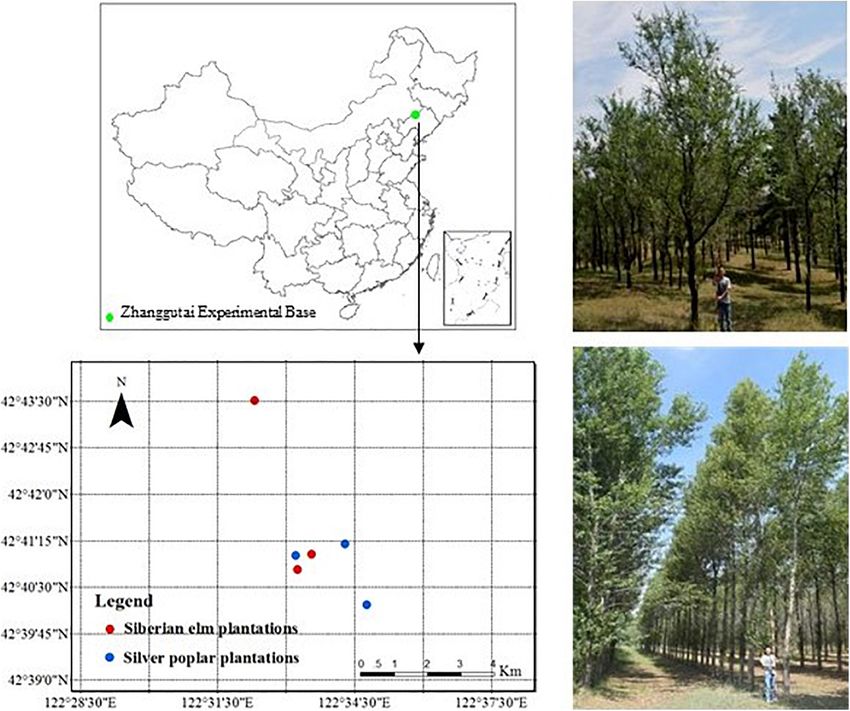
FIGURE 5 | Relationships between tree organ and soil N concentration in Siberian elm (A) and Silver poplar (B) plantations, and N:P in Siberian elm (C) and Silver
poplar (D) plantations. Only the cases with significance are shown. (n = 9 with 3 plots × 3 sampling seasons).
In our study, the average surface soil C:N, C:P, and N:P of the sequestrated within biomass (Kuznetsova et al., 2011; Yan et al.,
two plantations were 10.7, 55.6, and 5.1, respectively (Figure 2), 2017). Soil C:P has negative effects on soil P availability (Li et al.,
which were lower than average values in China (14.4, 136.0, and 2016). In our study, soil C:P and N:P were generally greater
9.3) and worldwide (14.3, 186.0, and 13.0) (McGroddy et al., in the elm plantation than in the poplar plantation (Figure 2)
2004; Tian et al., 2010). Compared with sandy grassland (Liu indicating lower soil P availability in the elm plantation relative
et al., 2013) and shrubland (Yang and Liu, 2019), we found lower to the poplar plantation.
C:N and higher C:P and N:P in the plantations, implying that
soil P content is lower in forest plantations in the Horqin Sandy
Land. This result may have been caused by greater sensitivity of
Comparison of Plant C, N, and P
P than N ion movement to soil moisture conditions (Walbridge, Stoichiometry Between Elm and Poplar
2000; Smith, 2002; He and Dijkstra, 2014), leading to a greater Plantations
dependence of soil P availability on soil water availability under C, N, and P concentrations and stoichiometric ratios in different
the drought conditions at the study site (Yang and Liu, 2019). plant organs can reflect adaptive strategies to various regimes
Furthermore, most of the P absorbed and assimilated by trees is in terms of nutrient uptake, allocation, and utilization during
Frontiers in Plant Science | www.frontiersin.org 9 April 2021 | Volume 12 | Article 655517Wang et al. Comparison Between Poplar and Elm
TABLE 3 | Regression slopes (1/H) of relationships between plant and soil nutrient Elm organ N and P concentrations decreased in autumn
stoichiometry of Siberian elm and Silver poplar.
(Figure 3), whereas N and P resorption efficiencies were lower
Siberian elm Silver poplar in elm than in poplar (Figure 4). This finding indicates the
return of high-quality leaf litter to the soil, leading to greater
Leaf Branch Root Leaf Branch Root N and P acquisition by elm via root uptake and implying
N –0.571 0 0 –2.758 0 1.513 more efficient nutrient cycles in the plant–litter–soil system. The
P 0 0 0 0 0 0 N concentrations in branches and roots were higher during
N:P –0.324 0.704 0 –4.488 –4.818 2.022 summer than during spring and autumn, with no significant
differences between these organs (Figure 3). This implies that
If the regression relationship is not significant (P > 0.05), then 1/H is set at zero,
and the organism is considered strictly homeostatic. If the regression relationship resource allocation between aerial and underground plant parts
is significant (P < 0.05), then species with | 1/H| ≥ 1 are considered not to be may be more balanced in elm than in poplar, promoting root
homeostatic, where those with 0 < | 1/H| < 1 are classified as follows: 0 < | growth during the rapid growing season for greater absorption
1/H| < 0.25, homeostatic; 0.25 < | 1/H| < 0.5, weakly homeostatic; 0.5 < | 1/H|
< 0.75, weakly plastic; or | 1/H| > 0.75, plastic.
of nutrient and water.
The leaf N:P can be used to determine potential N or
P limitations for plant growth, and a ratio < 14 indicates
plant growth (Niklas and Cobb, 2005). C concentrations did N limitation, whereas a ratio > 16 indicates P limitation
not differ significantly among plantation species, whereas they (Koerselman and Meuleman, 1996). In this study, the leaf N:P
decreased and then increased over time (Figure 3). Lower of elm was generally > 16 during the entire growing season
C concentrations often lead to higher specific leaf area and (Figure 3), indicating P limitation for elm growth. However, the
photosynthetic and growth rates (Niklas and Cobb, 2005), leaf N:P of poplar was > 16 in summer but < 14 in spring
implying faster growth for both tree species during summer and autumn (Figure 3), which indicates that poplar experienced
than during spring and autumn. Inconsistent with our second more P limitation during the fast-growing season and more N
prediction, poplar had higher P concentrations and lower C:P limitation during the early and late growing seasons. Generally,
than elm during summer, implying faster growth rate and elm may be more susceptible to P limitation as it had higher
more biomass accumulation. However, P concentrations and N:P than poplar.
C:P were similar in poplar leaf and branch compared with elm
during spring and autumn (Figure 3). Drought stress can induce
a decrease in available soil P (He and Dijkstra, 2014), thus
Comparison of Stoichiometric
limited P absorption from soil leads to low P concentrations Homeostasis Between Elm and Poplar
in plants to maintain C assimilation in arid and nutrient-poor Plantations
environments (He and Dijkstra, 2014), which may explain the Stoichiometric homeostasis reflects the balance between resource
similar P concentrations observed in the leaves and branches consumption and storage in plants during growth period (Blouin
between poplar and elm during spring and autumn. Drought et al., 2012), and it is positively correlated with vegetation stability
often induces xylem embolism in taller tree species (McDowell (Yu et al., 2010). Stoichiometric homeostasis has been used to
et al., 2008), and water transport failure can affect nutrient study the mechanisms of plant adaption to environmental change
translocation and allocation (He and Dijkstra, 2014). Poplar is (Wang et al., 2019), and it has been compared among tree species
taller and more susceptible to hydraulic failure in sandy regions with similar age following afforestation on the Loess Plateau of
(Song et al., 2021), which may lead to nutrient accumulation in China (Bai et al., 2019) and in arid mining subsidence areas (Xiao
roots. This process may also explain the higher NuRE of poplar et al., 2021). Although the soil granulometric composition may
than elm (Figure 4). Inconsistent with our second prediction, influence nutrient concentration in tissue, it would not affect
N concentrations and C:N in leaves and branches were similar homeostatic analysis. Variations in plant nutrient concentrations
between elm and poplar during summer, although lower N are the integrated results of soil improvement following
concentrations and higher C:N in leaves and branches were found afforestation (Bai et al., 2019). The homeostasis analysis is based
in poplar than in elm during autumn (Figure 3). These findings on the current N and P concentration and N:P in soils and plants
may because of growth dilution effects after summer caused (Bai et al., 2019), regardless of the soil granulometric composition
by the greater biomass and growth rate of poplar compared changes. In this study, both elm and poplar exhibited N and P
with those of elm. In poplar, N concentrations were higher in concentration and N:P ratio homeostasis to some extent across
leaves and branches but lower in roots during summer than the growing season (Figure 5), indicating relatively conservative
those during spring and autumn (Figure 3), implying that nutrient use in both species, which improves their adaptation to
more resources are allocated to leaves and branches during this arid and nutrient-deficient environment. The maintenance
the rapid growth season to promote the growth of aerial plant of stable elemental composition in the plant body in a changeable
part. N and P concentrations increased in roots but decreased environment is beneficial for growth, development and survival
in leaves and branches during autumn (Figure 3), which (Blouin et al., 2012). To minimize the effects of tree size, we only
indicated that most N and P were reabsorbed and transferred compared N:P homeostasis between elm and poplar. Consistent
to roots for storage, implying a more conservative nutrient use with our third hypothesis, elm generally showed greater N:P
strategy that benefits sprouting and new leaf growth during the homeostasis than did poplar (Figure 5), indicating that elm may
following spring. have more developed nutrient modulation systems than poplar,
Frontiers in Plant Science | www.frontiersin.org 10 April 2021 | Volume 12 | Article 655517Wang et al. Comparison Between Poplar and Elm
or that elm contains more functional materials, leading to a faster CONCLUSION
response to nutrient regime changes (Bai et al., 2019). Native
species such as elm have a longer life history in a given local In this study, nutrient conservation, use mechanisms, and
environment, which could allow it to adapt better to adverse stoichiometric homeostasis traits differed between elm and
environmental conditions, thereby improving ecosystem stability poplar plantations in the Horqin Sandy Land of China. Elm
in the elm plantation compared with the poplar plantation. had lower organ N and P concentrations in autumn but greater
However, stoichiometric homeostasis is coupled to tree growth litter N and P, and soil C and N concentrations, which enhanced
and development (Wang et al., 2019). In future studies, the nutrient cycling in the plant–litter–soil system. Elm evenly
stoichiometric homeostasis is needed to be evaluated in the two allocated N and P contents between aerial and underground
tree species of different age and size to better understand the parts. In contrast, poplar had higher root N and P concentrations
mechanisms of nutrient conservation. in autumn and higher N and P resorption efficiencies but lower
Limiting elements in plants with homeostasis generally have soil C and N concentrations, implying a more conservative
low variability and environmental sensitivity (Han et al., 2011); nutrient use strategy and more developed internal nutrient
thus, they are the main regulators of homeostasis (Sterner and cycles. Poplar had higher P concentrations and lower C:P
Elser, 2002). Leaves, branches, and roots in both elm and poplar than elm and allocated more N and P to leaves and branches
trees were found to have strict P homeostasis (Table 3), indicating during summer, implying faster growth rate and greater biomass,
that P may be the main nutrient limiting factor for the growth of which contributed to lower soil nutrient concentrations. These
mature elm and poplar plantations. Similar results were found traits are beneficial for early poplar growth, although stand
in P. sylvestris var. mongolica plantations (Zhao et al., 2009) and degradation is expected to occur once soil nutrients can no
Caragana shrubs (Yang and Liu, 2019) in the same region. longer sustain the nutritive requirements for growth. Generally,
The degree of stoichiometric homeostasis appears to vary elm exhibited greater N:P homeostasis than poplar. Elm showed
among organs (Bai et al., 2019), reflecting a fundamental greater homeostasis in roots than in leaves and branches, whereas
trade-off in nutrient investment and allocation among organs poplar coordinated nutrient allocation among organs. P was the
(Gu et al., 2017). In this study, elm branch and root N main nutrient limiting factor in both elm and poplar plantations.
concentrations and root N:P showed strict homeostasis, whereas Overall, elm was more adaptable to the arid, nutrient-deficient
the leaf N concentrations and N:P were weakly plastic and environment in terms of fostering soil nutrient accumulation
weakly homeostatic, respectively (Table 3). These results are and improving nutrient cycles in plant–litter–soil systems of the
inconsistent with those of previous studies demonstrating that Horqin Sandy Land.
leaf homeostasis is often greater than that of other organs such
as branches, roots, and fruits (Bai et al., 2019; Wang et al., 2019),
perhaps because leaf nutrient contents are constrained within DATA AVAILABILITY STATEMENT
a certain range to provide optimal physiological traits for the
maintenance of survival and growth (Aerts and Chapin, 2000). The raw data supporting the conclusions of this article will be
Elm can survive after disastrous weather, insect or disease events, made available by the authors, without undue reservation.
even if all leaves are lost. Therefore, maintaining the nutrient
balance in elm roots may be an adaptive strategy in arid and
barren environments. In poplar, the N concentrations and N:P AUTHOR CONTRIBUTIONS
among the three organs were not homeostatic, except for the N
concentrations in branches (Table 3); the N concentrations and KW and RZ conceived and designed the study. KW and EN
N:P decreased in leaves and branches but increased in roots as performed the experiments. KW and TY wrote the manuscript.
soil N concentrations and N:P increased (Figures 5B,D). These TY and LS reviewed and edited the manuscript. All authors read
findings indicate that poplar coordinates nutrient allocation and approved the manuscript.
among organs and nutrient translocation between aerial (leaf and
branch) and underground (root) part, which showed opposite
trends. When poplar experienced nutrient limitation, it decreased FUNDING
nutrient supply to the aerial parts and increased nutrient storage
in underground parts. Poplar produces many root shoots and This research was funded by the National Natural Science
can sprout from roots in the spring following nutrient limitation, Foundation of China (31400613, 31770757) and the Liaoning
even if the aerial parts have died. Revitalization Talents Program (XLYC1807017).
REFERENCES × P. nigra plantation established with different densities in semi-arid areas
of northeastern China. J. For. Res. 31, 497–506. doi: 10.1007/s11676-019-00
Aerts, R., and Chapin, F. I. (2000). The mineral nutrition of wild plants revisited: a 887-z
re-evaluation of processes and patterns. Adv. Ecol. Res. 30, 1–67. doi: 10.1016/ Bai, X. J., Wang, B. R., An, S. S., Zeng, Q. C., and Zhang, H. X. (2019). Response
S0065-2504(08)60016-1 of forest species to C:N:P in the plant-litter-soil system and stoichiometric
Ahmed, A. K. M., Fu, Z. X., Ding, C. J., Jiang, L. P., Han, X. D., Yang, A. G., homeostasis of plant tissues during afforestation on the Loess Plateau, China.
et al. (2020). Growth and wood properties of a 38-year-old Populus simonii Catena 183:104186. doi: 10.1016/j.catena.2019.104186
Frontiers in Plant Science | www.frontiersin.org 11 April 2021 | Volume 12 | Article 655517Wang et al. Comparison Between Poplar and Elm
Bao, S. D. (2000). Soil and Agriculture Chemistry Analysis. Beijing: China Kobe, R. K., Lepczyk, C. A., and Iyer, M. (2005). Resorption efficiency decreases
Agriculture Press. with increasing green leaf nutrients in a global data set. Ecology 86, 2780–2792.
Blouin, M., Mathieu, J., and Leadley, P. W. (2012). Plant homeostasis, growth doi: 10.1890/04-1830
and development in natural and artificial soils. Ecol. Complex. 9, 10–15. doi: Koerselman, W., and Meuleman, A. F. M. (1996). The vegetation N:P ratio: a new
10.1016/j.ecocom.2011.11.001 tool to detect the nature of nutrient limitation. J. Appl. Ecol. 33, 1441–1450.
Bui, E. N., and Henderson, B. L. (2013). C:N:P stoichiometry in Australian soils doi: 10.2307/2404783
with respect to vegetation and environmental factors. Plant Soil 373, 553–568. Kuznetsova, T., Lukjanova, A., Mandre, M., and Lõhmus, K. (2011). Aboveground
doi: 10.1007/s11104-013-1823-9 biomass and nutrient accumulation dynamics in young black alder, silver birch
Capozzi, F., Palma, A. D., Paola, F. D., Giugni, M., Iavazzo, P., Topa, M. E., et al. and Scots pine plantations on reclaimed oil shale mining areas in Estonia. For.
(2018). Assessing desertification in sub-Saharan peri-urban areas: case study Ecol. Manag. 262, 56–64. doi: 10.1016/j.foreco.2010.09.030
applications in Burkina Faso and Senegal. J. Geochem. Explor. 190, 281–291. Lambers, H., Chapin, F. S., and Pons, T. L. (2008). Plant Physiological Ecology.
doi: 10.1016/j.gexplo.2018.03.012 New York, NY: Springer.
Chen, C. R., Condron, L. M., and Xu, Z. H. (2008). Impacts of grassland Leinweber, P., Meissner, R., Eckhardt, K. U., and Seeger, J. (1999). Management
afforestation with coniferous trees on soil phosphorus dynamics and associated effects on forms of phosphorus in soil and leaching losses. Eur. J. Soil Sci. 50,
microbial processes: a review. For. Ecol. Manag. 255, 396–409. doi: 10.1016/j. 413–424. doi: 10.1046/j.1365-2389.1999.00249.x
foreco.2007.10.040 Li, Y., Niu, S. L., and Yu, G. R. (2016). Aggravated phosphorus limitation on
Chu, X., Zhan, J. Y., Li, Z. H., Zhang, F., and Qi, W. (2019). Assessment on forest biomass production under increasing nitrogen loading: a meta-analysis. Glob.
carbon sequestration in the Three-North Shelterbelt Program region, China. Chang. Biol. 22, 934–943. doi: 10.1111/gcb.13125
J. Clean. Prod. 215, 382–389. doi: 10.1016/j.jclepro.2018.12.296 Li, Y. Q., Awada, T., Zhou, X. H., Shang, W., Chen, Y. P., Zuo, X. A., et al.
Daufresne, T., and Loreau, M. (2001). Ecological stoichiometry, primary (2012). Mongolian pine plantations enhance soil physico-chemical properties
producer-decomposer interactions, and ecosystem persistence. Ecology 82, and carbon and nitrogen capacities in semi-arid degraded sandy land in China.
3069–3082. Appl. Soil Ecol. 56, 1–9. doi: 10.1016/j.apsoil.2012.01.007
Delgado-Baquerizo, M., Maestre, F. T., Gallardol, A., Bowker, M. A., Wallenstein, Li, Y. Q., Zhao, H. L., Zhao, X. Y., Zhang, T. H., and Chen, Y. P. (2006). Biomass
M. D., Quero, J. L., et al. (2013). Decoupling of soil nutrient cycles as a function energy, carbon and nitrogen stores in different habitats along a desertification
of aridity in global drylands. Nature 502, 672–676. doi: 10.1038/nature12670 gradient in the Semiarid Horqin Sandy Land. Arid Land Res. Manag. 20, 43–60.
Deng, J., Wang, S., Ren, C. J., Zhang, W., Zhao, F. Z., Li, X. F., et al. (2019). doi: 10.1080/15324980500369285
Nitrogen and phosphorus resorption in relation to nutrition limitation along Lindroth, R. L., and Clair, S. B. S. (2013). Adaptations of quaking aspen (Populus
the chronosequence of Black Locust (Robinia pseudoacacia L.) plantation. tremuloides Michx.) for defense against herbivores. For. Ecol. Manag. 299,
Forests 10:261. doi: 10.3390/f10030261 14–21. doi: 10.1016/j.foreco.2012.11.018
Deng, J. F., Li, J. H., Deng, G., Zhu, H. Y., and Zhang, R. H. (2017). Fractal Liu, M., Dries, L., Heijman, W., Huang, J., Zhu, X., Hu, Y., et al. (2018). The
scaling of particle-size distribution and associations with soil properties of impact of ecological construction programmes on grassland conservation in
Mongolian pine plantations in the Mu Us Desert, China. Sci. Rep. 7:6742. Inner Mongolia, China. Land Degrad. Dev. 29, 326–336. doi: 10.1002/ldr.2692
doi: 10.1038/s41598-017-06709-8 Liu, R. T., Zhao, H. L., Zhao, X. Y., and Zhu, F. (2013). Effects of cultivation
Elser, J., Fagan, W., Kerkhoff, A., Swenson, N., and Enquist, B. (2010). Biological and grazing exclusion on the soil macro-faunal community of semiarid sandy
stoichiometry of plant production: metabolism, scaling and ecological response grasslands in northern China. Arid Land Res. Manag. 27, 377–393. doi: 10.1080/
to global change. New Phytol. 186, 593–608. doi: 10.1111/j.1469-8137.2010. 15324982.2013.787470
03214.x Luo, X. Z., Hou, E. Q., Chen, J. Q., Li, J., Zhang, L. L., Zang, X. W., et al. (2020).
Evrendilek, F., Celik, I., and Kilic, S. (2004). Changes in soil organic carbon and Dynamics of carbon, nitrogen, and phosphorus stocks and stoichiometry
other physical soil properties along adjacent Mediterranean forest, grassland, resulting from conversion of primary broadleaf forest to plantation and
and cropland ecosystems in Turkey. J. Arid Environ. 59, 743–752. doi: 10.1016/ secondary forest in subtropical China. Catena 193:104606. doi: 10.1016/j.
j.jaridenv.2004.03.002 catena.2020.104606
Fang, Z., Li, D. D., Jiao, F., Yao, J., and Du, H. T. (2019). The latitudinal patterns Ma, B., Zhou, Z. Y., Zhang, C. P., Zhang, G., and Hu, Y. J. (2009). Inorganic
of leaf and soil C:N:P stoichiometry in the Loess Plateau of China. Front. Plant phosphorus fractions in the rhizosphere of xerophytic shrubs in the Alxa Desert.
Sci. 10:85. doi: 10.3389/fpls.2019.00085 J. Arid Environ. 73, 55–61. doi: 10.1016/j.jaridenv.2008.08.006
Farley, K. A., and Kelly, E. F. (2004). Effects of afforestation of a páramo grassland Manzoni, S., Jackson, R. B., Trofymow, J. A., and Porporato, A. (2008). The
on soil nutrient status. For. Ecol. Manag. 195, 281–290. doi: 10.1016/j.foreco. global stoichiometry of litters nitrogen mineralization. Science 321, 684–686.
2003.12.015 doi: 10.1126/science.1159792
Gu, Q., Zamin, T. J., and Grogan, P. (2017). Stoichiometric homeostasis: a test to McDowell, N. G., Pockman, W. T., Allen, C. D., Breshears, D. D., Cobb, N., Kolb,
predict tundra vascular plant species and community-level response to climate T., et al. (2008). Mechanisms of plant survival and mortality during drought:
change. Arctic Sci. 3, 320–333. doi: 10.1139/as-2016-0032 why do some plants survive while others succumb to drought? New Phytol. 178,
Han, W. X., Fang, J. Y., Reich, P. B., Woodward, F. L., and Wang, Z. H. (2011). 719–739. doi: 10.1111/j.1469-8137.2008.02436.x
Biogeography and variability of eleven mineral elements in plant leaves across McGroddy, M. E., Daufresne, T., and Hedin, L. O. (2004). Scaling of C:N:P
gradients of climate, soil and plant functional type in China. Ecol. Lett. 14, stoichiometry in forests worldwide: implications of terrestrial Redfield-type
788–796. doi: 10.1111/j.1461-0248.2011.01641.x ratios. Ecology 85, 2390–2401.
He, M. Z., and Dijkstra, F. A. (2014). Drought effect on plant nitrogen and Mulder, C., and Elser, J. J. (2009). Soil acidity, ecological stoichiometry and
phosphorus: a meta-analysis. New Phytol. 204, 924–931. doi: 10.1111/nph. allometric scaling in grassland food webs. Glob. Chang. Biol. 15, 2730–2738.
12952 doi: 10.1111/j.1365-2486.2009.01899.x
Hernandez-Ramirez, G., Sauer, T. J., Cambardella, C. A., Brandle, J. R., and James, Niklas, K. J., and Cobb, E. D. (2005). N, P, and C stoichiometry of Eranthis hyemalis
D. E. (2011). Carbon sources and dynamics in afforested and cultivated corn (Ranunculaceae) and the allometry of plant growth. Am. J. Bot. 92, 1256–1263.
belt soils. Soil Sci. Soc. Am. J. 75, 216–225. doi: 10.2136/sssaj2010.0114 doi: 10.3732/ajb.92.8.1256
Hessen, D. O., Ågren, G. I., Anderson, T. R., Elser, J. J., and Ruiter, P. C. (2004). Nosetto, M. D., Jobbágy, E. G., and Paruelo, J. M. (2006). Carbon sequestration in
Carbon sequestration in ecosystems: the role of stoichiometry. Ecology 85, semi-arid rangelands: comparison of Pinus ponderosa plantations and grazing
1179–1192. doi: 10.1890/02-0251 exclusion in NW Patagonia. J. Arid Environ. 67, 142–156. doi: 10.1016/j.
Hu, Y. L., Zeng, D. H., Ma, X. Q., and Chang, S. X. (2016). Root rather than leaf jaridenv.2005.12.008
litter input drives soil carbon sequestration after afforestation on a marginal Peng, H. Y., Chen, Y. H., Yan, Z. B., and Han, W. X. (2016). Stage-dependent
cropland. For. Ecol. Manag. 362, 38–45. doi: 10.1016/j.foreco.2015.11.048 stoichiometric homeostasis and responses of nutrient resorption in Amaranthus
Jiao, S. R. (1989). Structure and Function of Sandy Forest Ecosystems in Zhanggutai. mangostanus to nitrogen and phosphorus addition. Sci. Rep. 6:37219. doi: 10.
Liaoning: Scinece and Technology Press. 1038/srep37219
Frontiers in Plant Science | www.frontiersin.org 12 April 2021 | Volume 12 | Article 655517Wang et al. Comparison Between Poplar and Elm Persson, J., Fink, P., Goto, A., James, M. H., Jayne, J., and Satoshi, K. (2010). To Yan, T., Zhu, J. J., Yang, K., Yu, L. Z., and Zhang, J. X. (2017). Nutrient removal be or not to be what you eat: regulation of stoichiometric homeostasis among under different harvesting scenarios for larch plantations in northeast China: autotrophs and heterotrophs. Oikos 119, 741–751. doi: 10.1111/j.1600-0706. implications for nutrient conservation and management. For. Ecol. Manag. 400, 2009.18545.x 150–158. doi: 10.1016/j.foreco.2017.06.004 Sinsabaugh, R. L., Lauber, C. L., Weintraub, M. N., Ahmed, B., Allison, S. D., Yang, D. X., Song, L., and Jin, G. Z. (2019). The soil C:N:P stoichiometry is more Crenshaw, C., et al. (2008). Stoichiometry of soil enzyme activity at global scale. sensitive than the leaf C:N:P stoichiometry to nitrogen addition: a four-year Ecol. Lett. 11, 1252–1264. doi: 10.1111/j.1461-0248.2008.01245.x nitrogen addition experiment in a Pinus koraiensis plantation. Plant Soil 442, Smith, F. W. (2002). The phosphate uptake mechanism. Plant Soil 245, 105–114. 183–198. doi: 10.1007/s11104-019-04165-z doi: 10.1023/A:1020660023284 Yang, Y., and Liu, B. R. (2019). Effects of planting Caragana shrubs on soil nutrients Song, L. N., Zhu, J. J., Li, M. C., Zhang, J. X., Wang, K., and Lü, L. Y. (2020). and stoichiometries in desert steppe of Northwest China. Catena 183:104213. Comparison of water-use patterns for non-native and native woody species in doi: 10.1016/j.catena.2019.104213 a semiarid sandy region of Northeast China based on stable isotopes. Environ. Yu, Q., Chen, Q. S., Elser, J. J., He, N. P., Wu, H. H., Zhang, G. M., et al. (2010). Exp. Bot. 174:103923. doi: 10.1016/j.envexpbot.2019.103923 Linking stoichiometric homoeostasis with ecosystem structure, functioning and Song, L. N., Zhu, J. J., Zhang, T., Wang, K., Wang, G. C., and Liu, J. H. (2021). stability. Ecol. Lett. 13, 1390–1399. doi: 10.1111/j.1461-0248.2010.01532.x Higher canopy transpiration rates induced dieback in poplar (Populus × Yuan, X. B., Niu, D. C., Gherardi, L. A., Liu, Y. B., Wang, Y., Elser, J. J., et al. xiaozhuanica) plantations in a semiarid sandy region of Northeast China. Agric. (2019). Linkages of stoichiometric imbalances to soil microbial respiration with Water Manage. 243:106414. doi: 10.1016/j.agwat.2020.106414 increasing nitrogen addition: evidence from a long-term grassland experiment. Sterk, G., Boardman, J., and Verdoodt, A. (2016). Desertification: history, causes Soil Biol. Biochem. 138:107580. doi: 10.1016/j.soilbio.2019.107580 and options for its control. Land Degrad. Dev. 27, 1783–1787. doi: 10.1002/ldr. Zeng, D. H., Hu, Y. L., Chang, S. X., and Fan, Z. P. (2009). Land cover change effects 2525 on soil chemical and biological properties after planting Mongolian pine (Pinus Sterner, R. W., and Elser, J. J. (2002). Ecological Stoichiometry: The Biology of sylvestris var. Mongolica) in sandy lands in Keerqin, northeastern China. Plant Elements from Molecules to the Biosphere. Princeton, NJ: Princeton University Soil 317, 121–133. doi: 10.1007/s11104-008-9793-z Press. Zeng, D. H., and Jiang, F. Q. (2006). Deterring “three excesses” (over-cultivation, Tian, H., Chen, G., Zhang, C., Melillo, J. M., and Hall, C. A. (2010). Pattern overgrazing, deforestation) is the only way from the source to control the and variation of C:N:P ratios in China’s soil: a synthesis of observational data. desertification in ecologically frangible regions in China: taking Keerqin sandy Biogeochemistry 98, 139–151. doi: 10.2307/40647956 land as an example. Chin. J. Ecol. 25, 1540–1543. doi: 10.13292/j.1000-4890. van Heerwaarden, L. M., Toet, S., and Aerts, R. (2003). Current measures of 2006.0294 nutrient resorption efficiency lead to a substantial underestimation of real Zhang, X. X., Liu, Z. W., Zhu, Z. H., and Du, L. Z. (2013). Impacts of decomposition resorption efficiency: facts and solutions. Oikos 101, 664–669. doi: 10.1034/j. of mixture of leaf litters from Platycladus orientalis and other trees on nutrient 1600-0706.2003.12351.x release. Acta Pedologica Sin. 50, 181–188. Walbridge, M. R. (2000). Phosphorus biogeochemistry. Ecology 81, 1474–1475. Zhao, Q., Zeng, D. H., and Fan, Z. P. (2010). Nitrogen and phosphorus doi: 10.2307/177227 transformations in the rhizospheres of three tree species in a nutrient-poor Wang, J. N., Wang, J. Y., Wang, L., Zhang, H., Guo, Z. W., Wang, G. G., et al. sandy soil. Appl. Soil Ecol. 46, 341–346. doi: 10.1016/j.apsoil.2010.10.007 (2019). Does stoichiometric homeostasis differ among tree organs and with tree Zhao, Q., Zeng, D. H., Fan, Z. P., and Lee, D. K. (2008). Effect of land cover change age? For. Ecol. Manag. 453:117637. doi: 10.1016/j.foreco.2019.117637 on soil phosphorus fractions in Southeastern Horqin Sandy Land, Northern Wang, K., Song, L. N., Lü, L. Y., Zhang, L., and Qin, Z. Y. (2014). Fine root China. Pedosphere 18, 741–748. doi: 10.1016/S1002-0160(08)60069-7 biomass vertical distribution character of main afforestation tree species in Zhao, Q., Zeng, D. H., Fan, Z. P., Yu, Z. Y., Hu, Y. L., and Zhang, J. W. (2009). Horqin Sandy Land. Bull. Bot. Res. 34, 824–828. doi: 10.7525/j.issn.1673-5102. Seasonal variations in phosphorus fractions in semiarid sandy soils under 2014.06.018 different vegetation types. For. Ecol. Manag. 258, 1376–1382. doi: 10.1016/j. Wang, L. L., Li, Y. L., Duan, Y. L., Lian, J., Luo, Y. Q., Wang, X. Y., et al. (2020). foreco.2009.06.047 Effects of nitrogen addition and reproductive effort on nutrient resorption of a Zhou, H. H., Chen, Y. N., Zhu, C. G., Li, Z., Fang, G. H., Li, Y. P., et al. (2020). sand-fixing shrub. Front. Plant Sci. 11:588865. doi: 10.3389/fpls.2020.588865 Climate change may accelerate the decline of desert riparian forest in the Wang, T. (2014). Aeolian desertification and its control in Northern China. Int. lower Tarim River, Northwestern China: evidence from tree-rings of Populus Soil Water Conserv. Res. 2, 34–41. doi: 10.1016/S2095-6339(15)30056-3 euphratica. Ecol. Indic. 111:105997. doi: 10.1016/j.ecolind.2019.105997 Wang, W. J., Lu, J. L., Du, H. J., Wei, C. H., Wang, H. M., Fu, Y. J., et al. (2017). Zhu, J. J., Li, F. Q., Xu, M. L., Kang, H. Z., and Xu, D. Y. (2008). The role Ranking thirteen tree species based on their impact on soil physiochemical of ectomycorrhizal fungi in alleviating pine decline in semiarid sandy soil of properties, soil fertility, and carbon sequestration in Northeastern China. For. northern China: an experimental approach. Ann. For. Sci. 65:304. doi: 10.1051/ Ecol. Manag. 404, 214–229. doi: 10.1016/j.foreco.2017.08.047 forest:2008007 Wojciech, P., Ewa, B., Jarosław, L., and Martin, L. (2019). A comparison of C:N:P stoichiometry in soil and deadwood at an advanced decomposition stage. Conflict of Interest: The authors declare that the research was conducted in the Catena 179, 1–5. doi: 10.1016/j.catena.2019.03.025 absence of any commercial or financial relationships that could be construed as a Xiao, L., Bi, Y. L., Du, S. Z., Wang, Y., Guo, C., and Christie, P. (2021). Response of potential conflict of interest. ecological stoichiometry and stoichiometric homeostasis in the plant-litter-soil system to re-vegetation type in arid mining subsidence areas. J. Arid Environ. Copyright © 2021 Wang, Zhang, Song, Yan and Na. This is an open-access article 184:104298. doi: 10.1016/j.jaridenv.2020.104298 distributed under the terms of the Creative Commons Attribution License (CC BY). Yan, T., Lü, X. T., Yang, K., and Zhu, J. J. (2016). Leaf nutrient dynamics and The use, distribution or reproduction in other forums is permitted, provided the nutrient resorption: a comparison between larch plantations and adjacent original author(s) and the copyright owner(s) are credited and that the original secondary forests in Northeast China. J. Plant Ecol. 9, 165–173. doi: 10.1093/ publication in this journal is cited, in accordance with accepted academic practice. No jpe/rtv034 use, distribution or reproduction is permitted which does not comply with these terms. Frontiers in Plant Science | www.frontiersin.org 13 April 2021 | Volume 12 | Article 655517
You can also read