Journal of Geophysical Research: Solid Earth
←
→
Page content transcription
If your browser does not render page correctly, please read the page content below
Journal of Geophysical Research: Solid Earth
RESEARCH ARTICLE                               Earthquakes and Tremor Linked to Seamount Subduction
10.1029/2018JB016136
                                               During Shallow Slow Slip at the Hikurangi Margin,
Key Points:
• Offshore tectonic tremor localizes at
                                               New Zealand
  subducted seamounts during and               Erin K. Todd1,2 , Susan Y. Schwartz1 , Kimihiro Mochizuki3 , Laura M. Wallace4,5                           ,
  immediately following the 2014
  Gisborne SSE                                 Anne F. Sheehan6 , Spahr C. Webb7 , Charles A. Williams4 , Jenny Nakai6 ,
• Stresses from seamount subduction            Jefferson Yarce6 , Bill Fry4, Stuart Henrys4, and Yoshihiro Ito8
  dominate megathrust slow slip in
                                               1
  producing seismicity and tremor               Department of Earth and Planetary Sciences, University of California, Santa Cruz, CA, USA, 2Now at Department of Geology,
• A wide range of slip processes occur         University of Otago, Dunedin, New Zealand, 3Earthquake Research Institute, University of Tokyo, Tokyo, Japan, 4GNS
  on the plate interface in very close
                                               Science, Lower Hutt, New Zealand, 5University of Texas Institute for Geophysics (UTIG), Austin, TX, USA, 6Cooperative
  proximity to one another
                                               Institute for Research in Environmental Sciences, University of Colorado Boulder, Boulder, CO, USA, 7Lamont-Doherty Earth
                                               Observatory (LDEO), Columbia University, New York, NY, USA, 8Disaster Prevention Research Institute, Kyoto University,
Supporting Information:                        Kyoto, Japan
• Figure S1

Correspondence to:                             Abstract      Shallow slow slip events have been well documented offshore Gisborne at the northern
E. K. Todd,
erin.todd@otago.ac.nz
                                               Hikurangi subduction margin, New Zealand, and are associated with tectonic tremor downdip of the slow
                                               slip patch and increases in local microseismicity. Tremor and seismicity on the shallow subduction interface
                                               are often poorly resolved due to their distance from land-based seismic and geodetic networks. To address
Citation:
Todd, E. K., Schwartz, S. Y., Mochizuki, K.,
                                               this shortcoming, the Hikurangi Ocean Bottom Investigation of Tremor and Slow Slip experiment deployed
Wallace, L. M., Sheehan, A. F., Webb, S.       24 absolute pressure gauges and 15 ocean bottom seismometers on the seafloor above the Gisborne slow slip
C., et al. (2018). Earthquakes and tremor      patch to investigate the spatial and temporal extent of slow slip and associated tremor and earthquake
linked to seamount subduction during
shallow slow slip at the Hikurangi
                                               activity. We present a detailed spatiotemporal analysis of the seismic signatures of various interplate slip
Margin, New Zealand. Journal of                processes associated with the September/October 2014 Gisborne slow slip event. Tectonic tremor begins
Geophysical Research: Solid Earth, 123,        toward the end and continues after the geodetically constrained slow slip event and is localized in the vicinity
6769–6783. https://doi.org/10.1029/
2018JB016136
                                               of two subducted seamounts within and updip of the slow slip patch. The subsequent, rather than
                                               synchronous occurrence of tremor suggests that tremor may be triggered by stress changes induced by slow
Received 22 MAY 2018                           slip. However, Coulomb failure stress change models based on the slow slip distribution fail to predict the
Accepted 20 JUL 2018                           location of tremor, suggesting that seamount subduction plays a dominant role in the stress state of the
Accepted article online 27 JUL 2018
Published online 20 AUG 2018
                                               shallow megathrust. This and the observed interplay of seismic and aseismic interplate slip processes imply
                                               that stress changes from slow slip play a secondary role in the distribution of associated microseismicity.

                                               1. Introduction
                                               Slow slip events (SSEs) are now recognized as an important part of the spectrum of strain release processes
                                               ranging from steady aseismic plate convergence rates of a few centimeters per year to regular earthquakes
                                               with fault slip rates of a few meters per second (e.g., Beroza & Ide, 2011; Peng & Gomberg, 2010; Schwartz &
                                               Rokosky, 2007). Over the last decade, the list of regions with documented slow slip events has increased and
                                               diversified. Slow slip and related seismic phenomena have been identified in numerous subduction margins
                                               around the globe (e.g., Douglas et al., 2005; Dragert et al., 2001; Hirose & Obara, 2005; Jiang et al., 2012;
                                               Kostoglodov et al., 2003; Obara et al., 2004; Ohta et al., 2006; Outerbridge et al., 2010; Radiguet et al., 2016;
                                               Vallée et al., 2013; Wallace & Beavan, 2010). The abundant observations of slow slip have shown that it occurs
                                               under a variety of depth and temperature conditions and exhibits a wide range of behaviors in magnitude,
                                               duration, recurrence interval, and association with tremor and/or microseismicity. While slow slip at many
                                               subduction margins occurs at depths of 30–50 km, slow slip along the northern Hikurangi Margin, New
                                               Zealand; the Nicoya Peninsula, Costa Rica; the Boso Peninsula, Japan; and near La Plata Island, Ecuador, is
                                               shallow (e.g., Ozawa et al., 2003; Protti et al., 2004; Vallée et al., 2013; Wallace & Beavan, 2010), occurring at
                                               depths of less than 15 km, and often in locations where margin tectonics are dominated by the subduction
                                               of seamounts and ridges (see review in Saffer & Wallace, 2015).

©2018. American Geophysical Union.             While the exact physical mechanisms for slow slip are not well understood, it is accepted that slow slip is a
All Rights Reserved.                           manifestation of shear failure, like a regular earthquake, but with a considerably slower slip speed

TODD ET AL.                                                                                                                                                        6769
Journal of Geophysical Research: Solid Earth                                           10.1029/2018JB016136

                    controlled by some other process such as dilatant hardening (Segall et al., 2010), transitional frictional
                    behavior from high fluid pressures (Liu & Rice, 2007), rate-dependent changes in frictional properties (from
                    velocity weakening to velocity strengthening) with increasing slip speed (Kaproth & Marone, 2013;
                    Shibazaki & Iio, 2003), or the evolution of elastic stiffness in a localized shear fabric (Leeman et al., 2015).
                    The coincidence of shallow slow slip with regions where subduction of topographically high features like
                    seamounts and ridges have thoroughly fractured the upper plate (Dominguez et al., 1998; Ruh et al., 2016;
                    Wang & Bilek, 2011, 2014) suggests that slow slip can be enhanced by heterogeneity of plate boundary
                    properties. In this case (and perhaps others), we expect slow slip to be accommodated on a network of
                    fractures, rather than along a single plane.
                    A large proportion of the existing slow slip observations in subduction zones come from regions where slow
                    slip occurs at depths of 20–50 km—typically beneath the land and thus (relatively) easily instrumented
                    (e.g., Dragert et al., 2001; Hirose et al., 1999; Kostoglodov et al., 2003), enabling numerous observations
                    and good characterization of slip. The behavior of the shallow, offshore portion of the subduction interface
                    is, however, often poorly resolved. Regions such as Costa Rica, New Zealand, Ecuador, and the Boso
                    Peninsula, Japan, where land is close to the trench and slow slip has been documented at shallow
                    (
Journal of Geophysical Research: Solid Earth                                                    10.1029/2018JB016136

                    Figure 1. Hikurangi Margin tectonic setting. (a) Topographic/bathymetric relief of the Hikurangi Margin (trench = solid
                    black line) showing a rough incoming Pacific plate in the northern segment with seamounts, the sediment covered cen-
                    tral segment, and the obliquely subducting southern segment. Place name abbreviations: W = Wairarapa, HB = Hawke’s
                    Bay, MP = Mahia Peninsula, PB = Poverty Bay, TB = Tolaga Bay, EC = East Cape, TK = Tūranganui Knoll. Seamounts Puke and
                    the Tūranganui knoll are circled. The northern Hikurangi Margin study region shown in (b) is identified by the white box.
                    (b) Stations from the offshore Hikurangi Ocean Bottom Investigation of Tremor and Slow Slip (HOBITSS) experiment
                    (triangles = ocean bottom seismometers, squares = absolute pressure gauges) and onshore New Zealand National Seismic
                    Network (triangles = seismometers). Stations in red were used in the detection and location of tectonic tremor. Subducting
                    seamounts S1, S2, and Puke are outlined in gray (Bell et al., 2014). Regions of high-amplitude interface reflectivity (HRZ)
                    and lower amplitude lens reflectivity (LRZ; Bell et al., 2010) are outlined in dashed lines. Epicenters from the 1947 tsunami
                    earthquakes are plotted as yellow stars.

                    the subducting Hikurangi Plateau, and the resulting shallow depth to the plate interface (12 km near the
                    coast; Eberhart-Phillips & Reyners, 1999; Williams et al., 2013) make the northern Hikurangi Margin an ideal
                    location to investigate the various types of slip behaviors that occur on and near the subduction zone
                    interface. These SSEs, observed since 2002, are primarily short in duration (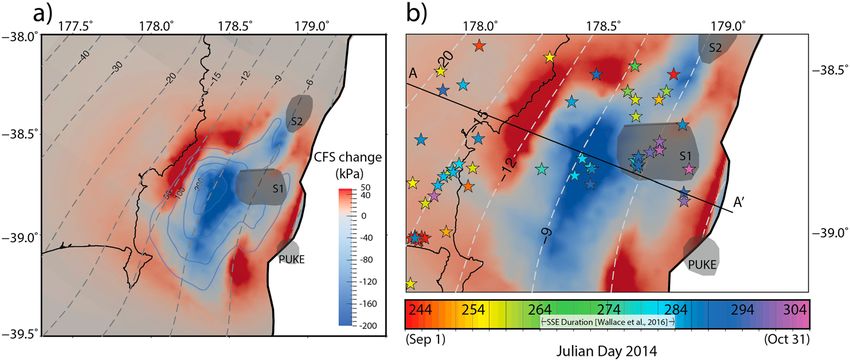
Journal of Geophysical Research: Solid Earth                                                10.1029/2018JB016136

                    Hikurangi Margin have been rare in New Zealand’s brief historic record, large upper plate and intraslab events
                    such as the 1855 Wairarapa, 1863 and 1931 Hawke’s Bay, 2013 Cook Strait sequence, 2016 Te Araroa, and
                    2016 Kaikoura earthquakes dominate the recent seismic record and demonstrate the complex relationship
                    between upper plate and intraslab faulting and the megathrust.
                    The geodetic evidence for a largely creeping interface at northern Hikurangi (Wallace et al., 2004) coupled
                    with numerous subducting seamounts suggest that the conceptual model described in Wang and Bilek
                    (2011), whereby subducting seafloor roughness promotes creep could potentially apply to the northern
                    Hikurangi Margin. Subducting seamounts and the resulting complex shear network on the plate interface
                    and in the upper plate could explain the subduction-related strain accumulation and release processes
                    there (see review in Wang & Bilek, 2014). Additionally, subducting seamounts are thought to aid in the
                    subduction of thick fluid-rich sediment packets that become overpressured as they are trapped downdip
                    of the seamount (Bassett et al., 2014; Bell et al., 2010; Ellis et al., 2015). To elucidate the relationship
                    between tremor, earthquakes, and shallow slow slip, and to understand their relative roles and relationship
                    to seamount subduction in northern Hikurangi subduction, we use data from the Hikurangi Ocean Bottom
                    Investigation of Tremor and Slow Slip (HOBITSS) experiment in concert with land-based seismic data to
                    detect and locate tremor and earthquakes during a large SSE offshore Gisborne in 2014. We also compute
                    the changes in Coulomb failure stress imparted on the plate interface by the SSE to estimate the impact
                    these SSEs have in influencing the occurrence and distribution of seismic slip processes on
                    the megathrust.

                    1.2. Seamount Subduction
                    Early studies on seamount subduction postulated that topographic relief of the subduction interface
                    increases interplate coupling and provides strongly locked areas that can promote failure in large great sub-
                    duction earthquakes (e.g., Cloos, 1992; Dmowska et al., 1996; Kelleher & McCann, 1976; Lay et al., 1982). More
                    recent studies of seamount subduction in regional and global contexts have found that seamounts likely
                    break through the upper plate, creating a complex network of fractures and subduct predominantly aseismi-
                    cally (e.g., Bassett & Watts, 2015; von Huene, 2008; Mochizuki et al., 2008; Pedley et al., 2010; Wang & Bilek,
                    2011, 2014; Yokota et al., 2016). Seamount subduction greatly impacts the evolution and morphology of
                    the Hikurangi Margin (Barker et al., 2009; Collot et al., 1996; Davy & Collot, 2000; Kukowski et al., 2010;
                    Lewis et al., 2004; Lewis & Pettinga, 1993; Pedley et al., 2010). By trapping fluid-rich sediments in front of
                    the seamount in what has been observed on seismic reflection profiles as regions of high-amplitude interface
                    reflectivity (HRZ; Bell et al., 2010) and generating a large, complex fracture network in the upper plate, sea-
                    mount subduction influences the budget and distribution of fluids on and around the plate interface, and
                    enhances heterogeneity of interface properties. The HRZ can become overpressurized if fluids released dur-
                    ing dehydration and compaction are trapped at the downdip edge of the seamount (Ellis et al., 2015). This
                    effect on overpressure is not well understood as the network of complex fractures generated by seamounts
                    breaking through the upper plate (Wang & Bilek, 2014) likely create pathways for fluid migration and the level
                    to which the HRZ can become overpressured is unconstrained. Slow slip is often observed in areas thought to
                    be highly overpressurized regions with low effective stress (e.g., Bassett et al., 2014; Bell et al., 2010; Kitajima &
                    Saffer, 2012; Kodaira et al., 2004) and seamounts predominantly subduct aseismically at shallow depths and
                    may promote weak interplate coupling (e.g., von Huene, 2008; Mochizuki et al., 2008; Wang & Bilek, 2011,
                    2014) where slow slip is the dominant form of interplate slip.
                    The presence of numerous seamounts impacting the shallow plate interface of the northern segment of the
                    Hikurangi Margin (Figure 1) coupled with the existence of recorded shallow slow slip along the much of the
                    segment suggest that very rough incoming plates are correlated with the occurrence of shallow episodic
                    slow slip. The northern Hikurangi Margin is established as a region of low interseismic coupling based on
                    GPS measurements (Wallace et al., 2004, 2009). Additionally, the shallow SSEs have been shown to accommo-
                    date much of the accumulated strain on the plate interface (Wallace & Beavan, 2010). Between Hawke’s Bay
                    and Tolaga Bay (Figure 1), the presence of subducted seamounts likely generates interplate failure in the form
                    of shallow slow slip and promotes the occurrence of tsunami earthquakes. The March (Mw 7.0–7.1) and May
                    (Mw 6.9–7.1) 1947 tsunami earthquakes offshore Gisborne and Tolaga Bay at the edges of seamounts S1 and
                    S2 (Bell et al., 2014) serve as further evidence that the northern margin is weakly coupled and predominantly
                    releases strain through slow slip and tsunami earthquakes.

TODD ET AL.                                                                                                                         6772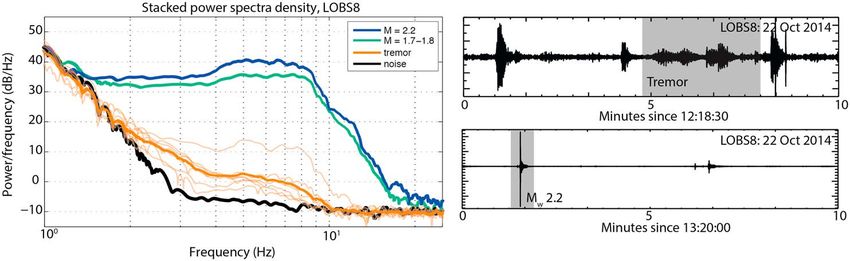
Journal of Geophysical Research: Solid Earth                                                        10.1029/2018JB016136

                                                                                   2. The HOBITSS Experiment
                                                                                   Since shallow slow slip along the northern Hikurangi is almost entirely off-
                                                                                   shore, determination of a high-resolution slip distribution is difficult using
                                                                                   only terrestrial observations and can be greatly improved with the use of
                                                                                   seafloor instrumentation directly above the slip patch (Figure 2). In May
                                                                                   2014, the HOBITSS experiment deployed 24 absolute pressure gauges
                                                                                   (APGs) in a near-source array to quantify the extent of seafloor deforma-
                                                                                   tion during the SSEs in this region (Wallace et al., 2016). Additionally, 15
                                                                                   ocean bottom seismometers (OBSs) were deployed to detect and locate
                                                                                   offshore tectonic tremor and microseismicity and improve the offshore
                                                                                   seismic velocity structure. OBS station spacing was densified around a
                                                                                   large subducted seamount (seamount S1 in Figure 1b) in order to investi-
Figure 2. New Zealand National Seismic Network stations (triangles) plotted
with ocean bottom seismometers (OBS; triangles) and absolute pressure              gate possible enhanced seismic activity associated with the seamount. By
gauges (APG; squares) from the HOBITSS experiment. The Hikurangi trench            combining slip distributions determined from seafloor geodetic data with
(solid black line) and megathrust depth contours (dashed gray lines) are           seismological data, we clarify the spatiotemporal relationship between
plotted (Williams et al., 2013) with respect to slip contours (solid blue lines;   slow slip, tremor, and seismicity to improve our understanding of the nat-
displacement in 50-mm contour intervals) from the 2014 Gisborne SSE
                                                                                   ure of deformation and stress transfer associated with slow slip. With a
(Wallace et al., 2016). The seismic stations with good timing that were used in
this study are in red.                                                             well-located offshore earthquake catalog and a well-defined offshore slow
                                                                                   slip patch, these data allow for a high-resolution examination of the spatial
                                                                                   extent of seismic and aseismic slip.
                                           Nine of the 15 OBS stations recorded data that could be used for detailed, time-sensitive analyses like tremor
                                           detection and phase identification used in earthquake location (EOBS 1–5 and LOBS 1, 2, 6, and 8; Figure 2).
                                           Unfortunately, two OBS stations did not record seismic data during the slow slip event and four OBS stations
                                           had moderate to severe timing errors associated with the seismic data. From the HOBITSS experiment, this
                                           study only employs data from the original nine OBS stations without timing errors or data
                                           corruption (Figure 2).
                                           A large SSE (equivalent Mw 6.8) occurred in September/October 2014 directly beneath the array and a mod-
                                           erate SSE occurred in December 2014/January 2015 to the south of the array (offshore Mahia Peninsula). Slip
                                           from the September/October Gisborne SSE covered an area of approximately 70 by 100 km between 12- and
                                           200 mm) was located due east of Poverty Bay at around 9-
                                           km depth beneath the continental shelf (Wallace et al., 2016). This study provides a detailed analysis of the
                                           spatial and temporal relationships between slow slip, tremor, and earthquakes for the September/October
                                           2014 Gisborne SSE with respect to subducted seamounts using seismic and cGPS data from land stations
                                           in the New Zealand National Seismic Network (operated by GeoNet; www.geonet.org.nz) in concert with data
                                           from the HOBITSS experiment.

                                           3. Methods
                                           3.1. Tremor Detection and Location
                                           Offshore tectonic tremor is detected and located using the same modified version of the automated envel-
                                           ope cross correlation and grid search methodology described in Todd and Schwartz (2016). Due to increased
                                           noise on OBS stations below 3 Hz, the 2–5-Hz band-pass filter used to detect tremor with land stations from
                                           the New Zealand National Seismic Network does not adequately isolate tremor energy from background
                                           noise or energy from local and regional earthquakes. As a result, envelopes for cross correlation are defined
                                           by applying a band-pass filter in two frequency ranges: (1) 4–10 Hz to isolate tremor with energy at lower fre-
                                           quencies and (2) 12–20 Hz to remove local earthquake detections that retain energy above 12 Hz. We analyze
                                           the horizontal component of ground motion from four broadband and five short-period ocean bottom
                                           seismometers in addition to three land-based coastal seismic stations to increase azimuthal coverage around
                                           the geodetically detected slow slip patch for September and October 2014 (Figure 2). Tremor is detected
                                           when cross-correlation coefficients on a minimum of seven station pairs exceeds 0.6. When adequate corre-
                                           lations are detected for at least five station pairs in the 12–20-Hz band, the time window is skipped to
                                           minimize local earthquake detections. To minimize false detections from regional or teleseismic waves
                                           depleted in high-frequency energy, data from a reference station located outside the study region are

TODD ET AL.                                                                                                                                               6773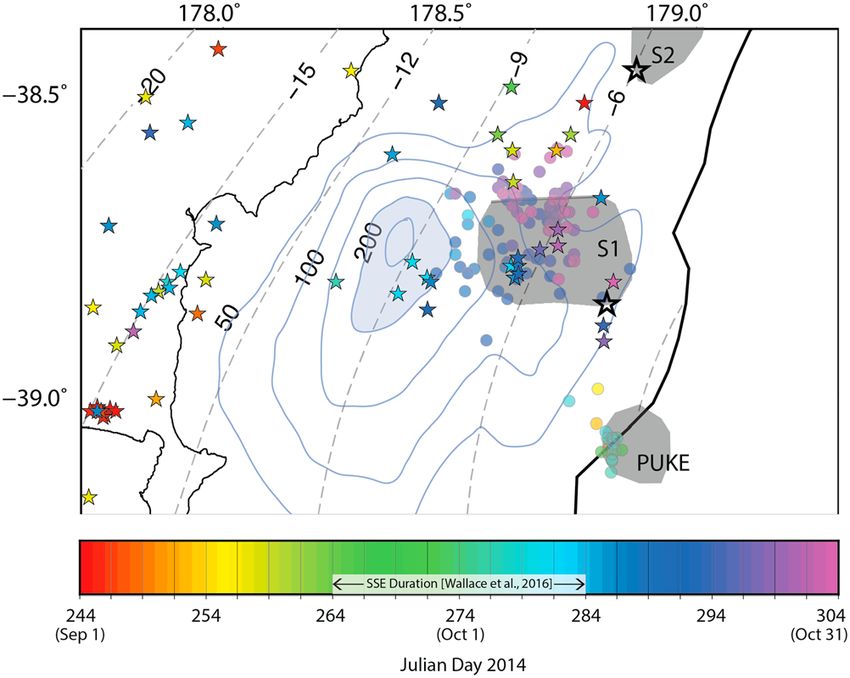
Journal of Geophysical Research: Solid Earth                                                     10.1029/2018JB016136

                    Figure 3. (left) Stacked power spectral densities for earthquakes, tremor (bold orange), and background noise at station
                    LOBS8. Power spectral densities for several individual tremor bursts are shown in light orange. Tremor signals remain
                    above the noise above 2 Hz and fall off rapidly with a corner frequency ~7 Hz, reaching noise levels by 10 Hz. Nearby
                    earthquakes have a higher corner frequency and retain energy above 10 Hz before dropping to noise levels ~25–30 Hz.
                    Noise on OBS drops off between 2 and 3 Hz; therefore, tremor signals have the highest signal to noise at 4–10 Hz. (right) Ten
                    minutes of seismic data from station LOBS8 band-pass filtered at 4–10 Hz with short bursts of tremor (top) and a local Mw
                    2.2 earthquake (bottom) highlighted in gray. Amplitude scales are scaled to peak amplitudes and differ by 1 order of
                    magnitude between top and bottom plots. Abundant microseismicity and noisy OBS stations make the detection of low-
                    amplitude tremor signals difficult for extended durations. Another example of tremor signal on OBS is down in Figure S1.

                    filtered from 4–10 Hz and cross correlated with the HOBITSS network. When correlations are detected for at
                    least three station pairs that include the reference station, that time window is removed from further
                    consideration. Though they limit the amount of detected tremor, these steps reduce the number of false
                    tremor detections from the automated process. Once detected, tremor is located by applying the grid
                    search optimization technique described in Wech and Creager (2008) to find centroid locations that
                    minimize S wave travel times between the tremor source and correlated station pairs. Since tremor depth
                    is shallow, but poorly constrained, we assume that tremor is located on the plate interface or on thrust
                    faults within the overriding accretionary prism (e.g., Barker et al., 2009; Barnes et al., 2010; Bell et al., 2010).
                    Tremor event details are presented in Table S1.
                    To ensure that the tremor signal is distinct from local microearthquakes, we compare the spectral character-
                    istics of the tremor signal to that of nearby earthquakes. The power spectral densities for 56 ten-second time
                    windows of tremor are compared to background noise and nearby earthquakes thought to be on the plate
                    interface at station LOBS8 (Figure 3). These earthquakes are distinguished from tremor because they retain
                    high-frequency energy above 10 Hz while tremor is indistinguishable from noise above 10 Hz. Additionally,
                    background noise on OBS stations remains high until 2–3 Hz, so tremor signals are most apparent between 4–
                    10 Hz.

                    3.2. Detecting and Locating Local Earthquakes
                    Earthquakes were manually detected for September and October 2014 by picking P wave arrivals at up to
                    nine OBS stations and 16 land seismic stations for over 850 visually identified events (Table S2). Using a local
                    1-D interpretation of the New Zealand 3-D velocity model (Eberhart-Phillips et al., 2010; Reyners et al., 1999),
                    preliminary hypocenters for over 600 events were found using Antelope’s dblocsat2 algorithm that minimizes
                    travel times over a 3-D grid search. Hypocentral locations were improved by relocating events with
                    NonLinLoc v.6.0, a probabilistic nonlinear relocation program that calculates the maximum likelihood hypo-
                    center within a probability density function through a 3-D grid search (Lomax et al., 2000). Horizontal location
                    errors as indicated by the probability density function are typically on the order of a few kilometers (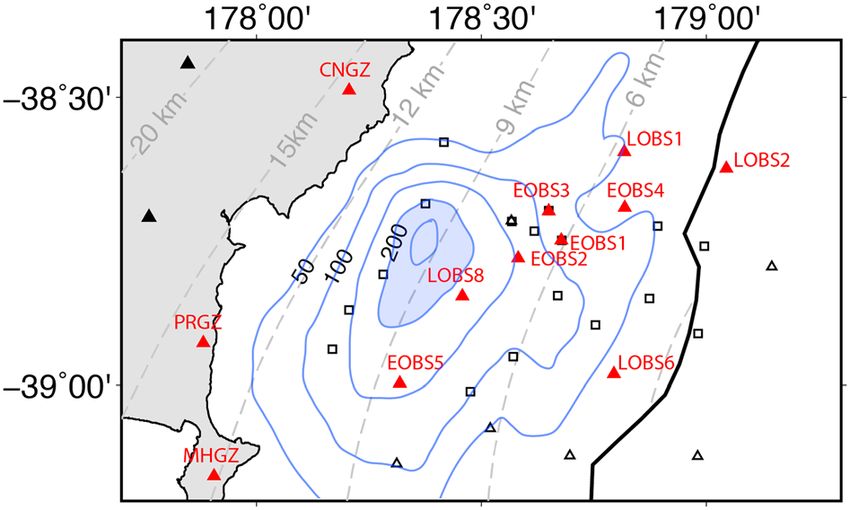
Journal of Geophysical Research: Solid Earth                                              10.1029/2018JB016136

                    experiment. The slip distribution with a slip cutoff value of 1 mm is transferred from the coarse grid used in
                    the geodetic inversion to the Hikurangi megathrust geometry and projected onto a finer-scale mesh using
                    bilinear interpolation and then smoothed to mitigate the effects of stress singularities due to gradients in
                    the original slip distribution. PyLith is then used to compute the traction changes for each element in the fault
                    mesh. We determine the change in Coulomb failure stress from the computed fault-normal stresses and map
                    the computed shear traction changes onto the direction of plate convergence (Wallace, Barnes, et al., 2012)
                    for each element in the mesh to calculate the shear stresses. We then use these stresses and a constant
                    apparent coefficient of friction of 0.4 to compute the change in Coulomb failure stress imparted on the mega-
                    thrust during the 2014 SSE.

                    4. Results and Discussion
                    4.1. Tremor Collocated With Slow Slip and Subducted Seamounts
                    Prior to the HOBITSS experiment, tremor could only be detected with seismic data from land stations after the
                    network achieved sufficient density in 2010. For the Gisborne SSEs, these detections are temporally corre-
                    lated with the SSEs and are predominantly located onshore in bands that extend west and northwest from
                    the downdip edge of geodetically detected slow slip (Figure 4). While northern Hikurangi tremor beneath
                    the land is temporally coincident with offshore SSEs (Kim et al., 2011; Todd & Schwartz, 2016), offshore tremor
                    spatially collocated with slow slip has not been previously observed. This is unlike most other tremorgenic
                    subduction zones such as Cascadia or Nankai where tremor occurring during slow slip is identified to be pre-
                    dominantly collocated with the slow slip patch (e.g., Ghosh et al., 2009; Ito et al., 2007). The slow slip with col-
                    located tremor in these regions is located significantly deeper (30–50 km) than slow slip along the northern
                    Hikurangi Margin (
Journal of Geophysical Research: Solid Earth 10.1029/2018JB016136
Figure 4. (a) Tectonic tremor associated with the 2014 Gisborne SSE. Offshore tremor (circles color coded by time) is pri-
marily located on and downdip of the estimated location of subducted seamount S1 from Bell et al. (2014), updip of the
peak displacement in the slip event. Onshore tremor events located with land-based stations in the New Zealand National
Seismic Network from Todd and Schwartz (2016) (dark gray circles) are located downdip of the peak slip extending in
the dip direction. We assume that tremor is located on the plate interface or on accretionary prism thrusts in the upper
plate. (b) Daily tremor count for September and October 2014 (JD 244–304) in blue and cumulative earthquake count in
red. The tremor rate begins to change in the middle of the geodetically detected slow slip (~JD 274) and changes signif-
icantly after the final days of the SSE (~JD 287).
Nankai with velocities of 5–15 km/day (Ide, 2010; Kao et al., 2006; McCausland et al., 2010; Obara & Sekine,
2009). This slow tremor migration velocity may be due to the shallow depth of the slip. Assuming the
tremor is located on or near the plate interface, this tremor migration occurs along strike between 3- and
9-km depth, beneath the accretionary wedge.
Both identifiable bursts of offshore tremor activity occur in the vicinity of the subducted seamounts Puke and
S1 (Figure 4), suggesting that a complicated network of shear fractures expected to surround the subducted
seamounts may influence tremorgenesis in the northern segment of the Hikurangi Margin. Although
TODD ET AL. 6776Journal of Geophysical Research: Solid Earth 10.1029/2018JB016136
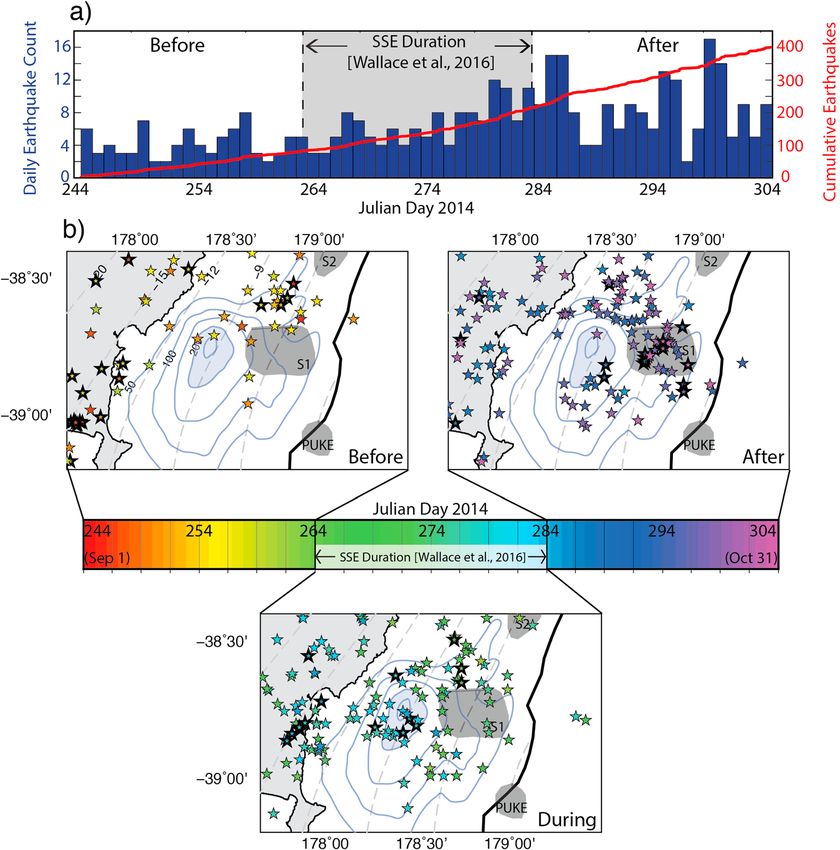
Figure 5. (a) Earthquakes (stars, color coded with time) before, during, and after geodetically detected slow slip with
respect to subducted seamounts and slow slip displacement. Events with bold outlines are located within 5 km of the
plate interface. Earthquakes are located in the region of peak slip at the start of the SSE and are concentrated on the north
edge of the slip patch after the SSE. (b) Daily earthquake count for September and October 2014 (JD 244–304) in blue and
cumulative earthquake count in red. The earthquake rate changes once the slow slip begins (~JD 264) and increases
more in the final days of the SSE around JD 278.
seamounts are suggested by some to primarily subduct aseismically (Mochizuki et al., 2008; Wang & Bilek,
2014), tectonic tremor, assumed to be located on the plate interface or on thrust faults within the
accretionary prism, that is strongly spatially correlated with slow slip and seamounts may be a seismic
manifestation of seamount subduction. Additionally, the complex fracture pattern generated by the
“breaking through” method of seamount subduction (Dominguez et al., 1998; Ruh et al., 2016; Wang &
Bilek, 2011, 2014) creates numerous connected fluid pathways that could promote low-magnitude slow
slip across the seamount.
4.2. Seismicity Before, During, and After Slow Slip
Clear seismicity increases do not accompany every shallow SSE along the northern Hikurangi Margin, but sig-
nificant increases have been identified during the largest shallow SSEs such as the 2004 and 2010 Gisborne
SSEs, and the 2011 Cape Turnagain SSE (Bartlow et al., 2014; Delahaye et al., 2009; Jacobs et al., 2016; Wallace,
Beavan, et al., 2012). The 2014 Gisborne SSE has a small increase in seismicity starting at the beginning of the
geodetically detected slip that continues for several days with the largest increase in seismicity rate occurring
toward the end of the slip event. Focusing on earthquakes located near the shoreline and offshore provides a
detailed look at where earthquakes are occurring before, during, and after the 2014 Gisborne SSE (Figure 5).
For the purposes of this discussion, earthquakes that locate within 5-km depth of the plate interface
TODD ET AL. 6777Journal of Geophysical Research: Solid Earth 10.1029/2018JB016136
Figure 6. (a) Calculations of the Coulomb failure stress change (CFS) imparted on the megathrust by the 2014 Gisborne
SSE. Regions of stress increase are shown in red and regions of stress decrease are shown in blue. (b) Earthquakes (stars,
color coded with time) located within 5 km of the plate interface (and assumed to be on the plate interface for the purposes
of this discussion) are plotted with the CFS change and seamounts Puke, S1, and S2. Stress changes from the SSE do
not appear to greatly impact interplate faulting. Depths of earthquakes along transect A-A0 are plotted in Figure S2.
determined by Williams et al. (2013) are considered to be interplate earthquakes (Figure S2). Interplate
earthquakes detected before the SSE are primarily located onshore between Poverty Bay and the Mahia
Peninsula or offshore, north of seamount S1, and downdip from seamount S2 in the region that will slip in
the event between 6- and 9-km depth. Once the SSE begins, earthquakes continue at the updip edge of
the slip, adjacent to seamount S1 until ~JD 279 when several earthquakes occur on the plate interface
(within 5 km) in the vicinity of the peak displacement (>200 mm) from the slow slip. The presence of
interplate earthquakes in the northern finger of the slip patch, prior to the geodetically determined onset
of slow slip, followed by earthquakes in close proximity to the peak displacement suggests that slow slip
may have initiated in the north, downdip of seamount S2 as early as JD 252 before advancing southward
along strike. After the end of geodetically detected slow slip, earthquake activity in the peak slow slip
patch ceases and seismicity clusters near seamount S1 (Figure 5) very similar to the tremor behavior
(Figure S3). These events are too small to determine focal mechanisms for, but are limited to be within
5-km depth of the plate interface and may be located in the fractures above the seamount. Since the slow
slip is offshore, small offshore earthquake sequences may accompany all Gisborne SSEs, but are difficult to
detect with the land-based seismic network.
4.3. Change in Coulomb Failure Stress on Megathrust From Slow Slip
The relationship between the distribution of aftershocks and the static increase in Coulomb failure stress
(CFS) has been well established (e.g., Stein, 1999; Stein et al., 1992; Stein & Lisowski, 1983; Toda et al.,
1998). Additionally, earthquakes, tectonic tremor, and slow slip events can be dynamically triggered by the
passage of seismic waves from regional and teleseismic earthquakes (e.g., Chao et al., 2013; Fry et al., 2011;
Hill et al., 1993; Peng et al., 2009; Prejean et al., 2004; Wallace et al., 2017; Zigone et al., 2012). To further inves-
tigate the relationship between slow slip, tremor, and earthquakes on or near the plate interface we compute
the change in CFS on the plate interface and look at the regions of stress increase with respect to the tremor
and earthquake distribution during and after the 2014 Gisborne SSE. Tectonic tremor predominantly occurs
near the end and continues after the geodetically observed slow slip event. The temporal delay in the
occurrence of tremor may be triggered by stress changes induced by the slow slip. Results from our CFS
calculations are shown in Figure 6 where most of the slow slip region experiences a decrease of >30 kPa
(peak ~180 kPa). The only part of the slow slip patch that does not experience a stress decrease >30 kPa is
where seamount S1 is located. Slip inversions with land stations and the APG data predict less displacement
(30 kPa with a peak of around 50 kPa in a region where tre-
mor associated with SSEs has been previously observed (Kim et al., 2011; Todd & Schwartz, 2016). A CFS
increase is also experienced updip of the southern part of the slow slip patch with an increase of >30 kPa.
TODD ET AL. 6778Journal of Geophysical Research: Solid Earth 10.1029/2018JB016136
These values of CFS increase are similar to the increases computed for reg-
ular earthquakes similar in magnitude to the 2014 Gisborne SSE (equiva-
lent Mw 6.7–6.8). For example, the 2002 Mw 6.7 Nenana Mountain
earthquake, a foreshock to the Mw 7.9 Denali earthquake, generated a
CFS increase of 30–50 kPa in the hypocentral region of the main shock
(Anderson & Ji, 2003).
Earthquakes within 5 km of the plate interface are plotted with the CFS
change calculations in Figure 6b and are considered to be on the plate
interface for the purposes of this study (Figures S2 and S3). These earth-
quakes are clustered at the northern edge of the slow slip patch, within
and immediately north of seamount S1. Earthquakes within the slow slip
patch begin around JD 278–284 in the region that experiences the great-
est displacement (>150 mm) and the greatest decrease in CFS in the final
days of the geodetically detected slip event. Since the slip distribution of
the SSE is applied as an instantaneous event, we cannot see the time evo-
lution of the slip and stress changes. Time-dependent slip inversions are
Figure 7. Various modes of slip on the plate interface (depth contours are needed to obtain a higher-resolution view of the change in CFS with time.
dashed gray lines; labeled in km) are plotted together with the subducted During the same time period, earthquakes occur downdip of the slow slip
seamounts Puke, S1, and S2 (Bell et al., 2014). Slow slip displacement (blue patch along the coast between Poverty Bay and the Mahia Peninsula as
contours; displacement in mm), tectonic tremor (circles), and interplate
earthquakes (stars). The 1947 tsunami earthquake epicenters plotted as open
well as along the northern coast of Hawke’s Bay. Interestingly, there is no
black stars. clear concentration of earthquakes on the megathrust in the regions
experiencing the largest increase in CFS. Rather, many of the event loca-
tions appear to be unrelated to the CFS increases. The same is true of the tremor, since tremor clustered near
seamount S1, similar to the interplate earthquake locations. With the majority of earthquakes and tremor
occurring near seamount S1 and Puke seamount, it appears as though the subduction of these seamounts
dominates the stress field and plays a large role in the localization of interplate seismicity. Of course, unmo-
deled details and complexities in the slow slip distribution and the geometry of the subduction interface can
have a large affect on the resulting CFS calculations.
4.4. Slip Heterogeneity on the Shallow Megathrust
Figure 7 illustrates the location of the diverse modes of interplate slip associated with the 2014 Gisborne SSE.
Each unique mode, (1) fast, regular earthquakes; (2) tremor; (3) tsunami earthquakes (such as the 1947
events); and (4) large, geodetically detected slow slip, are largely interspersed together. While the majority
of the shallow plate interface at the northern Hikurangi Margin slips too slowly to radiate seismic energy,
some small patches, clustered near seamounts, slip fast enough to generate tremor while larger patches
are able to nucleate microseismicity and even tsunami earthquakes (e.g., 1947 events). This observation sup-
ports a model where seamount subduction produces a heterogeneous stress state, a complex fracture sys-
tem, and pore fluid pressure conditions capable of hosting a wide range of transient events with varied
magnitudes and slip rates in close proximity. Similar observations have been made offshore central
Ecuador where seismic imaging of subducted oceanic relief together with GPS data from coastal and island
sites resolve heterogeneous shallow plate coupling consisting of locked patches, frequent slow slip events,
and repeating earthquake swarms (Collot et al., 2017; Vallée et al., 2013). Collot et al. (2017) speculate that
stress increases due to slow slip events generate seismic rupture on secondary faults close to failure within
the subducted seafloor relief. We invoke a similar process to explain the close association of earthquakes
and tremor with subducted seamounts in the Hikurangi subduction zone. Further analysis of these events
is warranted to determine if they are on the plate interface, in the fractured upper plate above the seamount,
or in the subducted plate. The tsunami earthquake of March 1947 also originated near seamount S1 and may
have ruptured across the seamount (Bell et al., 2014), further suggesting that this seamount may be influen-
cing the stress state and mechanisms of interplate slip.
5. Conclusions
One primary goal of the HOBITSS experiment was to determine if slow and fast interplate slip modes (i.e., slow
slip, tremor, and microseismicity) spatially overlap or were segregated. The northern segment of the
TODD ET AL. 6779Journal of Geophysical Research: Solid Earth 10.1029/2018JB016136
Hikurangi Margin experiences seamount subduction that produces a heterogeneous environment that hosts
a range of interfingered interplate slip processes. Using data from the HOBITSS experiment, we find that tre-
mor is not only temporally correlated with slow slip as it occurs onshore, downdip of the slip patch, but is
collocated with slow slip offshore. We detect two distinct tremor episodes that strongly overlap in space with
the locations of two shallowly (Journal of Geophysical Research: Solid Earth 10.1029/2018JB016136
Doser, D. I., & Webb, T. H. (2003). Source parameters of large historical (1917–1961) earthquakes, North Island, New Zealand. Geophysical
Journal International, 152(3), 795–832. https://doi.org/10.1046/j.1365-246X.2003.01895.x
Douglas, A., Beavan, J., Wallace, L. M., & Townend, J. (2005). Slow slip on the northern Hikurangi subduction interface, New Zealand.
Geophysical Research Letters, 32, L16305. https://doi.org/10.1029/2005GL023607
Dragert, H., Wang, K., & James, T. S. (2001). A silent slip event on the deeper Cascadia subduction interface. Science, 292(5521), 1525–1528.
https://doi.org/10.1126/science.1060152
Eberhart-Phillips, D., & Bannister, S. (2015). 3-D imaging of the northern Hikurangi subduction zone, New Zealand: Variations in subducted
sediment, slab fluids and slow slip. Geophysical Journal International, 201(2), 838–855. https://doi.org/10.1093/gji/ggv057
Eberhart-Phillips, D., & Chadwick, M. (2002). Three-dimensional attenuation model of the shallow Hikurangi subduction zone in the
Raukumara Peninsula, New Zealand. Journal of Geophysical Research, 107(B2), 2033. https://doi.org/10.1029/2000JB000046
Eberhart-Phillips, D., & Reyners, M. (1999). Plate interface properties in the Northeast Hikurangi Subduction Zone, New Zealand, from con-
verted seismic waves. Geophysical Research Letters, 26(16), 2565–2568. https://doi.org/10.1029/1999GL900567
Eberhart-Phillips, D., Reyners, M., Bannister, S., Chadwick, M., & Ellis, S. (2010). Establishing a versatile 3-D seismic velocity model for New
Zealand. Seismological Research Letters, 81(6), 992–1000. https://doi.org/10.1785/gssrl.81.6.992
Eiby, G. A. (1982). Two New Zealand tsunamis. Journal of the Royal Society of New Zealand, 12(4), 338–351. https://doi.org/10.1080/
03036758.1982.10415340
Ellis, S., Fagereng, Å., Barker, D., Henrys, S., Saffer, D., Wallace, L. M., et al. (2015). Fluid budgets along the northern Hikurangi subduction
margin, New Zealand: The effect of a subducting seamount on fluid pressure. Geophysical Journal International, 202(1), 277–297. https://
doi.org/10.1093/gji/ggv127
Fry, B., Chao, K., Bannister, S., Peng, Z., & Wallace, L. M. (2011). Deep tremor in New Zealand triggered by the 2010 Mw8.8 Chile earthquake.
Geophysical Research Letters, 38, L15306. https://doi.org/10.1029/2011GL048319
Ghosh, A., Vidale, J. E., Sweet, J. R., Creager, K. C., & Wech, A. G. (2009). Tremor patches in Cascadia revealed by seismic array analysis.
Geophysical Research Letters, 36, L17316. https://doi.org/10.1029/2009GL039080
Hill, D. P., Reasenberg, P. A., Michael, A., Arabaz, W. J., Beroza, G., Brumbaugh, D., et al. (1993). Seismicity remotely triggered by the magnitude
7.3 Landers, California, earthquake. Science, 260(5114), 1617–1623.
Hirose, H., Hirahara, K., Kimata, F., Fujii, N., & Miyazaki, S. (1999). A slow thrust slip event following the two 1996 Hyuganada earthquakes
beneath the Bungo Channel, southwest Japan. Geophysical Research Letters, 26(21), 3237–3240. https://doi.org/10.1029/1999GL010999
Hirose, H., & Obara, K. (2005). Repeating short- and long-term slow slip events with deep tremor activity around the Bungo channel region,
southwest Japan. Earth, Planets and Space, 57(10), 961–972. https://doi.org/10.1186/BF03351875
Ide, S. (2010). Striations, duration, migration and tidal response in deep tremor. Nature, 466(7304), 356–359. https://doi.org/10.1038/
nature09251
Ito, Y., Obara, K., Shiomi, K., Sekine, S., & Hirose, H. (2007). Slow earthquakes coincident with episodic tremors and slow slip events. Science,
315(5811), 503–506. https://doi.org/10.1126/science.1134454
Jacobs, K. M., Savage, M. K., & Smith, E. C. G. (2016). Quantifying seismicity associated with slow slip events in the Hikurangi margin, New
Zealand. New Zealand Journal of Geology and Geophysics, 59(1), 58–69. https://doi.org/10.1080/00288306.2015.1127827
Jiang, Y., Wdowinski, S., Dixon, T. H., Hackl, M., Protti, M., & Gonzalez, V. (2012). Slow slip events in Costa Rica detected by continuous GPS
observations, 2002–2011. Geochemistry, Geophysics, Geosystems, 13, Q04006. https://doi.org/10.1029/2012GC004058
Kanamori, H. (1972). Mechanism of tsunami earthquakes. Physics of the Earth and Planetary Interiors, 6(5), 346–359. https://doi.org/10.1016/
0031-9201(72)90058-1
Kao, H., Shan, S.-J., Dragert, H., Rogers, G., Cassidy, J. F., Wang, K., et al. (2006). Spatial-temporal patterns of seismic tremors in northern
Cascadia. Journal of Geophysical Research, 111, B03309. https://doi.org/10.1029/2005JB003727
Kaproth, B. M., & Marone, C. (2013). Slow earthquakes, preseismic velocity changes, and the origin of slow frictional stick-slip. Science,
341(6151), 1229–1232. https://doi.org/10.1126/science.1239577
Kelleher, J., & McCann, W. (1976). Buoyant zones, great earthquakes, and unstable boundaries of subduction. Journal of Geophysical Research,
81(26), 4885–4896. https://doi.org/10.1029/JB081i026p04885
Kim, M. J., Schwartz, S. Y., & Bannister, S. (2011). Non-volcanic tremor associated with the March 2010 Gisborne slow slip event at the
Hikurangi subduction margin, New Zealand. Geophysical Research Letters, 38, L14301. https://doi.org/10.1029/2011GL048400
Kitajima, H., & Saffer, D. M. (2012). Elevated pore pressure and anomalously low stress in regions of low frequency earthquakes along the
Nankai Trough subduction megathrust. Geophysical Research Letters, 39, L23301. https://doi.org/10.1029/2012GL053793
Kodaira, S., Iidaka, T., Kato, A., Park, J.-O., Iwasaki, T., & Kaneda, Y. (2004). High pore fluid pressure may cause silent slip in the Nankai Trough.
Science, 304(5675), 1295–1298. https://doi.org/10.1126/science.1096535
Kostoglodov, V., Singh, S. K., Santiago, J. A., Franco, S. I., Larson, K. M., Lowry, A. R., & Bilham, R. (2003). A large silent earthquake in the
Guerrero seismic gap, Mexico. Geophysical Research Letters, 30(15), 1807. https://doi.org/10.1029/2003GL017219
Kukowski, N., Greinert, J., & Henrys, S. (2010). Morphometric and critical taper analysis of the Rock Garden region, Hikurangi Margin, New
Zealand: Implications for slope stability and potential tsunami generation. Marine Geology, 272(1–4), 141–153. https://doi.org/10.1016/j.
margeo.2009.06.004
Lay, T., Kanamori, H., & Ruff, L. (1982). The asperity model and the nature of large subduction zone earthquakes. Earthquake Prediction
Research, 1(1), 3–71.
Leeman, J., Scuderi, M. M., Marone, C., & Saffer, D. (2015). Stiffness evolution of granular layers and the origin of repetitive, slow, stick-slip
frictional sliding. Granular Matter, 17(4), 447–457. https://doi.org/10.1007/s10035-015-0565-1
Lewis, K. B., Collot, J.-Y., & Lallem, S. E. (1998). The dammed Hikurangi Trough: A channel-fed trench blocked by subducting seamounts and
their wake avalanches (New Zealand–France GeodyNZ Project). Basin Research, 10(4), 441–468. https://doi.org/10.1046/j.1365-
2117.1998.00080.x
Lewis, K. B., Lallemand, S. E., & Carter, L. (2004). Collapse in a Quaternary shelf basin off East Cape, New Zealand: Evidence for passage of a
subducted seamount inboard of the Ruatoria giant avalanche. New Zealand Journal of Geology and Geophysics, 47(3), 415–429. https://doi.
org/10.1080/00288306.2004.9515067
Lewis, K. B., & Pettinga, J. R. (1993). The emerging, imbricate frontal wedge of the Hikurangi margin. Sedimentary Basins of the World, 2,
225–250.
Liu, Y., & Rice, J. R. (2007). Spontaneous and triggered aseismic deformation transients in a subduction fault model. Journal of Geophysical
Research, 112, B09404. https://doi.org/10.1029/2007JB004930
Lomax, A., Virieux, J., Volant, P., & Berge-Thierry, C. (2000). Probabilistic earthquake location in 3D and layered models. In C. H. Thurber &
N. Rabinowitz (Eds.), Advances in Seismic Event Location (pp. 101–134). Netherlands: Springer. https://doi.org/10.1007/978-94-015-9536-0_5
TODD ET AL. 6781Journal of Geophysical Research: Solid Earth 10.1029/2018JB016136
McCausland, W. A., Creager, K. C., La Rocca, M., & Malone, S. D. (2010). Short-term and long-term tremor migration patterns of the Cascadia
2004 tremor and slow slip episode using small aperture seismic arrays. Journal of Geophysical Research, 115, B00A24. https://doi.org/
10.1029/2008JB006063
Mochizuki, K., Yamada, T., Shinohara, M., Yamanaka, Y., & Kanazawa, T. (2008). Weak interplate coupling by seamounts and repeating M~7
earthquakes. Science, 321(5893), 1194–1197. https://doi.org/10.1126/science.1160250
Obara, K., Hirose, H., Yamamizu, F., & Kasahara, K. (2004). Episodic slow slip events accompanied by non-volcanic tremors in southwest Japan
subduction zone. Geophysical Research Letters, 31, L23602. https://doi.org/10.1029/2004GL020848
Obara, K., & Sekine, S. (2009). Characteristic activity and migration of episodic tremor and slow-slip events in central Japan. Earth, Planets and
Space, 61(7), 853–862. https://doi.org/10.1186/BF03353196
Ohta, Y., Freymueller, J. T., Hreinsdóttir, S., & Suito, H. (2006). A large slow slip event and the depth of the seismogenic zone in the south
central Alaska subduction zone. Earth and Planetary Science Letters, 247(1–2), 108–116. https://doi.org/10.1016/j.epsl.2006.05.013
Outerbridge, K. C., Dixon, T. H., Schwartz, S. Y., Walter, J. I., Protti, M., Gonzalez, V., et al. (2010). A tremor and slip event on the Cocos-Caribbean
subduction zone as measured by a Global Positioning System (GPS) and seismic network on the Nicoya Peninsula, Costa Rica. Journal of
Geophysical Research, 115, B10408. https://doi.org/10.1029/2009JB006845
Ozawa, S., Miyazaki, S., Hatanaka, Y., Imakiire, T., Kaidzu, M., & Murakami, M. (2003). Characteristic silent earthquakes in the eastern part of the
Boso peninsula, Central Japan. Geophysical Research Letters, 30(6), 1283. https://doi.org/10.1029/2002GL016665
Pedley, K. L., Barnes, P. M., Pettinga, J. R., & Lewis, K. B. (2010). Seafloor structural geomorphic evolution of the accretionary frontal wedge in
response to seamount subduction, Poverty Indentation, New Zealand. Marine Geology, 270(1–4), 119–138. https://doi.org/10.1016/j.
margeo.2009.11.006
Pelayo, A. M., & Wiens, D. A. (1992). Tsunami earthquakes: Slow thrust-faulting events in the accretionary wedge. Journal of Geophysical
Research, 97(B11), 15,321–15,337. https://doi.org/10.1029/92JB01305
Peng, Z., & Gomberg, J. (2010). An integrated perspective of the continuum between earthquakes and slow-slip phenomena. Nature
Geoscience, 3(9), 599–607. https://doi.org/10.1038/ngeo940
Peng, Z., Vidale, J. E., Wech, A. G., Nadeau, R. M., & Creager, K. C. (2009). Remote triggering of tremor along the San Andreas Fault in central
California. Journal of Geophysical Research, 114, B00A06. https://doi.org/10.1029/2008JB006049
Prejean, S. G., Hill, D. P., Brodsky, E. E., Hough, S. E., Johnston, M. J. S., Malone, S. D., et al. (2004). Remotely triggered seismicity on the United
States West Coast following the Mw 7.9 Denali Fault earthquake. Bulletin of the Seismological Society of America, 94(6B), S348–S359. https://
doi.org/10.1785/0120040610
Protti, M., González, V., Kato, T., Iinuma, T., Miyazaki, S., Obana, K., et al. (2004). A creep event on the shallow interface of the Nicoya Peninsula,
Costa Rica seismogenic zone. AGU Fall Meeting Abstracts, 41. Retrieved from http://adsabs.harvard.edu/abs/2004AGUFM.S41D..07P
Radiguet, M., Perfettini, H., Cotte, N., Gualandi, A., Valette, B., Kostoglodov, V., et al. (2016). Triggering of the 2014 Mw7.3 Papanoa earthquake
by a slow slip event in Guerrero, Mexico. Nature Geoscience, 9(11), 829–833. https://doi.org/10.1038/ngeo2817
Reyners, M., Eberhart-Phillips, D., & Stuart, G. (1999). A three-dimensional image of shallow subduction: Crustal structure of the Raukumara
Peninsula, New Zealand. Geophysical Journal International, 137(3), 873–890. https://doi.org/10.1046/j.1365-246x.1999.00842.x
Ruh, J. B., Sallarès, V., Ranero, C. R., & Gerya, T. (2016). Crustal deformation dynamics and stress evolution during seamount subduction: High-
resolution 3-D numerical modeling. Journal of Geophysical Research: Solid Earth, 121, 6880–6902. https://doi.org/10.1002/2016JB013250
Saffer, D. M., & Wallace, L. M. (2015). The frictional, hydrologic, metamorphic and thermal habitat of shallow slow earthquakes. Nature
Geoscience, 8(8), 594–600. https://doi.org/10.1038/ngeo2490
Schwartz, S. Y., & Rokosky, J. M. (2007). Slow slip events and seismic tremor at circum-Pacific subduction zones. Reviews of Geophysics, 45,
RG3004. https://doi.org/10.1029/2006RG000208
Segall, P., Rubin, A. M., Bradley, A. M., & Rice, J. R. (2010). Dilatant strengthening as a mechanism for slow slip events. Journal of Geophysical
Research, 115, B12305. https://doi.org/10.1029/2010JB007449
Shibazaki, B., & Iio, Y. (2003). On the physical mechanism of silent slip events along the deeper part of the seismogenic zone. Geophysical
Research Letters, 30(9), 1489. https://doi.org/10.1029/2003GL017047
Stein, R. S. (1999). The role of stress transfer in earthquake occurrence. Nature, 402(6762), 605–609. https://doi.org/10.1038/45144
Stein, R. S., King, G. C. P., & Lin, J. (1992). Change in failure stress on the Southern San Andreas Fault System caused by the 1992 magni-
tude = 7.4 Landers earthquake. Science, 258(5086), 1328–1332.
Stein, R. S., & Lisowski, M. (1983). The 1979 Homestead Valley earthquake sequence, California: Control of aftershocks and postseismic
deformation. Journal of Geophysical Research, 88(B8), 6477–6490. https://doi.org/10.1029/JB088iB08p06477
Toda, S., Stein, R. S., Reasenberg, P. A., Dieterich, J. H., & Yoshida, A. (1998). Stress transferred by the 1995 Mw = 6.9 Kobe, Japan, shock: Effect
on aftershocks and future earthquake probabilities. Journal of Geophysical Research, 103(B10), 24,543–24,565. https://doi.org/10.1029/
98JB00765
Todd, E. K., & Schwartz, S. Y. (2016). Tectonic tremor along the northern Hikurangi Margin, New Zealand, between 2010 and 2015. Journal of
Geophysical Research: Solid Earth, 121, 8706–8719. https://doi.org/10.1002/2016JB013480
Vallée, M., Nocquet, J.-M., Battaglia, J., Font, Y., Segovia, M., Régnier, M., et al. (2013). Intense interface seismicity triggered by a shallow slow
slip event in the Central Ecuador subduction zone. Journal of Geophysical Research: Solid Earth, 118, 2965–2981. https://doi.org/10.1002/
jgrb.50216
von Huene, R. (2008). When Seamounts Subduct. Science, 321(5893), 1165–1166. https://doi.org/10.1126/science.1162868
Wallace, L. M., Barnes, P. M., Beavan, J., Van Dissen, R., Litchfield, N., Mountjoy, J., et al. (2012). The kinematics of a transition from subduction
to strike-slip: An example from the central New Zealand plate boundary. Journal of Geophysical Research, 117, B02405. https://doi.org/
10.1029/2011JB008640
Wallace, L. M., & Beavan, J. (2010). Diverse slow slip behavior at the Hikurangi subduction margin, New Zealand. Journal of Geophysical
Research, 115, B12402. https://doi.org/10.1029/2010JB007717
Wallace, L. M., Beavan, J., Bannister, S., & Williams, C. (2012). Simultaneous long-term and short-term slow slip events at the Hikurangi sub-
duction margin, New Zealand: Implications for processes that control slow slip event occurrence, duration, and migration. Journal of
Geophysical Research, 117, B11402. https://doi.org/10.1029/2012JB009489
Wallace, L. M., Beavan, J., McCaffrey, R., & Darby, D. (2004). Subduction zone coupling and tectonic block rotations in the North Island, New
Zealand. Journal of Geophysical Research, 109, B12406. https://doi.org/10.1029/2004JB003241
Wallace, L. M., Kaneko, Y., Hreinsdóttir, S., Hamling, I., Peng, Z., Bartlow, N., et al. (2017). Large-scale dynamic triggering of shallow slow slip
enhanced by overlying sedimentary wedge. Nature Geoscience, 10(10), 765–770. https://doi.org/10.1038/ngeo3021
Wallace, L. M., Reyners, M., Cochran, U., Bannister, S., Barnes, P. M., Berryman, K., et al. (2009). Characterizing the seismogenic zone of a major
plate boundary subduction thrust: Hikurangi Margin, New Zealand. Geochemistry, Geophysics, Geosystems, 10, Q10006. https://doi.org/
10.1029/2009GC002610
TODD ET AL. 6782Journal of Geophysical Research: Solid Earth 10.1029/2018JB016136
Wallace, L. M., Webb, S. C., Ito, Y., Mochizuki, K., Hino, R., Henrys, S., et al. (2016). Slow slip near the trench at the Hikurangi subduction zone,
New Zealand. Science, 352(6286), 701–704. https://doi.org/10.1126/science.aaf2349
Wang, K., & Bilek, S. L. (2011). Do subducting seamounts generate or stop large earthquakes? Geology, 39(9), 819–822. https://doi.org/
10.1130/G31856.1
Wang, K., & Bilek, S. L. (2014). Invited review paper: Fault creep caused by subduction of rough seafloor relief. Tectonophysics, 610, 1–24.
https://doi.org/10.1016/j.tecto.2013.11.024
Wech, A. G., & Creager, K. C. (2008). Automated detection and location of Cascadia tremor. Geophysical Research Letters, 35, L20302. https://
doi.org/10.1029/2008GL035458
Wech, A. G., Creager, K. C., & Melbourne, T. I. (2009). Seismic and geodetic constraints on Cascadia slow slip. Journal of Geophysical Research,
114, B10316. https://doi.org/10.1029/2008JB006090
Williams, C. A., Eberhart-Phillips, D., Bannister, S., Barker, D. H., Henrys, S., Reyners, M., & Sutherland, R. (2013). Revised interface geometry for
the Hikurangi subduction zone, New Zealand. Seismological Research Letters, 84(6), 1066–1073.
Wood, R., & Davy, B. (1994). The Hikurangi Plateau. Marine Geology, 118(1–2), 153–173. https://doi.org/10.1016/0025-3227(94)90118-X
Yokota, Y., Ishikawa, T., Watanabe, S., Tashiro, T., & Asada, A. (2016). Seafloor geodetic constraints on interplate coupling of the Nankai Trough
megathrust zone. Nature, 534(7607), 374–377. https://doi.org/10.1038/nature17632
Zigone, D., Rivet, D., Radiguet, M., Campillo, M., Voisin, C., Cotte, N., et al. (2012). Triggering of tremors and slow slip event in Guerrero, Mexico,
by the 2010 Mw 8.8 Maule, Chile, earthquake. Journal of Geophysical Research, 117, B09304. https://doi.org/10.1029/2012JB009160
TODD ET AL. 6783You can also read