The effect of beta blockers on hemodynamic parameters in patient specific blood flow simulations of type B aortic dissection: a virtual study
←
→
Page content transcription
If your browser does not render page correctly, please read the page content below
www.nature.com/scientificreports
OPEN The effect of beta‑blockers
on hemodynamic parameters
in patient‑specific blood flow
simulations of type‑B aortic
dissection: a virtual study
Mohammad Amin Abazari1, Deniz Rafieianzab1, M. Soltani1,2,3,4,5* & Mona Alimohammadi1*
Aortic dissection (AD) is one of the fatal and complex conditions. Since there is a lack of a specific
treatment guideline for type-B AD, a better understanding of patient-specific hemodynamics and
therapy outcomes can potentially control the progression of the disease and aid in the clinical
decision-making process. In this work, a patient-specific geometry of type-B AD is reconstructed
from computed tomography images, and a numerical simulation using personalised computational
fluid dynamics (CFD) with three-element Windkessel model boundary condition at each outlet
is implemented. According to the physiological response of beta-blockers to the reduction of
left ventricular contractions, three case studies with different heart rates are created. Several
hemodynamic features, including time-averaged wall shear stress (TAWSS), highly oscillatory, low
magnitude shear (HOLMES), and flow pattern are investigated and compared between each case.
Results show that decreasing TAWSS, which is caused by the reduction of the velocity gradient,
prevents vessel wall at entry tear from rupture. Additionally, with the increase in HOLMES value at
distal false lumen, calcification and plaque formation in the moderate and regular-heart rate cases are
successfully controlled. This work demonstrates how CFD methods with non-invasive hemodynamic
metrics can be developed to predict the hemodynamic changes before medication or other invasive
operations. These consequences can be a powerful framework for clinicians and surgical communities
to improve their diagnostic and pre-procedural planning.
Cardiovascular disease is the first most common cause of death w orldwide1,2. Aortic dissection (AD) is a subset
of cardiovascular disease, which occurs when an injury to the intima layer enables blood to enter the middle layer
of the aortic wall. It leads to create a channel by communicating the main bloodstream or true lumen (TL) of the
aorta into a false lumen (FL), which is separated by an intimal flap (IF). This can happen in either the ascending or
descending aorta, for which the disease is classified into Stanford type-A or Stanford type-B AD, r espectively3–5.
Although prompt surgical intervention is the recommended treatment method for type-A AD, there is no
specific treatment guideline for type-B AD. This is partially due to a lack of knowledge of the biomechanical
and hemodynamic properties of AD6,7. The ideal treatment of type-B AD for each patient can be determined by
compromising the cost and impact of each treatment scenario and specific conditions of the patients5,8,9, which is
known as patient-specific therapy3,10,11. Two main reasons for the progression of type-B AD are high blood flow
and elevated blood pressure (BP)11,12. Type-B AD patients should initially receive medical treatment to control
and decrease the BP, heart r ate5,11, and wall shear stress (WSS) f orces13. Beta-blocker (BB) family groups are the
initial routine pharmacological therapy of type-B A D14,15. The physiological responses of BB decrease left ven-
tricular contractions by affecting the level of i ons16–19. This mechanism leads to the reduction of aortic BP and
heart rate to lower than 120 mmHg and 60 BPM, r espectively15–17; for additional BP reduction and in the presence
1
Department of Mechanical Engineering, K. N. Toosi University of Technology, Tehran, Iran. 2Department of
Electrical and Computer Engineering, Faculty of Engineering, School of Optometry and Vision Science, Faculty of
Science, University of Waterloo, Waterloo, Canada. 3Advanced Bio Initiative Center, Multidisciplinary International
Complex, K. N. Toosi University of Technology, Tehran, Iran. 4Centre for Biotechnology and Bioengineering (CBB),
University of Waterloo, Waterloo, ON, Canada. 5Cancer Biology Research Center, Cancer Institute of Iran, Tehran
University of Medical Sciences, Tehran, Iran. *email: msoltani@uwaterloo.ca; mona@alimohammadi.co.uk
Scientific Reports | (2021) 11:16058 | https://doi.org/10.1038/s41598-021-95315-w 1
Vol.:(0123456789)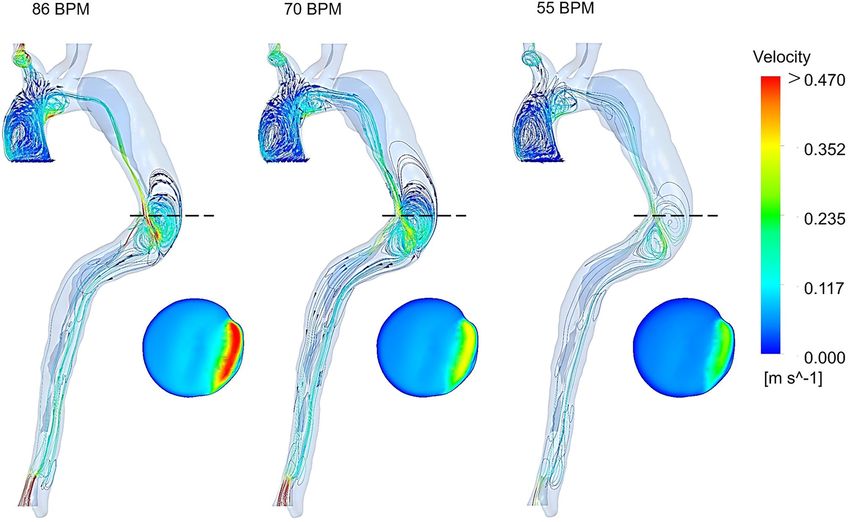
www.nature.com/scientificreports/
of life-threatening conditions like malperfusion in branch vessels or vessel wall’s rupture, surgical operation or
thoracic endovascular aortic repair (TEVAR) is essentially n eeded8,20–22. However, the rate of reoperation for
patients treating with surgery is about 10% higher than medical intervention after about 12 years10,12. Further-
more, underlying and high-risk conditions such as stroke and early mortality may prioritize surgical treatment
over pharmacological t herapy23. In acute AD patients, the primary purposes of pharmacological treatment are
to stabilise the dissection, accelerate healing, prevent rupture, and reduce the risk of c omplications15. A better
understanding of the disease’s progression and therapy response virtually before the operation can help clinical
researchers comprehend the pathophysiology of AD and, finally, appropriate the optimal solution.
In recent years, several studies have reported the importance of personalised computational fluid dynamics
(CFD) methods along with imaging techniques to develop diagnosis and controlling approaches of aortic disease,
in order to customize patient-specific treatment o utcomes23–29. Some studies have shown the importance of the
combination of particle image velocimetry and CFD simulations in type-B AD in pre-procedural planning,
clinical decision support, and CFD models v alidation30,31. Several studies have focused on TEVAR based on the
prediction of thrombus formation and growth of the FL13,32–35. Recent work has demonstrated the potential use
of CFD simulations in the hemodynamic analysis of type-B AD before and after treatment with multilayer flow
modulators stents36. Advances in the investigation of hemodynamic metrics have allowed for the diagnosing of
common pathologies in type-B AD patients, which have aided clinicians in their decision-making process. For
example, an elevated time average wall shear stress (TAWSS) index plays a key role in the vessel wall’s rupture4,37.
Furthermore, highly oscillatory, low magnitude shear (HOLMES) has shown promising results in predicting the
calcified regions6. Additionally, analysis of pressure values can be helpful in the study of aneurysmal dilatation
and malperfusion23,38. A more recent study has shown the importance of TAWSS and pressure difference values
between the TL and FL in the prediction of rapid aneurysmal expansion in the dissected aorta39, confirming the
need for further measuring of hemodynamic metrics for the prediction of further progression and development
of AD. Furthermore, a recent review has indicated the importance of CFD tools and hemodynamic features
for risk assessment in AD patients, which can be used by c linicians40. Moreover, boundary condition accuracy
in CFD simulations of AD has been improved by replacing flow split boundary and constant pressure with
physiologically accurate dynamic three-element Windkessel (WK3)3,41. Deploying WK3 for the outlets of AD
simulations is particularly important as the correct calculation of flow (at the outlets), which is crucial in case
of malperfusion (lack of blood supply)6. What is more, the CFD methods with patient-specific data have shown
promising results in hemodynamic changes41–43 and prediction of hemodynamic outcomes in virtual stenting
operations23. For instance, Xu et al. have recently introduced metrics by using computational hemodynamic
analysis on 51 patients with type-B AD to evaluate the hemodynamic improvement, which can be used to predict
luminal remodeling of patients after TEVAR44. In contrast, no single study has been reported to quantify the
variation in hemodynamics during medical treatment in a clinical case of type-B AD coupled with the WK3. The
present study aims to highlight the effectiveness of using the pharmaceutical treatment on type-B AD in terms
of progression, planning, and management.
In the current study, a numerical blood flow simulation in a patient-specific geometry of type-B AD coupled
with the WK3 model is created for three different heart rates undergoing virtual medication. Non-invasive
hemodynamic metrics that influence disease progression are investigated and compared in each case. The pri-
mary goal of the present work is to represent a framework to better understand and predict how the heart rate
reduction mechanism of anti-hypertensive drugs with changing the hemodynamics tend to control the progres-
sion and development of the disease, which can be investigated from WSS results. Toward this goal, clinicians
and surgical communities can choose the optimal patient-specific solution regarding the risk of other treatment
methods (TEVAR or open surgery) and the investigated biomechanical medication metrics. Additionally, since
the present model is used for CFD simulation on a patient-specific level, different treatment scenarios can be
applied to each patient prior to any medical or surgical intervention. The present model will be one more step
forward for breaking down barriers to patient-specific AD therapy.
Material and methods
Geometry and grid generation. The three-dimensional (3D) fluid domain is generated from a stack of
887 digital imaging and communications in medicine (DICOM) images of a 58-year-old male patient suffering
from Stanford type-B AD. The fluid domain is reconstructed using MIMICS Research 21.0 (2018 release, Mate-
rialise, Leuven, Belgium). The resolution of the computed tomography (CT) images is 0.5 mm/pixel, IF thickness
is about 1.5–2.5 mm between the two tears, and the diameter of the ascending aorta (D) is approximately 4.5 cm.
Several processes are used to create different masks to fully capture the geometry.
The three-branch arteries (i.e., brachiocephalic artery, subclavian artery, and left carotid artery) are retained
on the aortic arch; however, other small vascular branches are excluded due to the low quality of the images.
Additionally, the iliac arteries are omitted, and finally, boundaries are cut with parallel planes in order to place
the inlet and outlets along the same axis. As shown in Fig. 1, two cross-sectional planes of the reconstructed 3D
geometry are mapped back to CT images to better understand the multi-scale patient-specific model domain.
The fluid domain is meshed using ANSYS Meshing 18.2 (ANSYS Inc., Canonsburg, PA, USA). The geometry
consists of about 420,000 and 175,000 tetrahedral cells and node numbers, respectively. To minimise the compu-
tational errors near the wall, seven prismatic layers with a growth rate of 1.2 are deployed. Mesh independence
is performed for the fluid domain; a coarse mesh with about 250,000 cells and a fine mesh with about 1,000,000
cells are created to evaluate the grid independence. The pressure values in all three cases are evaluated so that
there is a maximum of 3.5% difference between the coarse and medium grids, and a 0.7% of maximum difference
between the medium and fine grids. In order to save computer costs, the medium mesh is chosen.
Scientific Reports | (2021) 11:16058 | https://doi.org/10.1038/s41598-021-95315-w 2
Vol:.(1234567890)
www.nature.com/scientificreports/
Figure 1. Multi-scale patient-specific model domain and its boundary conditions. (a) Patient-specific dissected
aorta geometry with two planes to illustrate the dissection region and entry tear. Boundaries are named with
green arrows; DA descending aorta, LS left subclavian artery, AA ascending aorta, LCC left common carotid
artery, BT brachiocephalic trunk (b) Inlet flow rate diagram. (c) Three-element Windkessel (WK3) boundary
condition.
Computational fluid dynamics. The continuity and Navier-Stokes equations (Eqs. (1) and (2), respec-
tively) are solved by CFD software ANSYS-CFX 18.2 (ANSYS Inc., Canonsburg, PA, USA) based on the finite
volume method. ANSYS CFD-Post and MATLAB (R2018b version, Mathworks, Natick, USA) are used to Post-
processing the data. Discretization of the governing equations involves a second-order backward Euler scheme
with a time step of 0.005 s, and maximum residual mean square errors are set to 1×10⁻⁵:
∇ · u� = 0 (1)
∂ u�
ρ + ρ(�u · ∇)�u + ∇p − µ��u = 0 (2)
∂t
where u is the fluid velocity vector and μ, ρ , and p represent the local dynamic viscosity, density, and pressure,
respectively.
Boundary conditions. The blood is assumed as an incompressible fluid with a density3 of 1056 kg/m3.
The fluid is considered as a non-Newtonian model, with viscosity determined by the Carreau–Yasuda viscosity
model, wherein μ is viscosity, γ′ is shear rate, μ0 is Carreau–Yasuda zero shear viscosity and μ∞, a, m, and λCY
are Carreau–Yasuda infinite shear viscosity, Yasuda exponent, Carreau–Yasuda Power Law Index, and Carreau–
Yasuda time constant, respectively:
µ = (µ0 − µ∞ )(1 + ( CY γ ′ )a )(m−1)/a + µ∞ (3)
45
The parameters used in the present work are determined by Gijsen et al. , which are shown in Table 1.
Scientific Reports | (2021) 11:16058 | https://doi.org/10.1038/s41598-021-95315-w 3
Vol.:(0123456789)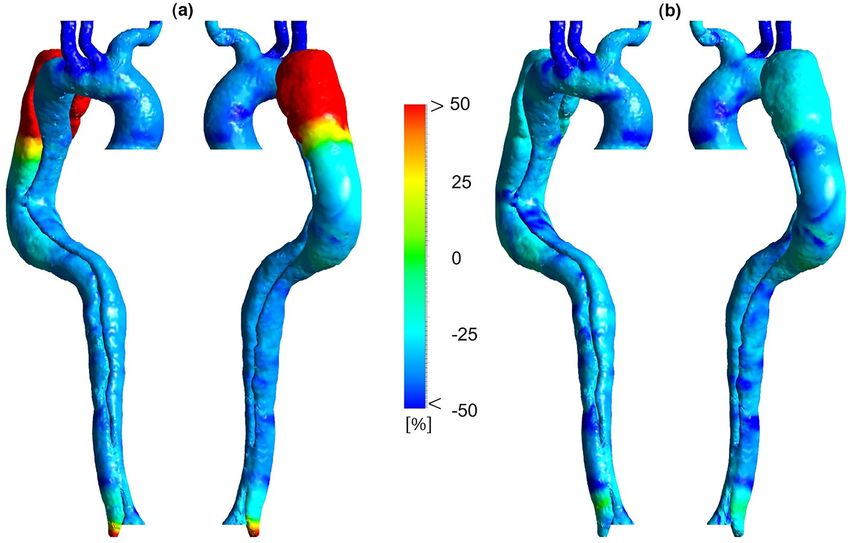
www.nature.com/scientificreports/
μ0 [m pa s] μ∞ [m pa s] a m λCY [s]
22 2.2 0.644 0.392 0.110
Table 1. Parameters used for the Carreau–Yasuda model45.
Figure 2. Input flow waves at the ascending aorta for all three cases.
In the present study, the case with the highest velocity (86 BPM, 0.69 s for one cardiac cycle, frequency
(f) = 1.43 Hz)46 is used to calculate the Reynolds number. The critical Reynolds number in the aorta has been
determined by Stalder et al.47:
Rec = 169α 0.83 St −0.27 (4)
α = 0.5D 2πf ρµ−1 (5)
St = 0.5 fD(Vp − Vm )−1 (6)
where Rec, α, and St are the critical Reynolds, Womersley, and Strouhal numbers, respectively. Vm and Vp are the
mean and peak velocities, which are about 0.05 m/s and 0.28 m/s, respectively. The Womersley number in AA is
about 34.7, the Strouhal number is 0.14, the mean and peak Reynolds numbers are approximately 640 and 3400,
respectively, and the critical Reynolds number is about 5500. Since the peak Reynolds number is lower than the
critical Reynolds number, the inlet flow is assumed to be subcritical during the cycle, so a laminar flow model
is used. This usually occurs in large arteries due to the low mean flow v elocity3,13,48,49.
As discussed in the introduction, anti-impulse therapy decreases patient’s heart rate to the normal
range8,20,21,50. For this purpose, the patient-specific model is used to provide three case studies with different heart
rates to investigate the virtual pharmacological treatment outcomes. In the present study, it is assumed that the
patient’s heart rate drops from 86 BPM (high-heart rate) to 70 BPM (moderate-heart rate) and, finally, to 55 BPM
(regular-heart rate)23,46. Three aforementioned virtually adjusted input flow rate diagrams are shown in Fig. 2.
Since the inlet flow to the AA is not available for this patient, Karmonik et al.’s results46 are used and adjusted
accordingly23. Three cardiac cycles are applied to reach periodic repetitive states, and the last one is used to
extract all the results.
This study is carried out in order to provide a framework for clinicians to better tune their patient-specific
pharmacological treatment. Therefore, computational cost (simulation time) is of great importance herein. On the
other hand, the inclusion of vessel wall simulation–fluid–solid interaction (FSI)—would require great resources
and adequate t ime13,27,37. Additionally, setting up FSI simulation is not clinician-friendly; thus rigid wall with
no-slip boundary condition is assumed.
A three-element Windkessel model is applied to each outlet to achieve realistic dynamic boundary condi-
tions. This model uses a hydraulic-electrical analogy (0-D), in which pressure (P) and blood flow (Q) represent
voltage and current in a circuit, respectively (see Fig. 1c)3:
dP dQ
P = (R1 + R2 )Q − R2 C + R1 R2 C (7)
dt dt
Scientific Reports | (2021) 11:16058 | https://doi.org/10.1038/s41598-021-95315-w 4
Vol:.(1234567890)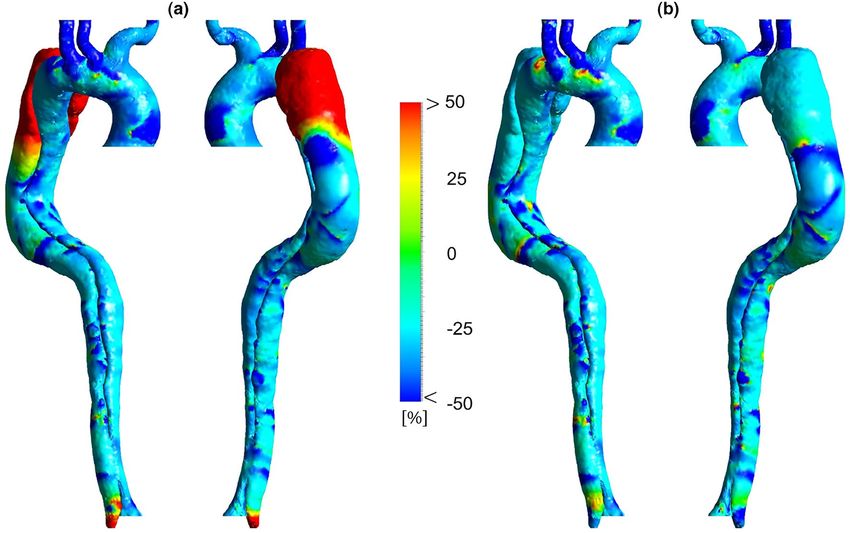
www.nature.com/scientificreports/
where R1, R2, and C are characteristic impedance, hydrodynamic resistance, and compliance, respectively. Equa-
tion (8) shows the discretized form of the above equation using the backward Euler method, which is defined in
ANSYS-CFX via CFX Expression Language (CEL)3,6:
(R1 + R2 + R1 β)Qn − R1 βQn−1 + βPn−1
Pn = (8)
1+β
where n and n − 1 are the current and previous time steps and Δt in β = R�t 2C
is the time step. All the parameters
51
are taken from a similar study .
The last step in implementing the accurate boundary condition is changing the resistance properties of the
WK3 model at different physiological states (high, moderate, and regular-heart rate), which is related to the
pharmacological effects of the conventional B Bs16–18,52. Thus, five different sets of peripheral resistance in the WK3
model are assumed. The resistance values at high-heart rate are decreased by 20 and 25% and in the moderate
case, these values are decreased by 10 and 15%. It should be noted that all of these reductions are calculated based
on the resistance values at the regular-heart r ate51, and the changes in resistance values are accounted to all outlet
boundary conditions (BT, LCC, LS, and DA). These thresholds in the resistance values are selected based on the
previous works53–55. Taylor et al. have suggested that the total microvascular resistance at hyperemic condition
reduces up to 24% of the healthy v alue53,55. Recently, Randles et al. have used a 25% reduction in microvascular
resistance at hyperemic condition compared with the normal o ne54.
In the present study, a sensitivity analysis to investigate the effect of different peripheral resistance on hemody-
namic metrics is performed. The input parameters of the sensitivity analysis are five different boundary conditions
at three different heart rates (20 and 25% reduction in resistance at 86 BPM, 10 and 15% reduction in resistance
at 70 BPM and the based WK3 parameters at 55 BPM). The average pressure along with the aorta, TAWSS and
HOLMES distributions, the percentage difference in TAWSS, OSI and HOLMES metrics are considered as the
key hemodynamic output parameters. It should be noted that the velocity distribution and flow patterns in all
the cases during the sensitivity analysis are also examined and shown the same trends.
Results
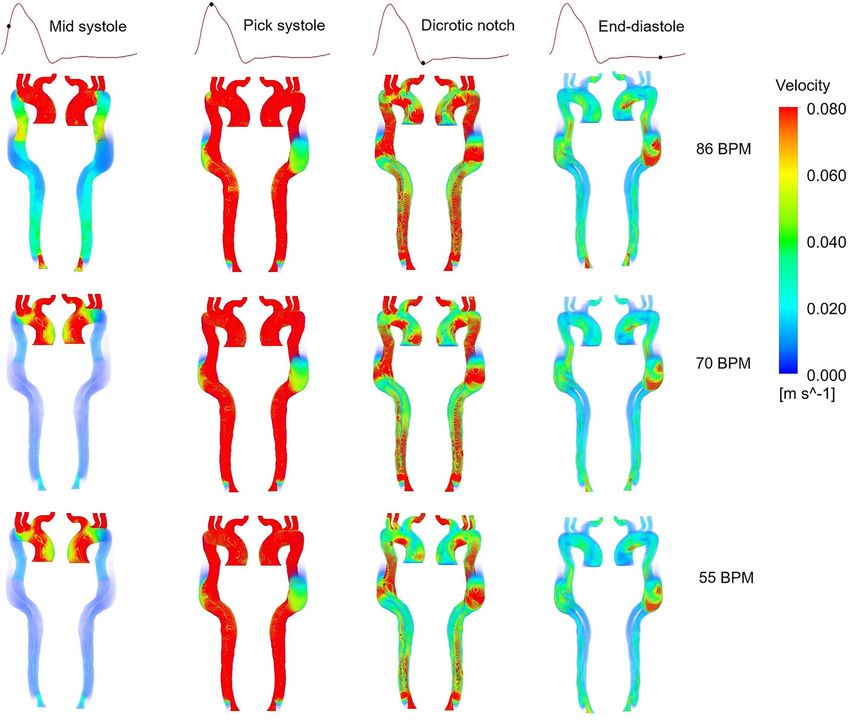
Velocity distribution. The velocity distribution in three cases is shown in Fig. 3. Generally, the velocity
decreases with the heart rate reduction at all cardiac points except pick systole, where no significant changes can
be seen. Velocity magnitude in the upper branches remains the same in three cases, whereas decreasing heart
rate is led to a more uniform gradient in the descending aorta of moderate and regular-heart rate cases than the
high-heart rate case. These changes are more visible in the WSS indicators’ results, which are discussed further in
the following section. Figure 4 shows streamlines during end-diastole in three cases. At this stage in the cardiac
cycle, most of the blood flows through the BT, while a small proportion of the total aortic flow enters through the
FL by entry tear. A few of these streamlines, which have higher velocity, wash the FL wall and make the helical
structures around the entry tear. The length of these complex flows, their number, and velocity values decrease
during anti-impulse therapy, which can be observed in velocity contours at the cross-sectional planes in the
middle of entry tear in Fig. 4.
Pressure distribution. The pressure distribution along all the cases during pick systolic BP is shown in
Fig. 5. The sensitivity analysis for pressure results at 86 and 70 BPM with different reductions in resistance values
can be found in Supplementary Table 1 and Supplementary Table 2, respectively. These results show the percent-
age difference in pressure values during pick systolic BP at 86 and 70 BPM are lower than 2%. Thus, the pressure
distributions in Fig. 5 are shown only for the case with a 20% reduction in resistance at 86 BPM and the case with
a 15% reduction in resistance at 70 BPM.
Results show a significant difference in pressure values between different heartbeats. Although pressure in
each case has a fairly uniform gradient throughout the domain, the average pressure is notably decreased from
about 112 mmHg at 86 BPM to approximately 100 and 85 mmHg at 70 and 55 BPM, respectively. In the high-
heart rate case, the pressure difference between AA and DA is about 18 mmHg (from about 112 mmHg is dropped
to about 94 mmHg), implying a severe hypertension situation. On the other hand, the average pressure drop
decreases to 12 and 7 mmHg in moderate and regular-heart rate cases, respectively. Additionally, pressure mag-
nitude at BT is between 100 and 95 mmHg without considerable change in high and moderate-heart rate cases.
WSS indicators. TAWSS is an important WSS indicator which is prescribed by Eq. (9)3:
1
T
TAWSS = |�
τ (t)|dt (9)
T 0
where τ (t) and T are WSS vector at time t and the total time of the cardiac cycle, respectively. This equation is
adjusted to all 3D geometry nodes to evaluate TAWSS. TAWSS distribution for each case and the percentage
difference between each two are shown in Figs. 6 and 7, respectively.
Sensitivity analysis for TAWSS distribution at 86 and 70 BPM with different reductions in resistance values is
performed, the results of which are shown in Supplementary Figures 1a, 2a, 3, and 4. Supplementary Figures 3
and 4 indicate that the TAWSS distribution along the aorta for different resistance values has the same trend at
each heart rate. According to Supplementary Figures 1a and 2a, the average percentage difference in TAWSS
along the aorta at 86 and 70 BPM are 0.25 and 0.42%, respectively. In other words, at most parts of the aorta, the
percentage difference in TAWSS varies between ± 1%, except in some regions at the outer surface of FL after the
aortic arch. Although, the absolute TAWSS values in these regions have remained without considerable changes.
Scientific Reports | (2021) 11:16058 | https://doi.org/10.1038/s41598-021-95315-w 5
Vol.:(0123456789)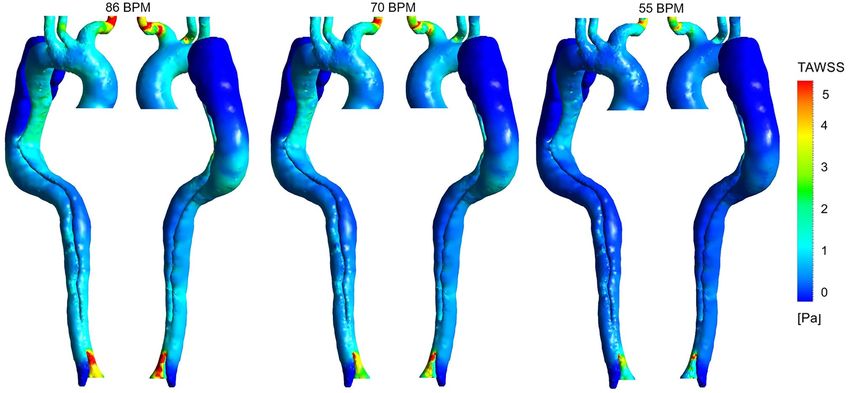
www.nature.com/scientificreports/
Figure 3. Velocity distribution for all three cases at four cardiac points (the scale bar shown in the figure
indicates all contours).
It should be noted that TAWSS results in Figs. 6 and 7 are shown only for the case with a 25% reduction in resist-
ance at 86 BPM and the case with a 10% reduction in resistance at 70 BPM.
Figure 6 indicates that the highest values of TAWSS are in the upper branches (especially BT) and around
DA. TAWSS value at AA and TL around entry tear fluctuates between 2 and 2.5 Pa in the high-heart rate model.
This value at TL decreases to 1–1.5 Pa and 0.5–1 Pa in moderate and regular models, respectively. The reduction
of velocity gradient leads to the development of a low TAWSS value at the outer surface of TL around the entry
tear to both downstream and upstream directions (see Fig. 3). Eventually, in the regular model, TAWSS in distal
FL and TL is almost zero. Very low TAWSS value and slight velocity gradient in the distal FL around DA indicate
no way out for blood flow, which can be a potential risk to the cell function. Figure 7 illustrates that TAWSS
decreases by an average of 25 and 30% at the downstream of entry tear in each case, respectively. According
to Fig. 7a, TAWSS values along the aorta are decreased except in the outer surface of FL after the aortic arch
(proximal FL) and some areas around DA. However, according to Fig. 6, in absolute terms (about 0.2 Pa), it is
apparent that TAWSS does not differ significantly in these areas.
Oscillatory shear index (OSI) is another meaningful WSS indicator and can be achieved from the following
equation3:
1 T
1
∫ τ�(t)dt
T 0
OSI = 1− (10)
2 TAWSS
This parameter measures the oscillation of forces on the endothelial c ells3, which has a value between 0 and
0.5. A zero OSI quantity points to one-way wall shear forces, and the higher values indicate that the direction of
WSS forces is rather unknown3,4. A similar sensitivity analysis for OSI at 86 and 70 BPM with different reductions
Scientific Reports | (2021) 11:16058 | https://doi.org/10.1038/s41598-021-95315-w 6
Vol:.(1234567890)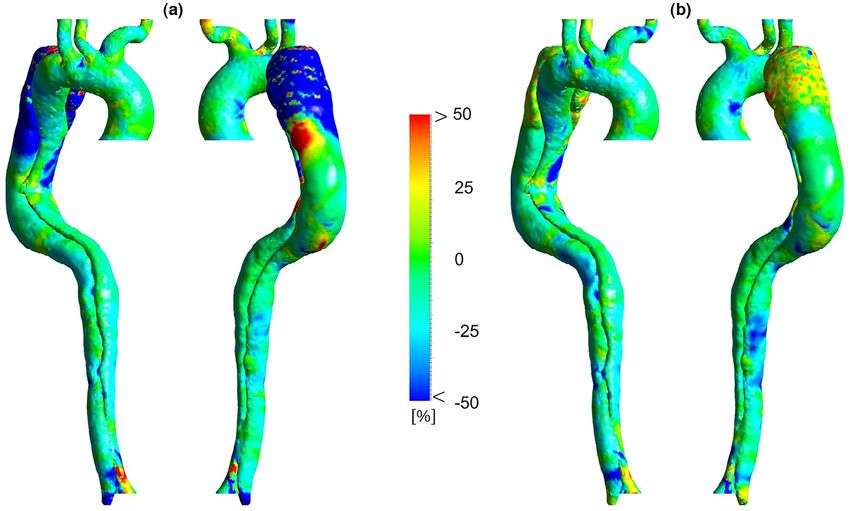
www.nature.com/scientificreports/

                                  Figure 4.  Streamlines and velocity contours during end-diastole (dashed lines indicate the position of selected
                                  cross-sectional planes in the middle of entry tear and the scale bar shown in the figure indicates all contours).

                                  Figure 5.  Pressure distribution for three cases during pick systolic blood pressure (the scale bar shown in the
                                  figure indicates all contours).

                                  in resistance values is performed, the results of which are shown in Supplementary Figures 1b and 2b. These
                                  results show the percentage difference in OSI throughout the domain varies between ± 2%. Thus, the OSI results
                                  in Figs. 8 and 9 are shown for the case with a 25% reduction in resistance at 86 BPM and the case with a 10%
                                  reduction in resistance at 70 BPM.

Scientific Reports |   (2021) 11:16058 |               https://doi.org/10.1038/s41598-021-95315-w                                                     7

                                                                                                                                              Vol.:(0123456789)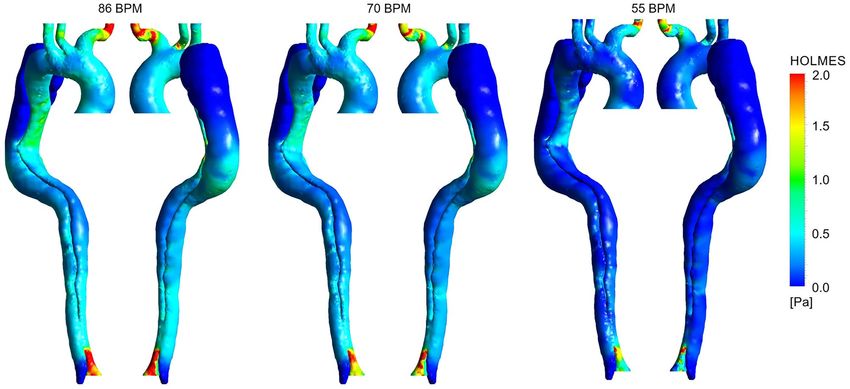
www.nature.com/scientificreports/

                                            Figure 6.  Time-averaged wall shear stress (TAWSS) distribution for three cases (the scale bar shown in the
                                            figure indicates all contours).

                                            Figure 7.  Percentage difference in time-averaged wall shear stress (TAWSS) according to different heart rates.
                                            (a) Percentage difference in TAWSS between 86 and 70 BPM. (b) Percentage difference in TAWSS between 55
                                            and 70 BPM.

                                                Figure 8 shows the OSI distribution for three cases. Generally, high OSI values are seen in the dispersed
                                            regions in the downstream entry tear, FL around DA, and some parts of the aortic arch due to the complicated and
                                            unstable flow. Figure 9 demonstrates OSI percentage differences according to different heart rates. OSI does not
                                            differ significantly between the models. However, by looking closely at some regions, some variations can be seen.
                                            The average percentage difference in OSI is approximately equal to ± 10% in most parts; however, some regions
                                            with a − 25% difference are found over the TL, indicating a reduction in the oscillating nature of the WSS forces.
                                            According to Fig. 9a, the highest percentage difference reduction in OSI is in the FL after the aortic arch and DA.

          Scientific Reports |   (2021) 11:16058 |               https://doi.org/10.1038/s41598-021-95315-w                                                   8

Vol:.(1234567890)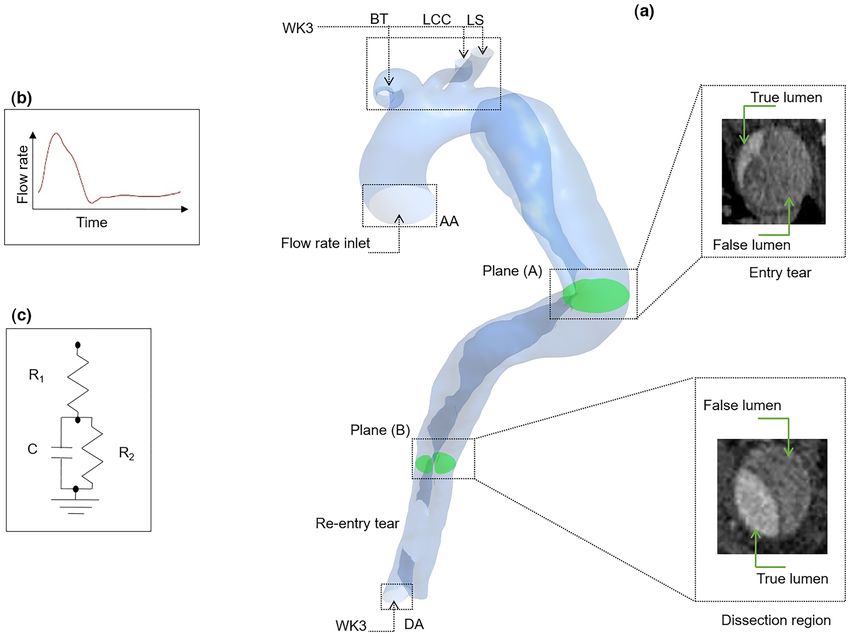
www.nature.com/scientificreports/
Figure 8. Oscillatory shear index (OSI) distribution for three cases (the scale bar shown in the figure indicates
all contours).
Figure 9. Percentage difference in oscillatory shear index (OSI) according to different heart rates. (a)
Percentage difference in OSI between 86 and 70 BPM. (b) Percentage difference in OSI between 55 and 70 BPM.
For a better understanding of the combination and interaction of these two characteristics (TAWSS and OSI),
a parameter called HOLMES is investigated, given by6:
HOLMES = TAWSS (0.5 − OSI) (11)
HOLMES provides an efficacious tool for predicting the location of plaques and their progression6. Both
HOLMES distribution and its percentage difference between the three cases are shown in Figs. 10 and 11, respec-
tively. The results of sensitivity analysis for HOLMES distribution at 86 and 70 BPM with different reductions in
resistance values are shown in Supplementary Figures 1c, 2c, 5, and 6. According to Supplementary Figures 5 and
6, HOLMES distribution along the aorta at each heart rate remains approximately constant, where the percentage
Scientific Reports | (2021) 11:16058 | https://doi.org/10.1038/s41598-021-95315-w 9
Vol.:(0123456789)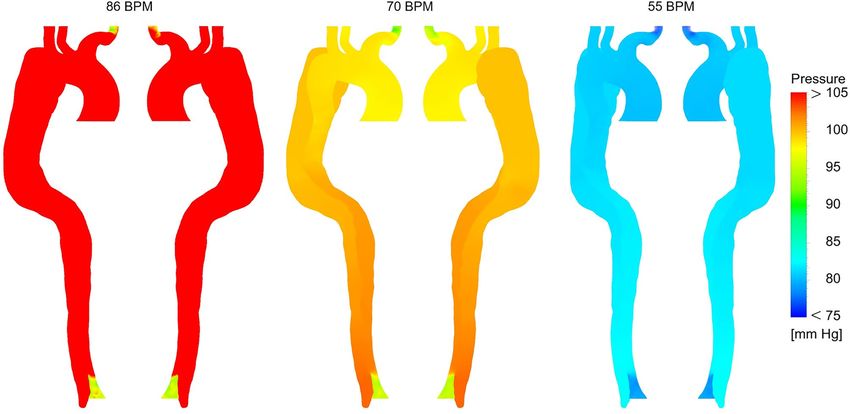
www.nature.com/scientificreports/

                                            Figure 10.  Highly oscillatory, low magnitude shear (HOLMES) distribution for three cases (the scale bar shown
                                            in the figure indicates all contours).

                                            Figure 11.  Percentage difference in highly oscillatory, low magnitude shear (HOLMES) according to different
                                            heart rates. (a) Percentage difference in HOLMES between 86 and 70 BPM. (b) Percentage difference in
                                            HOLMES between 55 and 70 BPM.

                                            difference in HOLMES differs between ± 1% at most parts of the aorta (see Supplementary Figures 1c, 2c). Thus,
                                            the HOLMES distribution in Figs. 10 and 11 is shown only for the case with a 25% reduction in resistance at
                                            86 BPM and the case with a 10% reduction in resistance at 70 BPM.
                                                According to Fig. 10, the mean value of HOLMES is less than 1 Pa throughout the domain except for the
                                            upper branches (especially BT) and around the DA. According to Fig. 11, HOLMES is decreased along the aorta
                                            except in some scattered regions, i.e., FL after the aortic arch (proximal FL) and DA.

          Scientific Reports |   (2021) 11:16058 |              https://doi.org/10.1038/s41598-021-95315-w                                             10

Vol:.(1234567890)
www.nature.com/scientificreports/
Discussion
In the present study, results show significant hemodynamic differences between the three cases undergoing
medical management. Analysis of the velocity changes in Fig. 3 provides evidence that flow resistance in the
abdominal aorta in the moderate and regular-heart rate cases is decreased more than the high-heart rate one,
which is a crucial issue during treatment in AD patients with m alperfusion6. In studies of the development and
progression of type-B AD, little attention has been paid to the role of complex flow around the tear. The most
striking changes in Fig. 4 are the reducing distribution of some threatening patterns and high-velocity jet flows
around the entry tear by successive heart rate reduction mechanism of BBs. These changes prevent the progres-
edically15.
sion of FL, rupture of the vessel wall, and other pathologies, which are vital factors in patients treating m
Pressure results in Fig. 5 indicate that the high-heart rate case suffers from an elevated mean pressure drop.
The pressure drop during medical therapy in two other cases prevents severe co-occurring conditions in hyper-
tension AD patients (i.e., calcification, extracellular fatty acid deposition, wall thickening, and fibrosis4,14,15).
There is evidence showing that high-pressure FL particularly compresses the TL, notably during diastole, which
can cause downstream organ ischemia or late aneurysmal dilatation3,38. The pressure results in the high-heart
rate case demonstrate that high-pressure values in the FL are successfully decreased to the healthy range. What is
interesting in pressure data is that during medical management, the average BP in the moderate and regular cases
is decreased to lower values than a similar patient undergoing single-stenting and double-stenting operations
in TEVAR, respectively23. These findings in this patient-specific paradigm are essentially helpful for supporting
the clinical pre-procedural planning.
WSS is principally essential in the study of AD because of its direct effect on the progression and develop-
ment of the vessel w all3,4, which cannot be measured invasively or experimentally. However, CFD can provide a
great insight into this parameter and its i ndices3,4,41. For instance, high TAWSS values cause FL regions expand
and grow, which increases the risk of rupture3,6, closing the TL, and completely losing function of the lower
appendages3,56. TAWSS results represent that the high-heart case is suffered from abnormal hemodynamic stresses
on the vessel wall around the entry tear and AA. Due to the lower velocity gradients in the moderate and regular
models, TAWSS values in these acute areas are decreased to the healthy range (0–2 Pa4,23).
The variation of OSI in moderate and regular models turns into more stable, suggesting a better mechani-
cal condition for the aortic endothelial cells. As reported by previous research6,29,57, an invaluable part of WSS
indicators is that if an area exposes to a high OSI and low TAWSS, there is a high risk of rupture, calcification,
or wall thickening. High OSI values in distal FL with low TAWSS (around DA) can potentially lead to high-risk
complications. Due to the reduction of OSI values at these areas in both moderate and regular cases, possible
adverse effects are controlled (see Fig. 9).
The results of follow-up mortality in acute type-B AD Patients have shown that a history of atherosclerosis
causes a significant increase in the mortality r ate58. Therefore, identifying the location of plaque formation and
its progression during non-invasive treatment (using the shear stress index) can be of great help to clinicians.
As discussed in the paper by Alimohammadi et al.6, the HOLMES index powerfully can predict regions to be
prone to calcification with an accuracy of up to 95%. According to Fig. 11, interestingly, the increase in HOL-
MES at distal FL (around DA) regions ensures that plaque formation, calcification, and increasing endothelial
cell permeability, which are subsequent common pathologies in type-B AD patients, are controlled successfully.
In conclusion, the present work is represented a personalised CFD simulation of blood flow in a patient suf-
fering from type-B AD. The 3-D patient-specific geometry is coupled with dynamic boundary conditions and
non-Newtonian viscosity blood flow to investigate and predict changes in hemodynamic metrics during virtual
medical treatment. Results show the high-velocity jet and complex flow at entry tear, which both play a key
role in AD patients treating pharmacologically, are managed in the moderate and regular cases. Additionally,
the pressure results show that the high-risk elevated pressure drop in the case with high-heart rate successfully
decreases with anti-impulse therapy. What is more, by decreasing the velocity gradient at the outer surface of TL
around entry tear in the moderate and regular cases, TAWSS in these high-risk regions successfully decreases
to a healthy range. Therefore, possible adverse effects such as the rupture of the vessel wall are controlled. The
increase in HOLMES at distal FL demonstrates that plaque formation and calcification in this patient are man-
aged. Overall, these investigated hemodynamic parameters not only can represent a great scheme to predict
the patient’s conditions during medical treatment, but also play a vital role in planning the optimal treatment
scenario for customised patient-specific therapy.
Limitations. Although this study uses some patient-specific data; the geometry of type-B AD is recon-
structed from CT images. Non-Newtonian blood viscosity and the tuned WK3 parameters from the previous
study on a similar patient are used51, and a comprehensive sensitivity analysis on the resistance values of these
parameters is performed; thus, the key hemodynamic outcomes predicted by CFD simulation is expected to be
a suitable model of a patient undergoing virtual medical treatment.
The purpose of current work is to create a framework to further assist the clinicians with their patient-specific
analysis. Thus, the inlet velocity profile is virtually adjusted based on the different heart rates during medical
treatment. Furthermore, in the absence of personalised data; it is common to deploy similar data from the
literature as used b y4,6,13,23,32,33,51,59. However, the effect of the inlet velocity profile on the aortic hemodynamic
60
is unsure , and it is uncertain that parabolic or Womersley profiles provide any advancement over a uniform
velocity6,61,62. Furthermore, building comprehensive models require patient-specific properties which are difficult
to access in some cases due to a lack of advanced imaging facilities in hospital or patient’s conditions60. However,
some research has found that through-plane (TP) inlet velocity profile can provide improved predictions of the
hemodynamic results60,63 and in the absence of 4D-flow magnetic resonance imaging data adjusting the generic
flow waveform based on the patient’s condition (stroke volume and heart rate) is the recommended solution60.
Scientific Reports | (2021) 11:16058 | https://doi.org/10.1038/s41598-021-95315-w 11
Vol.:(0123456789)www.nature.com/scientificreports/
Data availability
All data used for this study are available from the author upon request.
Received: 18 February 2021; Accepted: 20 July 2021
References
1. Yacoub, M., ElGuindy, A., Afifi, A., Yacoub, L. & Wright, G. Taking cardiac surgery to the people. J. Cardiovasc. Transl. Res. 7,
797–802 (2014).
2. Zhang, C.-L., Long, T.-Y., Bi, S.-S., Sheikh, S.-A. & Li, F. CircPAN3 ameliorates myocardial ischaemia/reperfusion injury by target-
ing miR-421/Pink1 axis-mediated autophagy suppression. Lab. Investig. 101, 89–103. https://doi.org/10.1038/s41374-020-00483-4
(2021).
3. Alimohammadi, M. Aortic Dissection: Simulation Tools for Disease Management and Understanding (Springer, 2018).
4. Peng, L. et al. Patient-specific computational hemodynamic analysis for interrupted aortic arch in an adult: Implications for aortic
dissection initiation. Sci. Rep. 9, 8600. https://doi.org/10.1038/s41598-019-45097-z (2019).
5. Nienaber, C. A. et al. Aortic dissection. Nat. Rev. Dis. Primers 2, 16053. https://doi.org/10.1038/nrdp.2016.53 (2016).
6. Alimohammadi, M., Pichardo-Almarza, C., Agu, O. & Díaz-Zuccarini, V. Development of a patient-specific multi-scale model
to understand atherosclerosis and calcification locations: Comparison with in vivo data in an aortic dissection. Front. Physiol. 7,
238–238. https://doi.org/10.3389/fphys.2016.00238 (2016).
7. Rajagopal, K., Bridges, C. & Rajagopal, K. R. Towards an understanding of the mechanics underlying aortic dissection. Biomech.
Model. Mechanobiol. 6, 345–359. https://doi.org/10.1007/s10237-006-0069-3 (2007).
8. Hiratzka, L. F. et al. 2010 ACCF/AHA/AATS/ACR/ASA/SCA/SCAI/SIR/STS/SVM guidelines for the diagnosis and management
of patients with Thoracic Aortic Disease. Circulation 121, e266–e369. https://doi.org/10.1161/CIR.0b013e3181d4739e (2010).
9. Lortz, J. et al. High intimal flap mobility assessed by intravascular ultrasound is associated with better short-term results after
TEVAR in chronic aortic dissection. Sci. Rep. 9, 7267. https://doi.org/10.1038/s41598-019-43856-6 (2019).
10. Umaña, J. P. et al. Is medical therapy still the optimal treatment strategy for patients with acute type B aortic dissections?. J. Thorac.
Cardiovasc. Surg. 124, 896–910. https://doi.org/10.1067/mtc.2002.123131 (2002).
11. J.C.S.J.W. Group. Guidelines for diagnosis and treatment of aortic aneurysm and aortic dissection (JCS 2011). Circ. J. 77, 789–828.
https://doi.org/10.1253/circj.CJ-66-0057 (2013).
12. Umaña, J. P., Miller, D. C. & Mitchell, R. S. What is the best treatment for patients with acute type B aortic dissections—Medical,
surgical, or endovascular stent-grafting?. Ann. Thorac. Surg. 74, S1840–S1843 (2002).
13. Rikhtegar Nezami, F., Athanasiou, L. S., Amrute, J. M. & Edelman, E. R. Multilayer flow modulator enhances vital organ perfusion
in patients with type B aortic dissection. Am. J. Physiol. Heart Circ. Physiol. 315, H1182–H1193. https://doi.org/10.1152/ajpheart.
00199.2018 (2018).
14. Gionis, M. N. et al. Medical management of acute type A aortic dissection in association with early open repair of acute limb
ischemia may prevent aortic surgery. Am. J. Case Rep. 14, 52–57. https://doi.org/10.12659/AJCR.883793 (2013).
15. Khan, I. A. & Nair, C. K. Clinical, diagnostic, and management perspectives of aortic dissection. Chest 122, 311–328. https://doi.
org/10.1378/chest.122.1.311 (2002).
16. Kharche, S. R. et al. Effects of human atrial ionic remodelling by β-blocker therapy on mechanisms of atrial fibrillation: A computer
simulation. Europace 16, 1524–1533. https://doi.org/10.1093/europace/euu084 (2014).
17. Martinez-Pinna, J. et al. Oestrogen receptor β mediates the actions of bisphenol-A on ion channel expression in mouse pancreatic
beta cells. Diabetologia 62, 1667–1680. https://doi.org/10.1007/s00125-019-4925-y (2019).
18. Pedersen, M. E. & Cockcroft, J. R. The vasodilatory beta-blockers. Curr. Hypertens. Rep. 9, 269–277. https://doi.org/10.1007/
s11906-007-0050-2 (2007).
19. Alli, O., Jacobs, L. & Amanullah, A. M. Acute aortic syndromes: Pathophysiology and management. Rev. Cardiovasc. Med. 9,
111–124 (2008).
20. Suzuki, T. et al. Medical management in type B aortic dissection. Ann. Cardiothorac. Surg. 3, 413–417. https://doi.org/10.3978/j.
issn.2225-319X.2014.07.01 (2014).
21. Tsai, T. T., Nienaber, C. A. & Eagle, K. A. Acute aortic syndromes. Circulation 112, 3802–3813. https://doi.org/10.1161/circulatio
naha.105.534198 (2005).
22. Melby, S., Harrington, P. & Davies, J. Diagnosis and clinical management of aortic dissection. Res. Rep. Clin. Cardiol. 2014, 123.
https://doi.org/10.2147/RRCC.S46026 (2014).
23. Alimohammadi, M. et al. Evaluation of the hemodynamic effectiveness of aortic dissection treatments via virtual stenting. Int. J.
Artif. Organs 37, 753–762. https://doi.org/10.5301/ijao.5000310 (2014).
24. Ong, C. W. et al. Computational fluid dynamics modeling of hemodynamic parameters in the human diseased aorta: A systematic
review. Ann. Vasc. Surg. 63, 336–381. https://doi.org/10.1016/j.avsg.2019.04.032 (2020).
25. Chen, D. et al. A longitudinal study of Type-B aortic dissection and endovascular repair scenarios: Computational analyses. Med.
Eng. Phys. 35, 1321–1330. https://doi.org/10.1016/j.medengphy.2013.02.006 (2013).
26. Keshavarz-Motamed, Z. A diagnostic, monitoring, and predictive tool for patients with complex valvular, vascular and ventricular
diseases. Sci. Rep. 10, 6905. https://doi.org/10.1038/s41598-020-63728-8 (2020).
27. Keshavarz-Motamed, Z. et al. Effect of coarctation of the aorta and bicuspid aortic valve on flow dynamics and turbulence in the
aorta using particle image velocimetry. Exp. Fluids 55, 1696. https://doi.org/10.1007/s00348-014-1696-6 (2014).
28. Jarvis, K., Pruijssen, J. T., Son, A. Y., Allen, B. D. & Soulat, G. Parametric hemodynamic 4D flow MRI maps for the characteriza-
tion of chronic thoracic descending aortic dissection. J. Magn. Reson. Imaging 51, 1357–1368. https://doi.org/10.1002/jmri.26986
(2020).
29. Rafieianzab, D., Abazari, M. A., Soltani, M. & Alimohammadi, M. The effect of coarctation degrees on wall shear stress indices.
Sci. Rep. 11, 12757. https://doi.org/10.1038/s41598-021-92104-3 (2021).
30. Zadrazil, I., Corzo, C., Voulgaropoulos, V., Markides, C. N. & Xu, X. Y. A combined experimental and computational study of the
flow characteristics in a Type B aortic dissection: Effect of primary and secondary tear size. Chem. Eng. Res. Des. 160, 240–253.
https://doi.org/10.1016/j.cherd.2020.05.025 (2020).
31. Bonfanti, M., Franzetti, G., Homer-Vanniasinkam, S., Díaz-Zuccarini, V. & Balabani, S. A combined in vivo, in vitro, in silico
approach for patient-specific haemodynamic studies of aortic dissection. Ann. Biomed. Eng. 48, 2950–2964. https://doi.org/10.
1007/s10439-020-02603-z (2020).
32. Athanasiou, L. S., Nezami, F. R. & Edelman, E. R. Hemodynamic consequences of a multilayer flow modulator in aortic dissection.
Med. Biol. Eng. Comput. 57, 1861–1874. https://doi.org/10.1007/s11517-019-01997-w (2019).
33. Menichini, C., Cheng, Z., Gibbs, R. G. J. & Xu, X. Y. A computational model for false lumen thrombosis in type B aortic dissection
following thoracic endovascular repair. J. Biomech. 66, 36–43. https://doi.org/10.1016/j.jbiomech.2017.10.029 (2018).
34. Jiang, Y. et al. Influence of aortic branch arteries on the hemodynamics of patient-specific type B aortic dissection following TEVAR.
Med. Novel Technol. Devices 4, 100028. https://doi.org/10.1016/j.medntd.2020.100028 (2019).
Scientific Reports | (2021) 11:16058 | https://doi.org/10.1038/s41598-021-95315-w 12
Vol:.(1234567890)www.nature.com/scientificreports/
35. Li, D. et al. Predictor of false lumen thrombosis after thoracic endovascular aortic repair for type B dissection. J. Thorac. Cardiovasc.
Surg. 160, 360–367. https://doi.org/10.1016/j.jtcvs.2019.07.091 (2020).
36. Costache, V. S. et al. Geometric analysis of type B aortic dissections shows aortic remodeling after intervention using multilayer
stents. Materials (Basel) 13, 2274. https://doi.org/10.3390/ma13102274 (2020).
37. Bonfanti, M. et al. A simplified method to account for wall motion in patient-specific blood flow simulations of aortic dissection:
Comparison with fluid-structure interaction. Med. Eng. Phys. 58, 72–79. https://doi.org/10.1016/j.medengphy.2018.04.014 (2018).
38. Cheng, Z., Wood, N. B., Gibbs, R. G. J. & Xu, X. Y. Geometric and flow features of type B aortic dissection: Initial findings and
comparison of medically treated and stented cases. Ann. Biomed. Eng. 43, 177–189. https://doi.org/10.1007/s10439-014-1075-8
(2015).
39. Zhu, Y. et al. Association of hemodynamic factors and progressive aortic dilatation following type A aortic dissection surgical
repair. Sci. Rep. 11, 11521. https://doi.org/10.1038/s41598-021-91079-5 (2021).
40. Munshi, B., Parker, L. P., Norman, P. E. & Doyle, B. J. The application of computational modeling for risk prediction in type B
aortic dissection. J. Vasc. Surg. 71, 1789-1801.e1783. https://doi.org/10.1016/j.jvs.2019.09.032 (2020).
41. Bonfanti, M. & Balabani, S. Computational tools for clinical support: A multi-scale compliant model for haemodynamic simula-
tions in an aortic dissection based on multi-modal imaging data. J. R. Soc. Interface 14, 20170632. https://doi.org/10.1098/rsif.
2017.0632 (2017).
42. Yu, S. C., Liu, W., Wong, R. H., Underwood, M. & Wang, D. The potential of computational fluid dynamics simulation on serial
monitoring of hemodynamic change in type B aortic dissection. Cardiovasc. Interv. Radiol. 39, 1090–1098. https://d oi.o
rg/1 0.1 007/
s00270-016-1352-z (2016).
43. Qiu, Y., Dong, S., Liu, Z., Yuan, D. & Zheng, T. Effect of geometric accuracy at the proximal landing zone on simulation results for
thoracic endovascular repair patients. Cardiovasc. Eng. Technol. 11, 679–688. https://doi.org/10.1007/s13239-020-00498-4 (2020).
44. Xu, H. et al. Computed tomography-based hemodynamic index for aortic dissection. J. Thorac. Cardiovasc. Surg. https://doi.org/
10.1016/j.jtcvs.2020.02.034 (2020).
45. Gijsen, F. J., van de Vosse, F. N. & Janssen, J. D. The influence of the non-Newtonian properties of blood on the flow in large arter-
ies: Steady flow in a carotid bifurcation model. J. Biomech. 32, 601–608. https://doi.org/10.1016/s0021-9290(99)00015-9 (1999).
46. Karmonik, C. et al. Preliminary findings in quantification of changes in septal motion during follow-up of type B aortic dissections.
J. Vasc. Surg. 55, 1419–1426. https://doi.org/10.1016/j.jvs.2011.10.127 (2012).
47. Stalder, A. F. et al. Assessment of flow instabilities in the healthy aorta using flow-sensitive MRI. J. Magn. Reson. Imaging 33,
839–846. https://doi.org/10.1002/jmri.22512 (2011).
48. Andayesh, M., Shahidian, A. & Ghassemi, M. Numerical investigation of renal artery hemodynamics based on the physiological
response to renal artery stenosis. Biocybern. Biomed. Eng. 40, 1458–1468. https://doi.org/10.1016/j.bbe.2020.08.006 (2020).
49. Alimohammadi, M. et al. Aortic dissection simulation models for clinical support: Fluid-structure interaction vs. rigid wall models.
Biomed. Eng. Online 14, 34. https://doi.org/10.1186/s12938-015-0032-6 (2015).
50. Menichini, C., Cheng, Z., Gibbs, R. & Xu, X. Predicting false lumen thrombosis in patient-specific models of aortic dissection. J.
R. Soc. Interface 13, 20160759. https://doi.org/10.1098/rsif.2016.0759 (2016).
51. Alimohammadi, M., Agu, O., Balabani, S. & Díaz-Zuccarini, V. Development of a patient-specific simulation tool to analyse aortic
dissections: Assessment of mixed patient-specific flow and pressure boundary conditions. Med. Eng. Phys. 36, 275–284. https://
doi.org/10.1016/j.medengphy.2013.11.003 (2014).
52. Gorre, F. & Vandekerckhove, H. Beta-blockers: Focus on mechanism of action. Which beta-blocker, when and why? Acta Cardiol.
65, 565–570. https://doi.org/10.1080/ac.65.5.2056244 (2010).
53. Taylor, C. A., Fonte, T. A. & Min, J. K. Computational fluid dynamics applied to cardiac computed tomography for noninvasive
quantification of fractional flow reserve: Scientific basis. J. Am. Coll. Cardiol. 61, 2233–2241. https://doi.org/10.1016/j.jacc.2012.
11.083 (2013).
54. Vardhan, M. et al. Non-invasive characterization of complex coronary lesions. Sci. Rep. 11, 8145. https://doi.org/10.1038/s41598-
021-86360-6 (2021).
55. Wilson, R. F., Wyche, K., Christensen, B. V., Zimmer, S. & Laxson, D. D. Effects of adenosine on human coronary arterial circula-
tion. Circulation 82, 1595–1606. https://doi.org/10.1161/01.cir.82.5.1595 (1990).
56. Bozinovski, J. & Coselli, J. S. Outcomes and survival in surgical treatment of descending thoracic aorta with acute dissection. Ann.
Thorac. Surg. 85, 965–970 (2008). https://doi.org/10.1016/j.athoracsur.2007.11.013 (discussion 970–961).
57. Qiao, Y. et al. Numerical simulation of two-phase non-Newtonian blood flow with fluid-structure interaction in aortic dissection.
Comput. Methods Biomech. Biomed. Eng. 22, 620–630. https://doi.org/10.1080/10255842.2019.1577398 (2019).
58. Tsai, T. T. et al. Long-term survival in patients presenting with type A acute aortic dissection: Insights from the International
Registry of Acute Aortic Dissection (IRAD). Circulation 114, I350-356. https://doi.org/10.1161/circulationaha.105.000497 (2006).
59. Xiong, Z. et al. A computational fluid dynamics analysis of a patient with acute non-A-non-B aortic dissection after type I hybrid
arch repair. Med. Eng. Phys. 77, 43–52. https://doi.org/10.1016/j.medengphy.2019.10.019 (2020).
60. Armour, C. H. et al. The influence of inlet velocity profile on predicted flow in type B aortic dissection. Biomech. Model. Mecha-
nobiol. 20, 481–490. https://doi.org/10.1007/s10237-020-01395-4 (2021).
61. Campbell, I. C. et al. Effect of inlet velocity profiles on patient-specific computational fluid dynamics simulations of the carotid
bifurcation. J. Biomech. Eng. 134, 051001. https://doi.org/10.1115/1.4006681 (2012).
62. Morbiducci, U., Ponzini, R., Gallo, D., Bignardi, C. & Rizzo, G. Inflow boundary conditions for image-based computational hemo-
dynamics: Impact of idealized versus measured velocity profiles in the human aorta. J. Biomech. 46, 102–109. https://doi.org/10.
1016/j.jbiomech.2012.10.012 (2013).
63. Pirola, S. et al. Computational study of aortic hemodynamics for patients with an abnormal aortic valve: The importance of sec-
ondary flow at the ascending aorta inlet. APL Bioeng. 2, 026101–026101. https://doi.org/10.1063/1.5011960 (2018).
Acknowledgements
The authors would be grateful to Dr. Arsis Ahmadieh and Salar Samimi for providing the CT images.
Author contributions
M.A.A. and M.A. conceived the idea. M.A.A. carried out the simulations, analyzed the data, and drafted the
original-manuscript. D.R. participated in data analysis. M.A.A., M.S. and M.A. made revisions. All authors
discussed the results and approved the final manuscript.
Funding
The study was not supported by any funding.
Competing interests
The authors declare no competing interests.
Scientific Reports | (2021) 11:16058 | https://doi.org/10.1038/s41598-021-95315-w 13
Vol.:(0123456789)www.nature.com/scientificreports/
Additional information
Supplementary Information The online version contains supplementary material available at https://doi.org/
10.1038/s41598-021-95315-w.
Correspondence and requests for materials should be addressed to M.S. or M.A.
Reprints and permissions information is available at www.nature.com/reprints.
Publisher’s note Springer Nature remains neutral with regard to jurisdictional claims in published maps and
institutional affiliations.
Open Access This article is licensed under a Creative Commons Attribution 4.0 International
License, which permits use, sharing, adaptation, distribution and reproduction in any medium or
format, as long as you give appropriate credit to the original author(s) and the source, provide a link to the
Creative Commons licence, and indicate if changes were made. The images or other third party material in this
article are included in the article’s Creative Commons licence, unless indicated otherwise in a credit line to the
material. If material is not included in the article’s Creative Commons licence and your intended use is not
permitted by statutory regulation or exceeds the permitted use, you will need to obtain permission directly from
the copyright holder. To view a copy of this licence, visit http://creativecommons.org/licenses/by/4.0/.
© The Author(s) 2021
Scientific Reports | (2021) 11:16058 | https://doi.org/10.1038/s41598-021-95315-w 14
Vol:.(1234567890)You can also read


