Early childhood development of white matter fiber density and morphology - bioRxiv
←
→
Page content transcription
If your browser does not render page correctly, please read the page content below
bioRxiv preprint first posted online May. 8, 2019; doi: http://dx.doi.org/10.1101/624171. The copyright holder for this preprint (which
       was not peer-reviewed) is the author/funder, who has granted bioRxiv a license to display the preprint in perpetuity.
                                 It is made available under a CC-BY-NC-ND 4.0 International license.

      Early childhood development of white matter fiber density and
      morphology
                           a,b,c,d*                            b,c,d                        e,f                    e,f         g
      Dennis Dimond                   , Christiane S. Rohr             , Robert E. Smith          , Thijs Dhollander   , Ivy Cho , Catherine

               b,c,d,h,i                      b,d,h,j,k                      e,f                  b,c,d,h,i,l,
      Lebel            , Deborah Dewey                    , Alan Connelly          , Signe Bray

      a
          Department of Neuroscience, Cumming School of Medicine, University of Calgary, Calgary, AB, Canada
      b
          Alberta Children's Hospital Research Institute, University of Calgary, Calgary, AB, Canada.
      c
          Child and Adolescent Imaging Research Program, University of Calgary, Calgary, AB, Canada.
      d
          Hotchkiss Brain Institute, University of Calgary, Calgary, AB, Canada
      e
          The Florey Institute of Neuroscience and Mental Health, Melbourne, VIC, Australia
      f
          The Florey Department of Neuroscience and Mental Health, The University of Melbourne, Melbourne, VIC,
      Australia
      g
          Department of Psychological Clinical Sciences, University of Toronto, Toronto, ON, Canada
      h
          Owerko Centre, University of Calgary, Calgary, AB, Canada
      i
          Mathison Centre for Mental Health Research and Education, University of Calgary, Calgary, AB, Canada
      j
          Department of Paediatrics, Cumming School of Medicine, University of Calgary, Calgary, AB, Canada.
      k
          Department of Community Health Sciences, University of Calgary, Calgary, AB, Canada
      l
          Department of Radiology, Cumming School of Medicine, University of Calgary, Calgary, AB, Canada
                              *
      Correspondence:             indicates corresponding author

      Dennis Dimond; dennis.dimond@ucalgary.ca ; 1-403-955-5704; Alberta Children’s Hospital, 28 Oki Drive
      NW, Calgary, Alberta, Canada, T3B 6A8.

      Running title: Fiber density and cross-section maturation during early childhood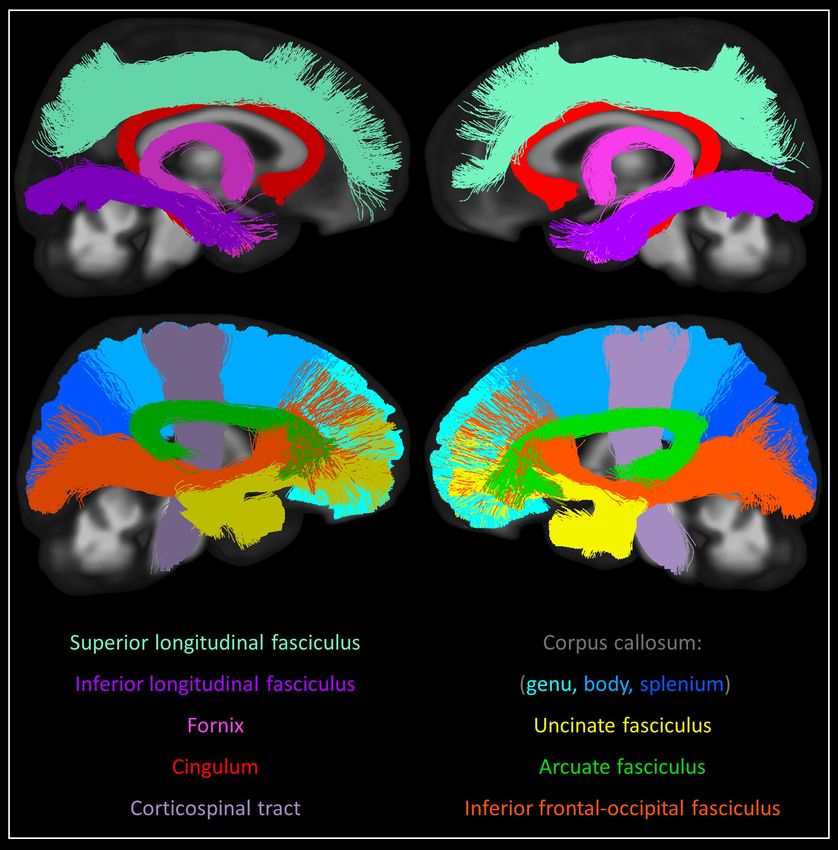
bioRxiv preprint first posted online May. 8, 2019; doi: http://dx.doi.org/10.1101/624171. The copyright holder for this preprint (which
       was not peer-reviewed) is the author/funder, who has granted bioRxiv a license to display the preprint in perpetuity.
                                 It is made available under a CC-BY-NC-ND 4.0 International license.

                                                                   ABSTRACT

      Early childhood is an important period for cognitive and brain development, though white matter
      changes specific to this period remain understudied. Here we utilize a novel analytic approach to
      quantify and track longitudinal changes in white matter micro- and macro-structure, calculated from
      individually oriented fiber-bundle populations, termed “fixels”. Fixel-based analysis and mixed-effects
      models were used to assess tract-wise changes in fiber density and bundle morphology in 73 girls
      scanned at baseline (ages 4.09-7.02, mean=5.47, SD=0.81), 6-month (N=7), and one-year follow-up
      (N=42). We also assessed changes in fractional anisotropy (FA) and mean diffusivity (MD). Maturational
      increases in fixel-metrics were seen in most major white matter tracts, with the most rapid increases in
      the corticospinal tract and slowest or non-significant increases in the genu of the corpus callosum and
      uncinate fasciculus. As expected, we observed developmental increases in FA and decreases in MD,
      though percentage changes were smaller than fixel-metrics. The majority of tracts showed more
      substantial morphological than microstructural changes. These findings highlight early childhood as a
      period of dynamic white matter maturation, characterized by large increases in macroscopic fiber
      bundle size, mild changes in axonal density, and parallel, albeit less substantial, changes in diffusion
      tensor metrics.

      Key words: Early childhood; Fiber bundle morphology; Fiber density; Fixel-based analysis; White

      matter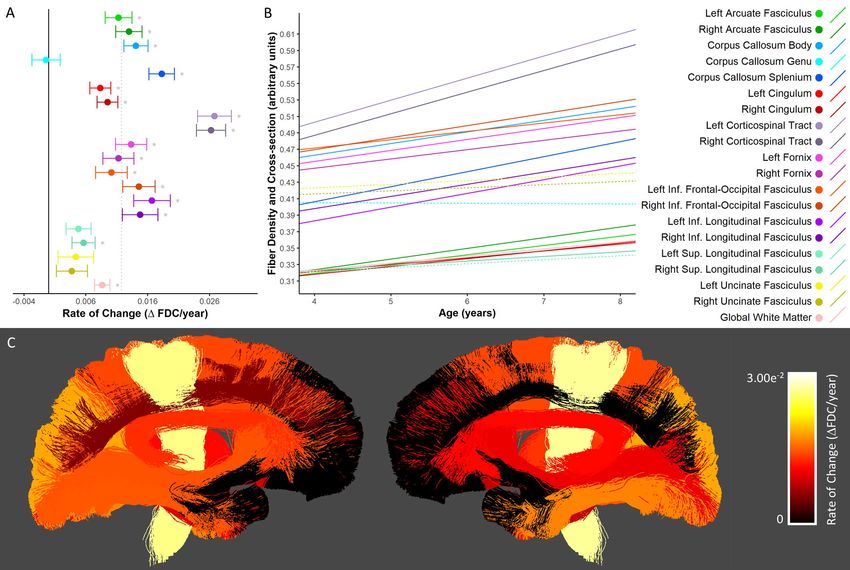
bioRxiv preprint first posted online May. 8, 2019; doi: http://dx.doi.org/10.1101/624171. The copyright holder for this preprint (which
       was not peer-reviewed) is the author/funder, who has granted bioRxiv a license to display the preprint in perpetuity.
                                 It is made available under a CC-BY-NC-ND 4.0 International license.

                Early childhood is a period of rapid cognitive and behavioral maturation, with profound changes
      in attention, working memory, reading, math, and self-regulatory abilities (Ferretti et al. 2008; Burnett
      Heyes et al. 2012; Breckenridge et al. 2013; Montroy et al. 2016; Garon-Carrier et al. 2018). Maturation
      of these essential cognitive-behavioral skills is believed to be related to white matter growth in the brain
      (Qiu et al. 2008; Van Eimeren et al. 2008; Klarborg et al. 2013; Jolles et al. 2016; Bathelt et al. 2018),
      though developmental trajectories of white matter maturation and the biological underpinnings of
      these changes remain poorly understood. The reason for this is two-fold. Firstly, while white matter
      development throughout the lifespan has been well characterized (Westlye et al. 2010; Lebel et al.
      2012; Yeatman et al. 2014), few studies have focused on white matter changes during early childhood.
      Secondly, most studies make use of the diffusion tensor model (subsequently referred to simply as
      diffusion tensor imaging or “DTI”), which provides only limited insight into the biological changes
      underlying white matter growth. This limitation is due to the unreliability of DTI metrics in regions of
      crossing/kissing fibers (Jeurissen et al. 2013) and the fact that such metrics are potentially sensitive to a
      range of microstructural features. Age-related changes in fractional anisotropy (FA) and mean diffusivity
      (MD) from birth to adulthood have been suggested to potentially reflect developmental increases in
      axonal packing, myelination, or so-called white matter “integrity” (Lebel and Deoni 2018), but it is not
      possible to infer information related to specific tracts or to be clear which biological features are
      changing using these metrics. Studies utilizing higher-order diffusion models are necessary to provide a
      more specific description of changes in white matter structural properties during early childhood.

                Advanced diffusion imaging techniques, which provide metrics with greater structural
      specificity, are increasingly being applied to investigate white matter development. One such technique
      is fixel-based analysis (FBA; (Raffelt, Tournier, et al. 2017)), which is a novel approach to quantify and
      analyze white matter micro- and macro-structure within “fixels” (specific fiber-bundle populations
      within a voxel (Raffelt et al. 2015)). FBA can be utilized in combination with constrained spherical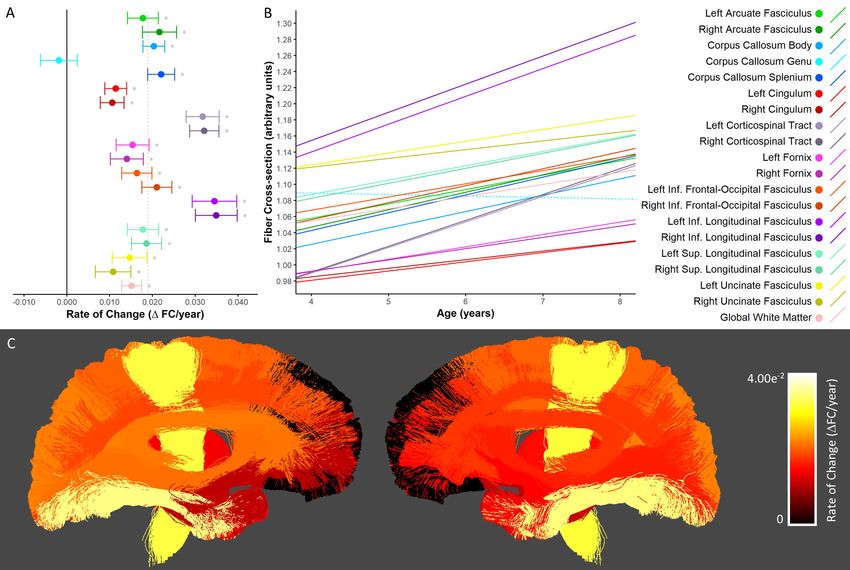
bioRxiv preprint first posted online May. 8, 2019; doi: http://dx.doi.org/10.1101/624171. The copyright holder for this preprint (which
       was not peer-reviewed) is the author/funder, who has granted bioRxiv a license to display the preprint in perpetuity.
                                 It is made available under a CC-BY-NC-ND 4.0 International license.

      deconvolution (CSD) techniques (Tournier et al. 2007; Jeurissen et al. 2014; Dhollander and Connelly
      2016) to delineate multiple fiber bundle populations within a voxel, making it possible to calculate and
      assess fixel-wise metrics sensitive to axonal density/packing (“Fiber Density (FD)”), fiber bundle cross-
      sectional size (“Fiber Cross-section (FC)”), and a combined measure encompassing both micro- and
      macrostructure (“Fiber Density and Cross-section (FDC)”) [Raffelt et al., 2017a]. These metrics are
      arguably of greater specificity and interpretability than voxel-wise DTI metrics like FA and MD (Raffelt,
      Tournier, et al. 2017).

                Studies utilizing FBA in a neurodevelopmental context suggest white matter development from
      late childhood to early adulthood may be driven by increases in both axonal packing/density and fiber
      bundle size (Genc, Seal, et al. 2017; Genc, Malpas, et al. 2018; Genc, Smith, et al. 2018; Genc et al.
      2019). Age-related increases in axonal packing/density from late childhood to adulthood have also been
      suggested by studies utilizing an alternative diffusion model, “neurite orientation and dispersion density
      imaging (NODDI)” (Chang et al. 2015; Genc, Malpas, et al. 2017; Mah et al. 2017); these changes have
      been shown to occur alongside increasing FA and decreasing MD during late childhood to adulthood and
      correlate more strongly with age than DTI metrics (Genc, Malpas, et al. 2017; Mah et al. 2017). Taken
      together, these findings suggest that increasing axonal density/packing and fiber bundle size underlie
      the DTI changes observed in late-childhood to adulthood, though whether this is the case in early
      childhood remains unclear.

                Brain development is notably heterochronous, and spatial trends in white matter development
      during early childhood remain relatively unclear. Lifetime changes in FA and MD have been shown to
      occur across major white matter tracts in a posterior-to-anterior fashion, with earliest maturation of
      projection and commissural fibers, followed by association fibers, and then frontal-temporal fibers,
      which mature into adulthood (Lebel et al. 2012). A recent large sample study in children ages 2-8 years
      provides evidence in support of this pattern, showing that changes in diffusion tensor metrics (FA and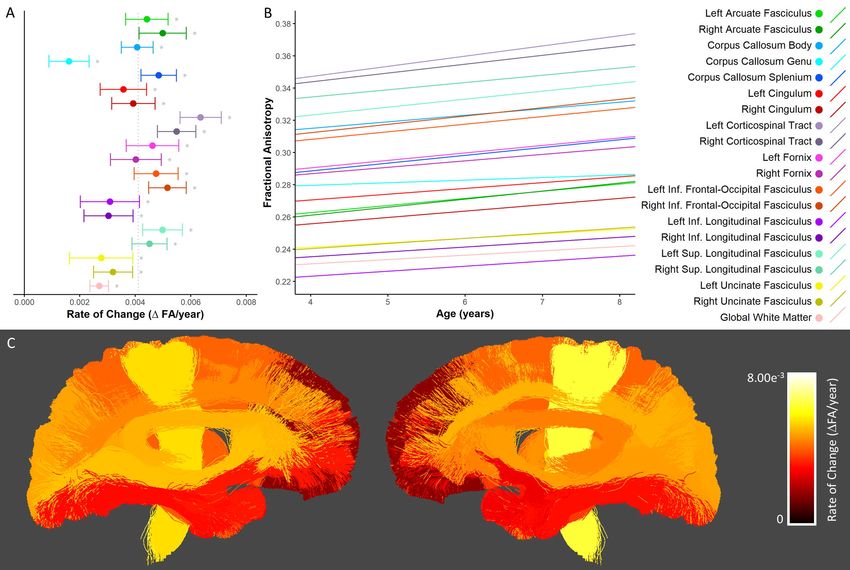
bioRxiv preprint first posted online May. 8, 2019; doi: http://dx.doi.org/10.1101/624171. The copyright holder for this preprint (which
       was not peer-reviewed) is the author/funder, who has granted bioRxiv a license to display the preprint in perpetuity.
                                 It is made available under a CC-BY-NC-ND 4.0 International license.

      MD) across early childhood are more rapid in posterior regions as compared to frontal-temporal tracts
      (Reynolds et al. 2019). This spatial trend is also supported by FBA (Genc, Smith, et al. 2018) and NODDI
      (Mah et al. 2017) studies showing that axonal density/packing changes during late childhood are
      greatest in the forceps major, a posterior commissural fiber. These findings suggest that developmental
      changes in axonal density may follow a similar spatial pattern to changes observed in DTI metrics.

                The aim of the current study was to characterize longitudinal changes in axonal packing/density
      and fiber bundle size of major white matter tracts during early childhood. To do this, we utilized 3-tissue
      CSD (Dhollander and Connelly 2016) in conjunction with FBA (Raffelt, Tournier, et al. 2017) to assess
      tract-wise changes in FBA metrics (FD, FC and FDC) in typically developing girls aged 4-8 years, scanned
      at baseline, 6-month and 12-month follow-up. To compare our findings to more commonly used DTI
      metrics, we also assessed changes in FA and MD. Considering previous literature suggestive of
      widespread developmental increases in axonal packing and fiber bundle size from late childhood to
      adulthood (Chang et al. 2015; Genc, Malpas, et al. 2017, 2018; Mah et al. 2017; Genc, Smith, et al.
      2018), we hypothesized that FD, FC, and FDC would all increase longitudinally throughout the whole
      brain (but particularly in major white matter tracts), indicative of ubiquitous axonal density and cross-
      sectional fiber bundle growth during early childhood. Furthermore, considering evidence for varying
      rates of maturation across white matter tracts (Lebel et al. 2012; Reynolds et al. 2019), we hypothesized
      that FD, FC and FDC changes would be most rapid in commissural and projection fibers, and slowest in
      frontal-temporal tracts.

      MATERIALS AND METHODS

      Participants

           Seventy-six typically developing girls were recruited from the Calgary area and underwent diffusion
      MRI scanning and cognitive testing at baseline (ages 4.09-7.02, mean=5.47, SD=0.81). A subset also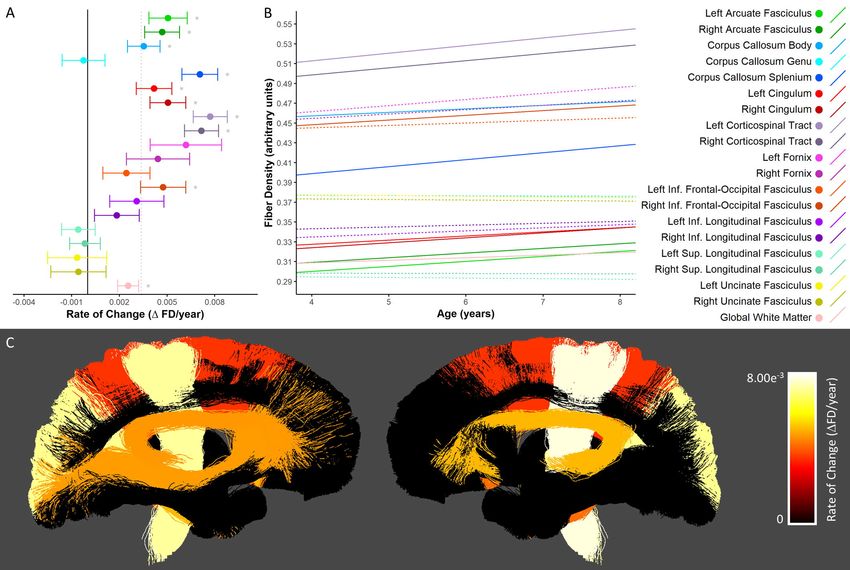
bioRxiv preprint first posted online May. 8, 2019; doi: http://dx.doi.org/10.1101/624171. The copyright holder for this preprint (which
       was not peer-reviewed) is the author/funder, who has granted bioRxiv a license to display the preprint in perpetuity.
                                 It is made available under a CC-BY-NC-ND 4.0 International license.

      participated in 6-month (N=7, ages 4.61-7.01, mean=5.57, SD=0.77) and 12-month (N=43, ages 5.13-
      7.89, mean=6.43, SD=0.74) follow-up scans. Four data sets, 3 of which belonged to participants with
      only one time-point, were excluded from the study due to poor data quality (described in more detail
      below). The final sample therefore consisted of 122 total scans collected from 73 participants at baseline
      (N=73), 6-month follow-up (N=7), and 12-month follow-up (N=42). The study was approved by the
      Conjoint Health and Research Ethics Board at the University of Calgary. Informed consent was obtained
      from the parents and informed assent from the participants.

      Data acquisition

           Data were collected at the Alberta Children’s Hospital and included diffusion and structural (T1-
      weighted) MR images, as well as handedness. MRI data were acquired on a 3T GE MR750w (Waukesha,
      WI) scanner using a 32-channel head coil. Diffusion-weighted images (DWIs) were acquired using a 2D
      spin echo EPI sequence (b=2000s/mm2, 45 diffusion-weighted directions, 3 non-DWI (b=0) images,
      2.5mm3 isotropic voxels, 45 slices, 23x23cm FOV, TE=86.2ms, TR=10s). Structural images were obtained
      using a T1-weighted 3D BRAVO sequence (0.8mm3 isotropic voxels, 24x24cm FOV, TI=600ms, FA=10°).

      Structural image processing

           Structural T1-weighted images were utilized to calculate intra-cranial volume (ICV) for use as a
      nuisance covariate in statistical analysis. It is generally recommended that ICV be included as a covariate
      in FBA to account for relative differences in head size, which may vary with age and thus potentially
      influence morphological fixel-based white matter metrics (fiber cross-section (FC) in particular). T1-
      weighted images were bias field corrected (Tustison et al. 2010), and ICV estimated using the
      Computational Anatomy Toolbox (CAT; http://www.neuro.uni-jena.de/cat/) in SPM 12
      (https://www.fil.ion.ucl.ac.uk/spm/software/spm12/).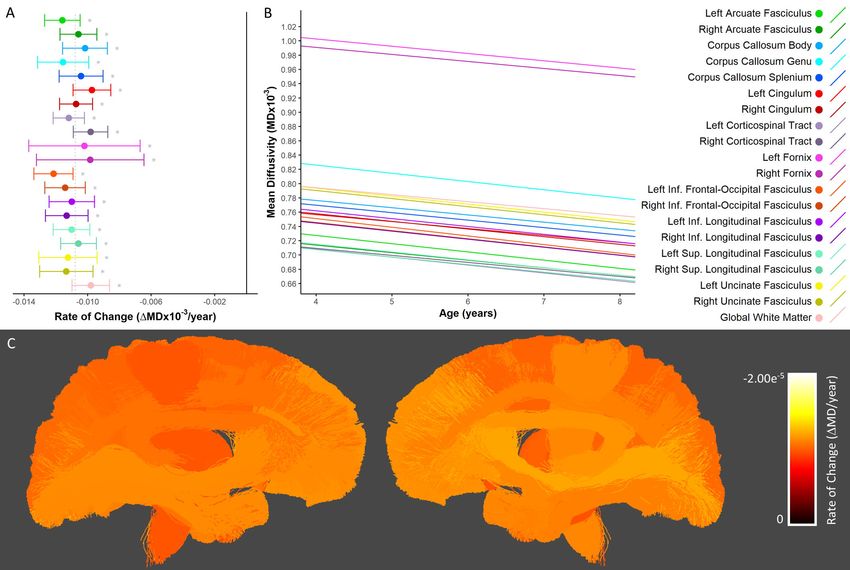
bioRxiv preprint first posted online May. 8, 2019; doi: http://dx.doi.org/10.1101/624171. The copyright holder for this preprint (which
       was not peer-reviewed) is the author/funder, who has granted bioRxiv a license to display the preprint in perpetuity.
                                 It is made available under a CC-BY-NC-ND 4.0 International license.

      DWI preprocessing and motion assessment

             To mitigate effects of head motion, which are particularly prevalent in this age range, we utilized
      current state-of-the-art DWI pre-processing (Andersson and Sotiropoulos 2016) provided in FSL
      (Jenkinson et al. 2012), including replacement of slice-wise signal dropout (Andersson et al. 2016) and
      within-volume motion correction (Andersson et al. 2017). DWI volumes for which more than 20% of
      slices were classified as containing signal dropout were removed from the data, and scans for which
      more than 10% of volumes were removed were excluded from the study entirely (resulting in the
      exclusion of 4 scans from 3 participants). To quantify and control for the potential influence of head
      motion on outcome measures, we calculated the total number of signal dropout slices per dataset for
      use as a covariate in statistical analyses. Following motion correction, bias fields estimated from the
      mean b=0 images were utilized to bias field correct the DWIs (Tustison et al. 2010; Raffelt, Tournier,
      Rose, et al. 2012), which were subsequently upsampled to 1.25mm3 isotropic voxels.

      FBA and fixel metrics

             To calculate fixel-based metrics we generally followed the MRtrix3 (Tournier et al. 2019) FBA
      processing pipeline1 (Raffelt, Tournier, et al. 2017), with the exception that instead of using the standard
      constrained spherical deconvolution approach (Tournier et al. 2007) estimation of white matter fiber
      orientation distributions (FODs) was done for each participant via “single-shell 3-tissue constrained
      spherical deconvolution” (SS3T-CSD) (Dhollander and Connelly 2016) using a group averaged response
      function for each tissue type (white matter, grey matter and CSF) (Raffelt, Tournier, Rose, et al. 2012;
      Dhollander et al. 2016). The remaining processing steps included: global intensity normalization of FOD
      images (Raffelt, Dhollander, et al. 2017); generation of a study-specific FOD template (Raffelt et al.
      2011); registration of FOD images to template space (Raffelt, Tournier, Crozier, et al. 2012);
      segmentation of both template and per-scan FODs in template space to identify discrete fixels [Smith et

      1
          https://mrtrix.readthedocs.io/en/3.0_rc2/fixel_based_analysis/mt_fibre_density_cross-section.html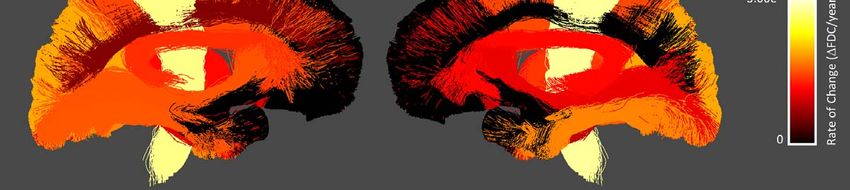
bioRxiv preprint first posted online May. 8, 2019; doi: http://dx.doi.org/10.1101/624171. The copyright holder for this preprint (which
       was not peer-reviewed) is the author/funder, who has granted bioRxiv a license to display the preprint in perpetuity.
                                 It is made available under a CC-BY-NC-ND 4.0 International license.

      al., 2013]; and identification and assignment of corresponding fixels between the scans and the
      template (Raffelt et al. 2015).

      Following these processing steps, we calculated the three standard fixel-based metrics for FBA [Raffelt
      et al., 2017a]:

           1) Fiber density (FD): a microstructural metric that serves as a proxy for axonal density or packing;

           2) Fiber cross-section (FC): a macrostructural metric that approximates relative fiber bundle

                diameter or size;
           3) Fiber density and cross-section (FDC): the product of FD and FC, which encapsulates changes to

                both micro- and macro-structure.

      Template-based tractography and tract means

           A whole-brain tractogram was first generated via probabilistic tractography (Tournier et al. 2010)
      performed on the FOD template (Raffelt et al. 2015) using random seeding throughout the entire
      template, with 20 million streamlines generated (tractography parameters: step size=0.625mm, max
      angle between steps=22.5°, min/max fiber length=10mm/250mm, cut-off FOD amplitude=0.1).
      Spherical-deconvolution informed filtering of tractograms (SIFT) (Smith et al. 2013) was then used to
      reduce the tractogram to 2 million streamlines exhibiting reduced global reconstruction biases.

           We extracted major white matter tracts of interest from this tractogram using manually-defined
      inclusion and exclusion ROIs (Supplementary Table 1). These tracts included: the arcuate fasciculi,
      cingulum bundles, corticospinal tracts, fornix bundles, inferior frontal-occipital fasciculi, inferior
      longitudinal fasciculi, superior longitudinal fasciculi and uncinate fasciculi, as well as the genu, body and
      splenium of the corpus callosum and their projections to the cortex (Figure 1).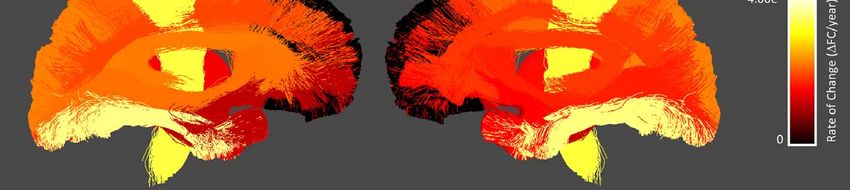
bioRxiv preprint first posted online May. 8, 2019; doi: http://dx.doi.org/10.1101/624171. The copyright holder for this preprint (which
       was not peer-reviewed) is the author/funder, who has granted bioRxiv a license to display the preprint in perpetuity.
                                 It is made available under a CC-BY-NC-ND 4.0 International license.

      Figure 1. Tracts of interest.       Bilateral white matter tracts of interest included in the study. Three-
      dimensional tracts are overlaid onto 2D slices of study template space and coloured according to the
      figure legend. Tracts are approximately split into medial (top row) and lateral (bottom row) groups for
      visual clarity.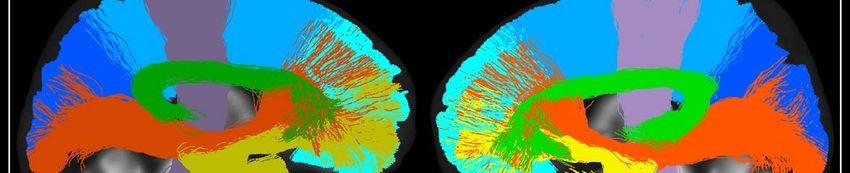
bioRxiv preprint first posted online May. 8, 2019; doi: http://dx.doi.org/10.1101/624171. The copyright holder for this preprint (which
       was not peer-reviewed) is the author/funder, who has granted bioRxiv a license to display the preprint in perpetuity.
                                 It is made available under a CC-BY-NC-ND 4.0 International license.

           These tracts were utilized to create both voxel and fixel masks. For each bundle, only fixels through
      which at least 5 streamlines passed, and that had a maximum template FOD amplitude of at least 0.1,
      were included in the fixel mask for that bundle; a corresponding voxel mask was then constructed that
      included all voxels containing at least one fixel within the respective mask.

           For each scan, we calculated the mean FD, FC, FDC, MD and FA of each tract, by averaging values of
      the template-normalized metric images across voxels/fixels contained within the relevant masks (voxel
      masks for MD and FA; fixel masks for FD, FC and FDC). Additionally, to assess global brain changes, we
      generated global white matter voxel/fixel masks based on a maximum template FOD amplitude
      threshold of 0.1 and calculated mean values of voxel/fixel-wise metrics within these masks for each
      subject. This “global white matter mask” therefore included white matter voxels/fixels beyond those
      encompassed by the tract-wise masks.

      Statistical analysis

           To assess changes in tract-wise diffusion metrics with age, we utilized linear mixed effects models
      performed using lme4 (Bates et al. 2017) in R (R Core Team 2014). For all models we included age,
      handedness, ICV, and total number of signal dropout slices as fixed effects, and participant-specific
      intercepts as a random effect. Visual inspection revealed no obvious non-linear relationships or
      deviations from homoscedasticity or residual normality. P-values for t-statistics were obtained using the
      Satterthwaite’s degrees of freedom method (Hrong-Tai Fai and Cornelius 2007), as implemented in
      lmerTest     (Kuznetsova et al. 2017). False discovery rate (FDR) was utilized to control for multiple
      comparisons within metrics, with statistical inference set at p
bioRxiv preprint first posted online May. 8, 2019; doi: http://dx.doi.org/10.1101/624171. The copyright holder for this preprint (which
was not peer-reviewed) is the author/funder, who has granted bioRxiv a license to display the preprint in perpetuity.
It is made available under a CC-BY-NC-ND 4.0 International license.
Data visualization
For each imaging metric (FA, MD, FD, FC, FDC) we provide a figure with three panels: panel A shows
tract-wise rates of change with confidence intervals to facilitate comparison of maturational rates across
tracts; panel B shows linear developmental trajectories, to illustrate tract-wise developmental patterns
and facilitate comparison of metric values; panel C shows an anatomical heat-map image of tract-wise
rates of change, to illustrate spatial trends. A scatterplot of individual scan global white matter values is
provided for each metric in Supplementary Figure 1. Following within-metric findings, we summarize
trends in development of each tract across metrics by converting tract-wise rates of change to z-scores.
For each imaging metric of interest individually, the rates of change across all regions of interest (19
tracts, as well as the global white matter mask) were converted to z-scores; thus, five z-scores were
produced for each region of interest (one for each imaging metric). Here, MD z-scores were negated to
facilitate comparison of across metrics, given MD has a negative relationship with age, unlike other
metrics utilized in the study. The resulting z-scores are plotted alongside one another for visual
comparison, and an anatomical image in which the five z-scores (one for each imaging metric) are
averaged within tracts is provided to illustrate spatial trends.
RESULTS
Fiber Density (FD)
Significant increases in FD were seen bilaterally in the arcuate fasciculi, cingulum bundles, and
corticospinal tracts, as well as the body and splenium of the corpus callosum, the right inferior frontal-
occipital fasciculus, and the global white matter mask (Figure 2A-B). The most rapid increases were seen
in the bilateral corticospinal tract and splenium of the corpus callosum; slower statistically significant
increases were seen in the body of the corpus callosum and global white matter mask; changes in the
genu of the corpus callosum, fornix bundles, left inferior frontal-occipital fasciculus, inferior longitudinalbioRxiv preprint first posted online May. 8, 2019; doi: http://dx.doi.org/10.1101/624171. The copyright holder for this preprint (which
was not peer-reviewed) is the author/funder, who has granted bioRxiv a license to display the preprint in perpetuity.
It is made available under a CC-BY-NC-ND 4.0 International license.
fasciculus, superior longitudinal fasciculi and uncinate fasciculi were not significant. Across those tracts
with statistically significant growth, FD values increased by 3.1-7.1% (Supplementary Table 2); the
largest percentage increases were seen in the splenium of the corpus callosum (7.1%), the left arcuate
fasciculus (6.8%), and the right cingulum (6.2%). Spatially, tracts extending into frontal cortex (i.e. the
genu of the corpus callosum, inferior frontal-occipital fasciculi, and uncinate fasciculi) and temporal
lobes (i.e. the inferior longitudinal fasciculi and uncinate fasciculi) showed slower and/or non-significant
FD changes (Figure 2C).bioRxiv preprint first posted online May. 8, 2019; doi: http://dx.doi.org/10.1101/624171. The copyright holder for this preprint (which
was not peer-reviewed) is the author/funder, who has granted bioRxiv a license to display the preprint in perpetuity.
It is made available under a CC-BY-NC-ND 4.0 International license.
Figure 2. Developmental changes in fiber density. A) Rate of change in FD shown for each tract. *
denotes tracts in which changes were statistically significant (pbioRxiv preprint first posted online May. 8, 2019; doi: http://dx.doi.org/10.1101/624171. The copyright holder for this preprint (which
was not peer-reviewed) is the author/funder, who has granted bioRxiv a license to display the preprint in perpetuity.
It is made available under a CC-BY-NC-ND 4.0 International license.
Fiber Cross-section (FC)
Significant FC increases were seen in all white matter tracts assessed here except for the genu of the
corpus callosum (Figure 3A-B). Across tracts with statistically significant growth, the most rapid increases
occurred in the bilateral corticospinal tract and inferior longitudinal fasciculi, while slower increases
were observed in the bilateral cingulum, uncinate fasciculi, and fornix bundles. Percentage increases
ranged from 3.87-13.0% (Supplementary Table 3) across tracts with statistically significant growth.
Percent increases mirrored absolute rates of change, with the greatest percentage increases in the
bilateral corticospinal tract and the smallest increase in the right uncinate fasciculus. Spatially, increases
were more rapid in posterior brain regions, with slower maturation in tracts that connect to the frontal
cortex (i.e. the uncinate fasciculi, and genu of the corpus callosum), as well as in tracts connecting deep
brain structures (i.e. the cingulum and fornix bundles).bioRxiv preprint first posted online May. 8, 2019; doi: http://dx.doi.org/10.1101/624171. The copyright holder for this preprint (which
was not peer-reviewed) is the author/funder, who has granted bioRxiv a license to display the preprint in perpetuity.
It is made available under a CC-BY-NC-ND 4.0 International license.
Figure 3. Developmental changes in fiber cross-section. A) Rate of change in FC shown for each tract. *
denotes tracts in which there was significant growth. The solid black vertical line indicates zero change,
while the dotted gray vertical line indicates the mean rate of change across all tracts. B) Linear
trajectories of FC growth for each tract. Solid lines indicate tracts in which there was a statistically
significant relationship with age; dotted lines correspond to non-significant tracts. C) Anatomical
visualization of tract-wise rates of change in FC. Streamlines corresponding to each tract are coloured
according to the rate of change of FC observed in that tract. Streamlines belonging to tracts in which the
rate of change was not significantly greater then zero were assigned a value of zero and appear black in
the figure.bioRxiv preprint first posted online May. 8, 2019; doi: http://dx.doi.org/10.1101/624171. The copyright holder for this preprint (which
was not peer-reviewed) is the author/funder, who has granted bioRxiv a license to display the preprint in perpetuity.
It is made available under a CC-BY-NC-ND 4.0 International license.
Fiber Density and Cross-section (FDC)
Significant increases in FDC were seen for all tracts except for the genu of the corpus callosum,
the uncinate fasciculi and the left superior longitudinal fasciculus (Figure 4A-B). Across tracts with
statistically significant growth, the rate of change was most rapid in the corticospinal tract bilaterally,
and slowest in the right superior longitudinal fasciculus. FDC increased 6.9-21.6% across those tracts
with significant growth (Supplementary Table 4), with the greatest percent increases in the corticospinal
tracts, and the smallest percent increase in the right superior longitudinal fasciculus. Rate of change was
generally more rapid in tracts that connect to posterior regions of the brain (i.e. the splenium and
inferior longitudinal fasciculi), and slower or non-significant in tracts that make connections to the
frontal cortex (i.e. the uncinate fasciculi, superior longitudinal fasciculi, and genu of the corpus callosum;
Figure 4C).bioRxiv preprint first posted online May. 8, 2019; doi: http://dx.doi.org/10.1101/624171. The copyright holder for this preprint (which
was not peer-reviewed) is the author/funder, who has granted bioRxiv a license to display the preprint in perpetuity.
It is made available under a CC-BY-NC-ND 4.0 International license.
Figure 4. Developmental changes in fiber density and cross-section. A) Rate of change in FDC shown for
each tract. * denotes tracts in which there was significant growth. The solid black vertical line indicates
zero change, while the dotted gray vertical line indicates the mean rate of change across all tracts. B)
Linear trajectories of FDC growth for each tract. Solid lines indicate tracts in which there was a
statistically significant relationship with age; dotted lines correspond to non-significant tracts. C)
Anatomical visualization of tract-wise rates of change in FDC. Streamlines corresponding to each tract
are coloured according to the rate of change of FDC observed in that tract. Streamlines belonging to
tracts in which the rate of change was not significantly greater then zero were assigned a value of zero
and appear black in the figure.bioRxiv preprint first posted online May. 8, 2019; doi: http://dx.doi.org/10.1101/624171. The copyright holder for this preprint (which
was not peer-reviewed) is the author/funder, who has granted bioRxiv a license to display the preprint in perpetuity.
It is made available under a CC-BY-NC-ND 4.0 International license.
Fractional Anisotropy
Similar to previous work (reviewed in (Lebel and Deoni 2018)), developmental increases in FA
were observed in all major white matter tracts, as well as the global white matter mask (Figure 5A-B).
Rates of FA increase were highly comparable across tracts; increases were slightly more rapid in the
corticospinal tract and inferior frontal-occipital fasciculi, and slightly slower in the genu of the corpus
callosum and the uncinate fasciculi. Percentage increases ranged from 2.0-7.6% and were largest in the
right arcuate fasciculus and smallest in the right uncinate fasciculus (Supplementary Table 5). Spatially,
rates of change were somewhat faster in posterior/superior tracts, and slower in tracts that connected
to anterior/inferior brain regions such as the frontal and temporal lobes (i.e. the uncinate fasciculi, genu
of the corpus callosum and inferior longitudinal fasciculi; Figure 5C).bioRxiv preprint first posted online May. 8, 2019; doi: http://dx.doi.org/10.1101/624171. The copyright holder for this preprint (which
was not peer-reviewed) is the author/funder, who has granted bioRxiv a license to display the preprint in perpetuity.
It is made available under a CC-BY-NC-ND 4.0 International license.
Figure 5. Developmental changes in fractional anisotropy. A) Rate of change in FA shown for each tract.
* denotes tracts in which there was significant growth. The solid black vertical line indicates zero
change, while the dotted gray vertical line indicates the mean rate of change across all tracts. B) Linear
trajectories of FA growth for each tract. Solid lines indicate tracts in which there was a statistically
significant relationship with age; dotted lines correspond to non-significant tracts. C) Anatomical
visualization of tract-wise rates of change in FA. Streamlines corresponding to each tract are coloured
according to the rate of change of FA observed in that tract.bioRxiv preprint first posted online May. 8, 2019; doi: http://dx.doi.org/10.1101/624171. The copyright holder for this preprint (which
was not peer-reviewed) is the author/funder, who has granted bioRxiv a license to display the preprint in perpetuity.
It is made available under a CC-BY-NC-ND 4.0 International license.
Mean Diffusivity
Consistent with the literature (reviewed in (Lebel and Deoni 2018)), significant MD decreases were
observed in all tested white matter tracts, as well as the global white matter mask (Figure 6A-B). Both
absolute rates of change and percent changes were highly uniform across all tracts. Percentage
decreases in MD ranged from 3.9-6.4% (Supplementary Table 6). Contrary to other metrics, MD of tracts
in anterior/inferior regions, such as those in the frontal and temporal lobes (i.e. the uncinate fasciculi,
inferior longitudinal fasciculi, inferior frontal-occipital fasciculi, and genu of the corpus callosum)
changed relatively faster than tracts in posterior/superior brain regions (Figure 6C).bioRxiv preprint first posted online May. 8, 2019; doi: http://dx.doi.org/10.1101/624171. The copyright holder for this preprint (which
was not peer-reviewed) is the author/funder, who has granted bioRxiv a license to display the preprint in perpetuity.
It is made available under a CC-BY-NC-ND 4.0 International license.
Figure 6. Developmental changes in mean diffusivity. A) Rate of change in MD shown for each tract. *
denotes tracts in which there was significant growth. The solid black vertical line indicates zero change,
while the dotted gray vertical line indicates the mean rate of change across all tracts. B) Linear
trajectories of MD growth for each tract. Solid lines indicate tracts in which there was a statistically
significant relationship with age; dotted lines correspond to non-significant tracts. C) Anatomical
visualization of tract-wise rates of change in MD. Streamlines corresponding to each tract are coloured
according to the rate of change of MD observed in that tract.bioRxiv preprint first posted online May. 8, 2019; doi: http://dx.doi.org/10.1101/624171. The copyright holder for this preprint (which
was not peer-reviewed) is the author/funder, who has granted bioRxiv a license to display the preprint in perpetuity.
It is made available under a CC-BY-NC-ND 4.0 International license.
Aggregating Results Across Metrics
Figure 7 depicts tract-wise metrics, z-scored within each metric, to facilitate visualization of
maturation patterns across metrics. Percent increases across metrics are shown in Supplementary
Figure 2. Figure 7A shows that across all metrics, more rapid changes were observed in the corticospinal
tracts, the right inferior frontal-occipital fasciculus and the splenium of the corpus callosum, while
slower maturation was found in the genu of the corpus callosum, the global white matter mask, and the
uncinate fasciculi. While some tracts showed consistently fast or slow maturation across metrics (e.g.
consistently fast maturation in the left corticospinal tract, and consistently slow maturation in the global
white matter mask), most tracts had variable rates of maturation across the various imaging metrics
(e.g. the fornix bundles, inferior longitudinal fasciculi, and superior longitudinal fasciculi). Interestingly,
for some tracts maturation of one imaging metric was vastly different than that of the other four (e.g.
the left inferior frontal-occipital fasciculus and inferior longitudinal fasciculi, which matured particularly
rapidly in MD and FC respectively). Spatially, incorporating data across all metrics tested, more rapid
maturation was seen in tracts connecting to posterior/inferior brain regions (e.g. the splenium of the
corpus callosum, corticospinal tracts and inferior longitudinal fasciculi), while slower maturation was
seen in tracts connecting to the frontal cortex (e.g. the genu of the corpus callosum, the uncinate
fasciculi and the superior longitudinal fasciculi; Figure 7B).
A notable observation from Figure 7A is that MD appears to have an opposite trend relative to other
metrics within some tracts (despite negation of MD z-scores); the genu of the corpus callosum and
uncinate fasciculus matured rapidly with respect to MD but slowly with respect to other metrics, the
corticospinal tract and splenium of the corpus callosum show the opposite trend, with slow MD
maturation and rapid maturation of FD, FC, FDC and FA. While this might suggest that MD maturation
follows a distinct pattern compared to the maturation of other metrics, it is important to note that there
was less variability in rates of change in MD compared to other metrics. In fact, in terms of absolutebioRxiv preprint first posted online May. 8, 2019; doi: http://dx.doi.org/10.1101/624171. The copyright holder for this preprint (which
was not peer-reviewed) is the author/funder, who has granted bioRxiv a license to display the preprint in perpetuity.
It is made available under a CC-BY-NC-ND 4.0 International license.
rates of change, the fastest changes and highest variability within a single metric was seen in FC, while
the largest percent increase was seen in FDC (Supplementary Figure 2). Because rates of change were
rather consistent across tracts for MD, we provide an additional plot of across-metric changes where
MD is not included (Figure 7C). Without MD, maturational rates across metrics appear to be more
uniform, though it remains apparent that some tracts have more variability than others; the bilateral
inferior longitudinal fasciculus and superior longitudinal fasciculus have large degrees of variability of
maturational rates across metrics, while the body of the corpus callosum, bilateral arcuate fasciculus,
right inferior frontal-occipital fasciculus and bilateral corticospinal tract appear to mature more
homogenously. Spatial growth trends remain generally unchanged with exclusion of MD (Figure 7D).bioRxiv preprint first posted online May. 8, 2019; doi: http://dx.doi.org/10.1101/624171. The copyright holder for this preprint (which
was not peer-reviewed) is the author/funder, who has granted bioRxiv a license to display the preprint in perpetuity.
It is made available under a CC-BY-NC-ND 4.0 International license.
Figure 7: Metric-wise z-scored tract maturation, with and without inclusion of mean diffusivity. A)
Tract-wise rate of change across FD, FC, FDC, FA and MD. Z-scores were calculated across tracts for each
metric. Tracts are listed in descending order of average z-scored rate of change. Solid circles indicate
statistically significant rates of change, while open circles indicate non-significant rates of change. The
dotted gray line indicates the average rate of change across metrics (i.e. a z-score equal to zero). B)
Anatomical visualization of tract-wise average z-scored rate of change across FD, FC, FDC and FA. In both
panels, a negative z-score indicates a below average maturational rate, while a positive z-score indicates
an above average maturational rate. C-D) Identical panels to A-B with MD excluded.bioRxiv preprint first posted online May. 8, 2019; doi: http://dx.doi.org/10.1101/624171. The copyright holder for this preprint (which
was not peer-reviewed) is the author/funder, who has granted bioRxiv a license to display the preprint in perpetuity.
It is made available under a CC-BY-NC-ND 4.0 International license.
DISCUSSION
In the current study we investigated age-related changes in fixel-based quantitative metrics and
compared developmental trajectories to historically utilized DTI metrics. We found that fiber density
(FD) increased in several (but not all) major white matter tracts, while fiber cross-section (FC) increased
in all tracts but one. Combined micro- and macro-structural growth (fiber density and cross-section
(FDC)) was observed in most tracts. These findings suggest that early childhood white matter
development is characterized by relatively widespread increases in cross-sectional fiber bundle size,
with additional localized increases in axonal density. These developmental changes were observed
alongside significantly increasing FA and decreasing MD in all tracts. Importantly, tracts exhibited unique
developmental trajectories within and across metrics, providing further evidence that white matter
maturation during early childhood is heterochronous. Furthermore, across all metrics except for MD we
observed a posterior-anterior maturational trend with faster maturation of tracts in posterior brain
regions and slower maturation of frontal tracts.
Fixel-based Metrics
White matter development during childhood is believed to be primarily driven by changes in
axonal packing (Lebel and Deoni 2018). This is based in part on recent evidence that neurite density
index (NDI), a proxy for axonal packing, shows widespread increases during childhood and adolescence
that are associated with age more strongly than DTI metrics FA and MD (Genc, Malpas, et al. 2017; Mah
et al. 2017). Here we see similar regional trends to those of NDI studies, with faster FD maturation in the
corticospinal tract and splenium of the corpus callosum (Chang et al. 2015; Jelescu et al. 2015) and high
relative changes in the cingulum bundles and arcuate fasciculi (Mah et al. 2017). Our findings are also
consistent with longitudinal FBA analyses in older children (aged 9-13), showing FD increases with age in
several WM tracts, including the corpus callosum, cingulum bundles, superior longitudinal fasciculi,bioRxiv preprint first posted online May. 8, 2019; doi: http://dx.doi.org/10.1101/624171. The copyright holder for this preprint (which
was not peer-reviewed) is the author/funder, who has granted bioRxiv a license to display the preprint in perpetuity.
It is made available under a CC-BY-NC-ND 4.0 International license.
inferior frontal-occipital fasciculi and corticospinal tracts (Genc, Smith, et al. 2018; Genc et al. 2019).
However, our FD findings are less widespread than we hypothesized: we report no significant FD
increases in the genu of the corpus callosum, fornix, inferior longitudinal fasciculi, superior longitudinal
fasciculi, or uncinate fasciculi. Although we find less widespread FD changes, some are larger in
magnitude than that reported in older children (3.1-7.1% as compared to 2.5-3.5% reported by (Genc,
Smith, et al. 2018)). Together, these findings suggest that axonal density changes during early childhood
may be characterized by profound increases in select tracts (e.g. the splenium of the corpus callosum
and corticospinal tracts) and increases in frontal-temporal tracts (e.g. the uncinate fasciculi and genu of
the corpus callosum) may occur at a faster rate later in childhood. It is important to note however that
while FD and NDI are both believed to be sensitive to axonal packing/density, differences in our results
as compared to that of previous NDI studies (Chang et al. 2015; Genc, Malpas, et al. 2017; Mah et al.
2017; Genc, Smith, et al. 2018) may be in part due to differences in the underlying models used to
derive these metrics. Further studies will therefore be necessary to validate our and these findings in
relation to one another.
In addition to microstructural changes, a large number of structural (T1-weighted MRI) studies
have shown developmental increases in white matter volumes from birth to adulthood (Lebel et al.
2008, 2012; Groeschel et al. 2010; Lebel and Beaulieu 2011; Taki et al. 2013). Volumes of individual
major white matter tracts have also been shown to increase with age, with each tract following a unique
developmental trajectory (Lebel and Beaulieu 2011; Lebel et al. 2012). Tract volume (Brouwer et al.
2012; Taki et al. 2013) and fiber cross-section (Genc, Smith, et al. 2018; Genc et al. 2019) have been
shown to increase during childhood in most major white matter tracts, with slower maturation in the
genu of the corpus callosum and uncinate fasciculi (Taki et al. 2013; Genc, Smith, et al. 2018); findings
that are consistent with our FC results. Our group has also previously shown, in an independent dataset,
directional selectivity in age-associations of white matter volumes: a superior-inferior oriented whitebioRxiv preprint first posted online May. 8, 2019; doi: http://dx.doi.org/10.1101/624171. The copyright holder for this preprint (which
was not peer-reviewed) is the author/funder, who has granted bioRxiv a license to display the preprint in perpetuity.
It is made available under a CC-BY-NC-ND 4.0 International license.
mater region encompassing the corticospinal tracts showed the largest age-slope in early childhood
(Bray et al. 2015). This is consistent with the rapid FC changes in the CST reported here. Overall, our FC
results suggest that early childhood is a particularly important period for development of the inferior
longitudinal fasciculi and corticospinal tracts; while slower maturation in the uncinate fasciculi and
superior longitudinal fasciculi, and no significant FC changes in the genu of the corpus callosum, may
suggest later maturation of these tracts. It is also worth noting that FC changes were both more
widespread, and showed larger percentage increases, than changes in FD. This suggests that while
concurrent increases in axonal packing and fiber cross-section are prominent during early childhood (as
evident from the large percentage changes observed in FDC), increases in fiber bundle size may be the
primary driving factor of white matter maturation during this period.
DTI Metrics
To compare our FBA results to that of commonly utilized DTI metrics, we additionally assessed
longitudinal changes in FA and MD as part of this study. Unsurprisingly, we observed developmental
increases in FA and decreases in MD in all major white matter tracts; findings that are consistent with a
large body of literature (see (Lebel and Deoni 2018) for review). Across the lifespan, tract maturation in
terms of FA and MD has been shown to occur earliest for commissural and projection fibers, followed by
association fibers, and then frontal-temporal projections (Westlye et al. 2010; Lebel and Beaulieu 2011;
Lebel et al. 2012). This is broadly consistent with our results: for FA we find that changes are more rapid
in projection fibers (i.e. the corticospinal tract) and slower in frontal-temporal fibers (e.g. the uncinate
fasciculi); for MD we find that commissural projections change slightly more rapidly (e.g. the splenium of
the corpus callosum) and that association fibers change at a rate comparable to the rest of the white
matter.bioRxiv preprint first posted online May. 8, 2019; doi: http://dx.doi.org/10.1101/624171. The copyright holder for this preprint (which
was not peer-reviewed) is the author/funder, who has granted bioRxiv a license to display the preprint in perpetuity.
It is made available under a CC-BY-NC-ND 4.0 International license.
Our results are also broadly consistent with studies that have investigated DTI metric changes
from early childhood to early adulthood (Taki et al. 2013; Reynolds et al. 2019), though here we note
some differences. A large DTI study in children aged 2-8 years similarly found rapid FA changes in the
inferior frontal-occipital fasciculi with slower maturation in the uncinate fasciculi and genu of the corpus
callosum (Reynolds et al. 2019). However, in contrast to our findings, they found that maturation of the
corticospinal tract and splenium of the corpus callosum was slower than most other tracts. This may be
attributed to the wider age range of participants in their study, or sex differences in white matter
development (as our study included females only). Rapid changes in DTI metrics in the corticospinal
tracts (Taki et al. 2013) and splenium (Brouwer et al. 2012) have been shown in early childhood to early
adulthood, which might suggest that maturation in these tracts is more rapid in mid-late childhood than
in very early childhood.
Fixel-based vs DTI Metrics
Unsurprisingly, we observed overlapping developmental changes in FBA and DTI metrics,
suggesting that the underlying white matter maturation leads to observation of similar spatial patterns
whether inferred from fixel-based quantitative measures or diffusion tensor-derived parameters. Across
metrics, maturation followed a posterior-to-anterior spatial trend, with rapid maturation in the
corticospinal tracts and splenium, and slower maturation in the genu of the corpus callosum and
uncinate fasciculi. These findings are consistent with our hypothesis regarding spatial trends in tract-
wise maturation, and are consistent with trends reported in the literature (Lebel et al. 2008, 2012; Lebel
and Beaulieu 2011; Reynolds et al. 2019). Despite similarities, however, we did observe important
distinctions in FBA and DTI metric developmental trends: percentage changes in tensor metrics were
both less variable between tracts, and smaller in magnitude, than those observed in fixel-based metrics.
These findings suggest that changes in non-specific, voxel-aggregate metrics inferred from the tensor
model that are influenced by many factors are smaller in magnitude and more homogenous acrossbioRxiv preprint first posted online May. 8, 2019; doi: http://dx.doi.org/10.1101/624171. The copyright holder for this preprint (which
was not peer-reviewed) is the author/funder, who has granted bioRxiv a license to display the preprint in perpetuity.
It is made available under a CC-BY-NC-ND 4.0 International license.
tracts during early childhood than changes in fixel-specific metrics that are sensitized to more specific
biological properties. This suggests that FBA is better suited to tracking longitudinal changes in white
matter maturation during early childhood, and may in turn be better able to identify white matter
abnormalities in individuals with neurodevelopmental disorders (Dimond et al. 2019).
Interestingly, tracts displayed varying degrees of uniformity in maturational rates across all
metrics: the inferior longitudinal fasciculi and superior longitudinal fasciculi had large degrees of
variability, while the body of the corpus callosum, arcuate fasciculi, right inferior frontal-occipital
fasciculus and corticospinal tracts matured at a relatively consistent rate across metrics. This might
suggest multifaceted structural maturation is more coupled in some tracts than others, though this has
yet to be explicitly tested and the implications of this remain unclear. While DTI metrics have been
linked to histological white matter properties (Seehaus et al. 2015), the direct link between FBA metrics
and cellular properties has not been robustly validated. Future studies should examine the underlying
biological properties measured by fixel-based metrics, as well as potential mechanisms for coupling of
white matter structural maturation and how concurrent and non-concurrent growth influences
structural connectivity and brain function.
Cognitive-Behavioral and Functional Relevance
Early childhood is a period of profound maturation of cognitive and behavioral skills, including
attention (Breckenridge et al. 2013; Mullane et al. 2016), working memory (Burnett Heyes et al. 2012),
reading (Ferretti et al. 2008), math (Garon-Carrier et al. 2018), and self-regulation (Montroy et al. 2016).
These skills have been linked to white matter properties during childhood (Qiu et al. 2008; Van Eimeren
et al. 2008; Klarborg et al. 2013; Jolles et al. 2016; Bathelt et al. 2018), though the relationship between
cognitive-behavioral skills and axonal density and fiber bundle size remains largely unexplored. One
study has shown an association between FD and inattentive/internalizing behavior in typicallybioRxiv preprint first posted online May. 8, 2019; doi: http://dx.doi.org/10.1101/624171. The copyright holder for this preprint (which
was not peer-reviewed) is the author/funder, who has granted bioRxiv a license to display the preprint in perpetuity.
It is made available under a CC-BY-NC-ND 4.0 International license.
developing children (Genc et al. 2019), while we have previously reported an association between FD
and social skills in adolescents and young adults with Autism Spectrum Disorder (Dimond et al. 2019).
These findings open the possibility that fixel-metrics might explain cognitive capabilities in healthy
individuals as well as relative deficits in individuals with neurodevelopmental disorders. Here we found
that FD, FC, and FDC maturation was rapid in projection and commissural fibers (the corticospinal tracts
and splenium), moderate in limbic tracts (the fornix and cingulum bundles), and slow or insignificant in
frontal tracts (the genu, superior longitudinal fasciculi and uncinate fasciculi). These maturational trends
may be related to rapid development of sensorimotor processes (Aboitiz and Montiel 2003; Welniarz et
al. 2017), ongoing development of emotional regulation (Ahmed et al. 2015), and protracted
development of executive functions (De Luca and Leventer 2011), respectively. We also observed rapid
increases in FC of the inferior longitudinal fasciculi, which may be related to higher-order visual,
emotional and reading capabilities (Herbet et al. 2018).
The mechanism by which individual differences in FD and FC might relate to cognitive-behavioral
differences is unclear, though this is possibly mediated through influence on network connectivity in the
brain. Increased axonal packing and fiber bundle size likely contribute to increases in structural
connectivity over the course of neurodevelopment (Hagmann et al. 2010; Dennis et al. 2013), which may
be related to developmental increases in functional network connectivity (Hagmann et al. 2010; Bennett
and Rypma 2013), though the relationship between these metrics likely varies across the brain
(Vazquez-Rodriguez et al. 2019). Work from our research group has demonstrated that functional
network connectivity is strongly associated with age during early childhood (Rohr et al. 2017, 2018; Long
et al. 2017). We have also previously shown that such functional connectivity is associated with
cognitive skills such as attention in the same sample of participants as used in the current study (Rohr et
al. 2017, 2018, 2019). Together, this research provides a potential theoretical framework to explain the
interplay between structural, functional and cognitive development. Future longitudinal studies willbioRxiv preprint first posted online May. 8, 2019; doi: http://dx.doi.org/10.1101/624171. The copyright holder for this preprint (which
was not peer-reviewed) is the author/funder, who has granted bioRxiv a license to display the preprint in perpetuity.
It is made available under a CC-BY-NC-ND 4.0 International license.
hopefully provide insight into the relationship between fiber density and fiber cross-section changes
during early childhood, developmental increases in structural and functional brain connectivity, and
cognition-behavioral maturation in typical and atypical neurodevelopment.
Strengths and Limitations
Strengths of the current study include a relatively large sample size, and mitigation of potential
confounding effects of motion through careful data screening, correction during preprocessing, and
regression of motion in statistical analyses. Though we utilized a slightly lower b-value than is generally
recommended for CSD (Tournier et al. 2013) and quantification of fiber density (Raffelt, Tournier, Rose,
et al. 2012), our study made use of state-of-the-art “single-shell 3-tissue CSD” (SS3T-CSD; (Dhollander
and Connelly 2016)), which is capable of isolating the diffusion signal attributable to white matter by
modelling and removing the contribution from grey matter and CSF (Dhollander et al. 2017).
One limitation of the current study is our exclusive use of female participants, which blinds us to
any potential sex differences in white matter development. The data utilized here are part of an ongoing
study investigating brain abnormalities in Turner syndrome, a disorder that only affects females; hence
typically-developing control participants recruited for this study were correspondingly exclusively girls.
While evidence for sex differences in white matter maturation is mixed (see (Lebel and Deoni 2018) for
recent review), some studies point towards small but significant sex difference in DTI (Reynolds et al.
2019) and FBA metrics (Genc, Seal, et al. 2017). Additionally, while we tested exclusively for linear
trends in white matter maturation, a recent DTI study has shown that FA and MD of select tracts follow
quadratic trajectories over early childhood (Reynolds et al. 2019). Given the narrow age and limited
number of scans (1-3) for each participant in our study, our sensitivity to non-linear trends would have
been limited.
ConclusionYou can also read