Divergent Connectivity Changes in Gray Matter Structural Covariance Networks in Subjective Cognitive Decline, Amnestic Mild Cognitive Impairment ...
←
→
Page content transcription
If your browser does not render page correctly, please read the page content below
ORIGINAL RESEARCH
                                                                                                                                                 published: 16 August 2021
                                                                                                                                           doi: 10.3389/fnagi.2021.686598

                                            Divergent Connectivity Changes in
                                            Gray Matter Structural Covariance
                                            Networks in Subjective Cognitive
                                            Decline, Amnestic Mild Cognitive
                                            Impairment, and Alzheimer’s Disease
                                            Zhenrong Fu 1 , Mingyan Zhao 2,3 , Yirong He 1 , Xuetong Wang 1 , Jiadong Lu 1 , Shaoxian Li 1 ,
                                            Xin Li 4,5 , Guixia Kang 6 , Ying Han 3,7,8,9* and Shuyu Li 1*
                                            1
                                             School of Biological Science and Medical Engineering, Beijing Advanced Innovation Center for Biomedical Engineering,
                                            Beihang University, Beijing, China, 2 Department of Neurology, Tangshan Gongren Hospital, Tangshan, China, 3 Department
                                            of Neurology, Xuanwu Hospital of Capital Medical University, Beijing, China, 4 School of Electrical Engineering, Yanshan
                                            University, Qinhuangdao, China, 5 Measurement Technology and Instrumentation Key Laboratory of Hebei Province,
                                            Qinhuangdao, China, 6 School of Information and Communication Engineering, Beijing University of Posts
                                            and Telecommunications, Beijing, China, 7 Biomedical Engineering Institute, Hainan University, Haikou, China, 8 Center
                                            of Alzheimer’s Disease, Beijing Institute for Brain Disorders, Beijing, China, 9 National Clinical Research Center for Geriatric
                                            Disorders, Beijing, China

                                            Alzheimer’s disease (AD) has a long preclinical stage that can last for decades prior
                                            to progressing toward amnestic mild cognitive impairment (aMCI) and/or dementia.
                                            Subjective cognitive decline (SCD) is characterized by self-experienced memory decline
                                            without any evidence of objective cognitive decline and is regarded as the later stage of
                         Edited by:
                                            preclinical AD. It has been reported that the changes in structural covariance patterns
                 Dennis Qing Wang,
   Southern Medical University, China       are affected by AD pathology in the patients with AD and aMCI within the specific
                      Reviewed by:          large-scale brain networks. However, the changes in structural covariance patterns
                        Tracy Fischer,      including normal control (NC), SCD, aMCI, and AD are still poorly understood. In this
     Tulane University, United States
                            Bin Deng,
                                            study, we recruited 42 NCs, 35 individuals with SCD, 43 patients with aMCI, and 41
   Southern Medical University, China       patients with AD. Gray matter (GM) volumes were extracted from 10 readily identifiable
                 *Correspondence:           regions of interest involved in high-order cognitive function and AD-related dysfunctional
                           Ying Han
                                            structures. The volume values were used to predict the regional densities in the whole
          hanying@xwh.ccmu.edu.cn
                           Shuyu Li         brain by using voxel-based statistical and multiple linear regression models. Decreased
                shuyuli@buaa.edu.cn         structural covariance and weakened connectivity strength were observed in individuals
                                            with SCD compared with NCs. Structural covariance networks (SCNs) seeding from
          Received: 27 March 2021
           Accepted: 19 July 2021           the default mode network (DMN), salience network, subfields of the hippocampus, and
         Published: 16 August 2021          cholinergic basal forebrain showed increased structural covariance at the early stage
                              Citation:     of AD (referring to aMCI) and decreased structural covariance at the dementia stage
         Fu Z, Zhao M, He Y, Wang X,
   Lu J, Li S, Li X, Kang G, Han Y and
                                            (referring to AD). Moreover, the SCN seeding from the executive control network (ECN)
    Li S (2021) Divergent Connectivity      showed a linearly increased extent of the structural covariance during the early and
    Changes in Gray Matter Structural
                                            dementia stages. The results suggest that changes in structural covariance patterns as
   Covariance Networks in Subjective
     Cognitive Decline, Amnestic Mild       the order of NC-SCD-aMCI-AD are divergent and dynamic, and support the structural
                  Cognitive Impairment,     disconnection hypothesis in individuals with SCD.
              and Alzheimer’s Disease.
   Front. Aging Neurosci. 13:686598.        Keywords: structural covariance network, subjective cognitive decline, structural MRI, default mode network,
     doi: 10.3389/fnagi.2021.686598         amnestic mild cognitive impairment, Alzheimer’s disease

Frontiers in Aging Neuroscience | www.frontiersin.org                                1                                            August 2021 | Volume 13 | Article 686598
Fu et al.                                                                                                                 Changes of SCNs in SCD

INTRODUCTION                                                               (Liu et al., 2011; Tosun et al., 2011), and individuals with SCD
                                                                           (Hafkemeijer et al., 2013) has been found in multiple studies.
Alzheimer’s disease (AD), beginning with cognitive impairment,             It is worth noting that pathologic tau and Aβ accumulation in
is the most common type of dementia, characterized by                      the cholinergic nucleus basalis emerged early in AD (Arendt
progressive and irreversible pathology with a long preclinical             et al., 1988; Mesulam et al., 2004), and volume reductions
phase (Masters et al., 2015). Mild cognitive impairment (MCI)              in the basal forebrain were observed in patients with AD
is the early symptomatic stage of AD, characterized by objective           (Kilimann et al., 2014) and individuals with SCD (Scheef et al.,
cognitive impairment, but largely preserves the daily functioning          2019). Collectively, the pathology of Aβ/tau/neurodegeneration
of individuals compared with dementia (Albert et al., 2011;                in regions of the DMN, hippocampus, and basal forebrain
Jack et al., 2018). Subjective cognitive decline (SCD) refers              has been investigated but much remains to be learned about
to the self-perceived worsening of cognitive ability, which is             the variations in coordination with other regions in normal
defined at the preclinical stage of AD and is independent of               controls (NCs) and those in SCD, amnestic mild cognitive
the neuropsychological tests (Jessen et al., 2014, 2020). The              impairment (aMCI), and AD.
majority of individuals with SCD will not show sustained                       Mapping whole-brain GM correlations with seed regions to
cognitive decline or progress to AD (Jessen et al., 2020) because          construct a GM structural covariance network (SCN) based
the associations between self-perceived cognitive decline and              on structural magnetic resonance imaging (sMRI) has been
objective cognitive impairment are complex. However, most of               proposed to investigate the covariance in GM density (Mechelli
the studies have shown that symptoms of SCD may represent                  et al., 2005; Alexander-Bloch et al., 2013; Evans, 2013). Although
the earliest alert of AD, and individuals with SCD are at                  the biological basis of the SCN is not very clear, there
higher risk for developing AD or MCI (Rabin et al., 2017;                  are many hypotheses, such as a result of mutually trophic
Jessen et al., 2020; Wang et al., 2020b). Early diagnosis and              influences (Mechelli et al., 2005), common experience-related
intervention to preserve cognitive function is an important way            plasticity (Mechelli et al., 2005), common neurodevelopmental
to combat AD (Livingston et al., 2017); thus, it is critical to            blueprints for axonal guidance and neuronal migration (Zielinski
investigate the associations among biomarkers of SCD, MCI,                 et al., 2010), or a combination of these factors (Seeley et al.,
and AD to provide a better opportunity for an early therapy                2009). However, the SCN technique has been used in many
(Jessen et al., 2020).                                                     studies, such as those examining development (Zielinski et al.,
    Reliable markers are crucial for diagnosis, intervention, and          2010), sex differences in healthy adults (Mechelli et al., 2005),
therapy in neurodegenerative diseases (Gao et al., 2020; Yang              brain plasticity in adults (Guo et al., 2020), and connectivity
et al., 2020). For instance, the Aβ/Tau/neurodegeneration in               alterations in patients with MCI (Wang et al., 2018) and
AD-related disease (Jack et al., 2016), the “Hot cross bun” in             patients with AD (Seeley et al., 2009; Montembeault et al.,
multiple system atrophy with cerebellar ataxia (Zhu et al., 2021),         2016; Li et al., 2019a). In studies of AD, decreased structural
and the motor abnormalities and α-synuclein in Parkinson’s                 associations were observed within the DMN, and increased
disease (PD) (Xie et al., 2019) have been proven to be potential           structural associations were shown within the salience network
biomarkers for an early detection of these diseases. Focusing              (SN) and executive control network (ECN) (Montembeault
on AD pathology, both the accumulation of amyloid-β (Aβ) in                et al., 2016; Li et al., 2019a), which is partially in line
plaques and aggregation of the protein tau in neurofibrillary              with functional network studies (Seeley et al., 2009; Zhou
tangles are biomarkers that can be used to monitor the                     et al., 2010). Moreover, SCNs seeded from subfields of the
progression of AD (Jack et al., 2016). Moreover, the initial               hippocampus in patients with MCI showed an increased
locations of Aβ deposition are in the frontal lobes, temporal lobes,       extent of structural association compared with NCs (Wang
hippocampus, and limbic system; and pathologic tau originates              et al., 2018). It is worth noting that increased functional
in the medial temporal lobes and hippocampus (Braak et al.,                connectivity in the DMN was observed in individuals with
2011; Braak and Del Tredici, 2015; Masters et al., 2015). Studies          SCD (Hafkemeijer et al., 2013). However, the pattern changes
based on neuroimaging have described hippocampal atrophy                   in SCNs as the order of NC-SCD-aMCI-AD are still poorly
as an effective biomarker in patients with AD (Zhao et al.,                known. This information may provide a better understanding
2019; Wang et al., 2020b) and patients with MCI (Jack et al.,              of the underlying neuropathological mechanisms of SCD and
2010), and individuals with SCD (Cantero et al., 2016; Zhao                the association between SCD- and AD-related diseases at
et al., 2019). In addition, studies based on the resting-state             the network level.
functional magnetic resonance imaging (rs-fMRI) techniques                     In the present study, we employed the SCN to explore
have revealed that a specific set of brain regions (including              changes in structural connectivity in specific large-scale
the posterior cingulate cortex, anterior medial prefrontal cortex,         networks as the order of NC-SCD-aMCI-AD. We defined
medial temporal lobe, lateral temporal cortex, and inferior                10 seed regions at three levels: (1) spheres anchored in
parietal lobule) forms a functional network associated with                the DMN, SN, and ECN; (2) anatomical regions of the
the resting states (Buckner et al., 2008; Yeo et al., 2011;                bilateral anterior and posterior hippocampus; and (3)
Montembeault et al., 2016), named as the default mode network              two anatomical subregions of the basal forebrain. Our
(DMN). With regard to the neurodegeneration within the                     results indicated that the trajectory of change patterns
DMN, reduced gray matter (GM) volume in DMN regions                        in SCNs along NC-SCD-aMCI-AD potentially provides
in patients with AD (Liu et al., 2011) and patients with MCI               structural covariance insight into better understanding

Frontiers in Aging Neuroscience | www.frontiersin.org                  2                                   August 2021 | Volume 13 | Article 686598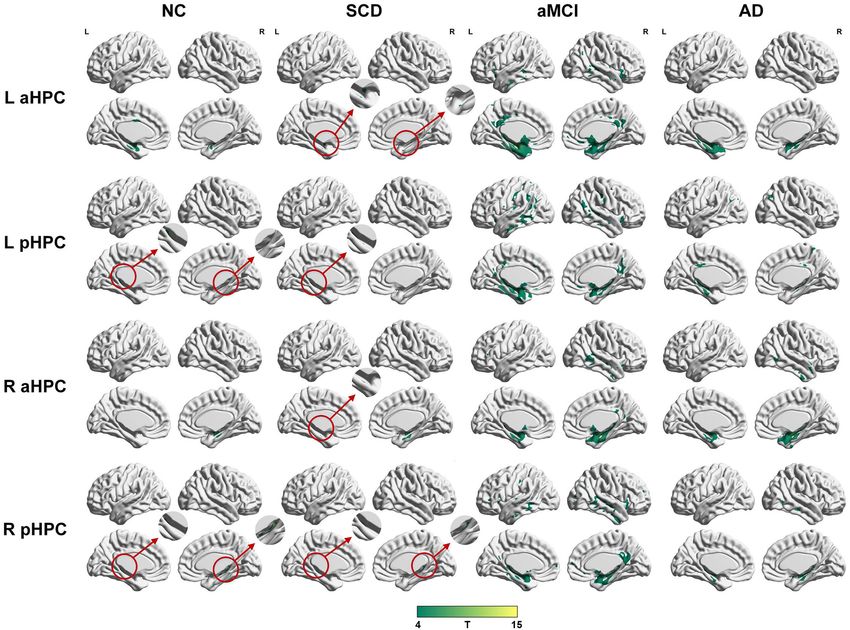
Fu et al.                                                                                                                           Changes of SCNs in SCD

of the progressive mechanism of cognitive decline due to                    the following: (1) symptoms consistent with the diagnostic
AD-related pathology.                                                       criteria for dementia; (2) brain atrophy in the hippocampus based
                                                                            on sMRI; (3) gradual onset lasting more than 6 months rather
                                                                            than a sudden attack; and (4) CDR scores equal to 1 or higher.
MATERIALS AND METHODS                                                          The exclusion criteria for all subjects in the present study
                                                                            were as follows: (1) HAMD scores higher than 24 and a score
Participants                                                                on the Center for Epidemiologic Studies Depression Scale higher
In the present study, 35 individuals with SCD, 43 patients                  than 21; (2) the Hachinski Ischemic Scale in the abnormal range
with aMCI, and 41 patients with AD were recruited from                      (higher than 4); (3) left-handedness; (4) impaired executive,
the memory clinic of the Neurology Department of XuanWu                     visual, or auditory functions; (5) cognitive function decline
Hospital, Capital Medical University, China. Then, 42 NC                    due to non-AD neurological diseases (e.g., brain tumor, brain
individuals were enrolled from local communities in Beijing,                injury, PD, encephalitis, and normal pressure hydrocephalus); (6)
China. This study was performed in accordance with the rule                 history of stroke; (7) history of alcohol or drug abuse/addiction
of ethics of the Medical Research Ethics Committee in Xuanwu                within 2 years; (8) large-vessel disease; (9) any other systemic
Hospital, and every subject gave their written informed consent             diseases or uncertainty preventing the completion of the project;
to participate. The sample size was calculated by the analysis of           and (10) frequent head motion that may influence the quality of
covariance (ANCOVA) model in G∗ Power 3.1.9.7 (Faul et al.,                 MRI data. The main demographic and clinical characteristics of
2007). The power (1-β) was 80%, α was 0.05, the effect size                 the subjects are summarized in Table 1.
was 0.35, and the number of groups and covariates was 4. This
calculation rendered a total sample size of 142, and 161 is larger          Image Acquisition
than 142. The standard clinical assessments mainly included                 All T1-weighted images were acquired with a 3.0 T Siemens
medical history investigations, neurological examinations, and              system (Magnetom Trio Tim; Erlangen, Germany) by a 3D
neuropsychological tests. Cognitive tests included the Montreal             sagittal magnetization-prepared rapid gradient echo (MPRAGE)
Cognitive Assessment (MoCA, Beijing version) (Lu et al., 2011),             sequence at the Department of Radiology, Xuanwu Hospital,
auditory verbal learning test (AVLT) (namely, three memory                  Capital Medical University, Beijing, China. The parameters were
tests: the AVLT immediate recall, the AVLT-delayed recall, and              as follows: TR = 1,900 ms; TE = 2.2 ms; TI = 900 ms; flip
the AVLT recognition), the clinical dementia rating (CDR)                   angle = 9◦ ; FOV = 22.4 cm × 25.6 cm; matrix size = 448 × 512;
(Morris, 1993), the Hamilton Depression Rating Scale (HAMD),                number of slices = 176; and slice thickness = 1 mm (Zhao et al.,
the Activities of Daily Living (ADL) Scale, the Hachinski Ischemic          2019; Fu et al., 2021).
Scale, and the Center for Epidemiologic Studies Depression
Scale (Dozeman et al., 2011). In addition, the volunteers received          Image Preprocessing
a neuropsychological evaluation from two neurologists, each with            The non-uniformity intensity (N3) correction was first
more than 2 years of clinical experience in neurology.                      performed on anatomical T1 images by using FreeSurfer
   The diagnostic criteria for individuals with SCD were based              (version 6.0) (Fischl, 2012). After N3 correction, the images
on the conceptual framework within the context of AD research               were analyzed with the CAT12 toolbox1 . The pipeline in CAT12
proposed by the Subjective Cognitive Decline Initiative (Jessen             includes removing noise with a spatial-adaptive non-local means
et al., 2014), were described in our previous study (Fu et al.,             denoizing filter (Manjón et al., 2010), segmenting the brain
2021), and included the following: (1) self-perceived memory                tissues into GM, white matter, and cerebrospinal fluid by local
decline without changes in other cognitive domains (last within             adaptive segmentation, partial volume estimation, and adaptive
5 years); (2) feeling of worse performance than others of the same          maximum a posteriori techniques, normalizing the images to
age group; (3) MoCA scores in the normal range (threshold was               a standard Montreal Neurological Institute (MNI) space by
determined based on the different levels of education: primary              diffeomorphic anatomic registration through exponentiated Lie
school or below >19, secondary schooling >22, and university                algorithm (Ashburner, 2007). Moreover, the GM images were
>24); (4) only one of the two memory tests (AVLT-delayed                    modulated by Jacobian determinants to preserve the regional
recall and AVLT recognition) was abnormal (one SD below NC                  volume information. Finally, the GM images were smoothed in
performance); and (5) CDR score was 0. The patients with aMCI               SPM122 with a 6-mm (subregions of hippocampus and basal
were identified with the Petersen criteria (Petersen, 2004), which          forebrain) and 12-mm (DMN, SN, and ECN) full-width at
included the following: (1) memory decline confirmed by an                  half-maximum Gaussian kernel.
informant; (2) objective memory impairment measured by the
MoCA and AVLT adjusted for education years (1.5 SD below                    Definition of Seed Regions
NC performance); (3) CDR score of 0.5; (4) exclusion of subjects            Anatomical differentiation and functional segregation have
with other types of MCI, such as subcortical vascular MCI; and              been shown along the long axis of the hippocampus, and
(5) exclusion of subjects with memory impairment of sufficient              specializations arise out of differences between the anterior
severity to affect the activities of daily living of the subject. The       hippocampus and posterior hippocampus in large-scale network
patients with AD were diagnosed based on the criteria of the
National Institute of Aging-Alzheimer’s Association (NIA-AA)                1
                                                                                http://dbm.neuro.uni-jena.de/cat/
(Sperling et al., 2011) for clinically probable AD, which included          2
                                                                                https://www.fil.ion.ucl.ac.uk/spm/

Frontiers in Aging Neuroscience | www.frontiersin.org                   3                                            August 2021 | Volume 13 | Article 686598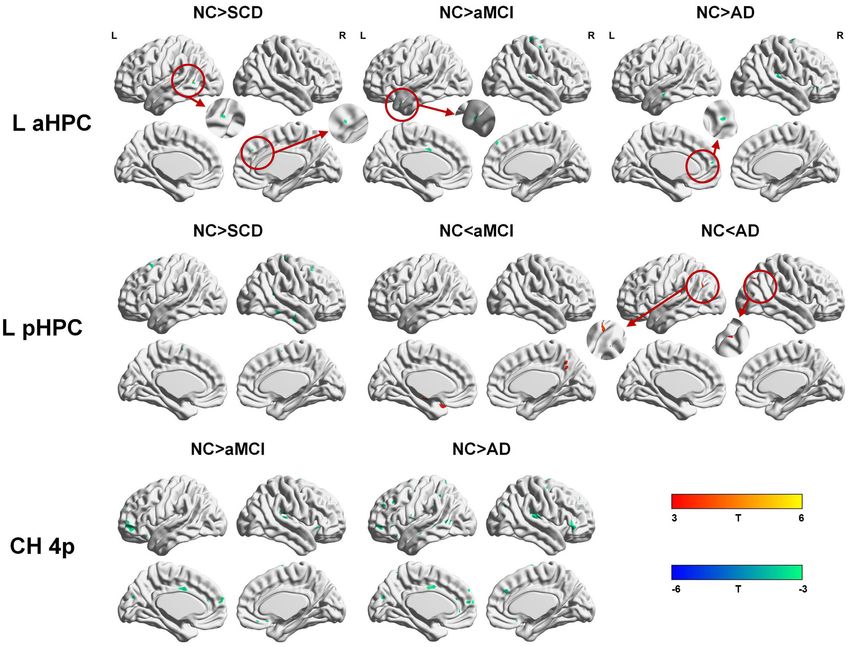
Fu et al.                                                                                                                                   Changes of SCNs in SCD

TABLE 1 | Demographic characteristics and neuropsychological data.

                                       NC Group (42)                    SCD Group (35)                     aMCI Group (43)                         AD Group (41)

Age (y)                                  64.24 ± 6.16                     64.54 ± 7.29                       67.47 ± 10.03                          68.88 ± 7.86
Sex (men/women)                             15/27                             15/20                              21/22                                  17/24
Education (y)                            11.17 ± 5.61                     11.83 ± 3.67                        10.44 ± 4.96                           9.68 ± 4.71
eTIV (* 106 mm3 )                        1.40 ± 0.12                      1.44 ± 0.14                         1.47 ± 0.16                            1.40 ± 0.13
MoCA                                     26.02 ± 2.95                     25.26 ± 2.27                     19.67 ± 4.28aaabbb                   13.10 ± 5.46aaabbbccc
AVLT immediate recall                    9.32 ± 1.94                      8.54 ± 1.82                      5.84 ± 1.34aaabbb                    3.53 ± 1.58aaabbbccc
AVLT delayed recall                      10.43 ± 2.31                     8.86 ± 2.78a                     3.19 ± 2.81aaabbb                    0.98 ± 1.60aaabbbccc
AVLT recognition                         12.07 ± 2.13                     11.37 ± 2.20                     6.58 ± 4.28aaabbb                    3.51 ± 3.08aaabbbccc

NC, normal control; aMCI, amnestic mild cognitive impairment; SCD, subjective cognitive decline; AD, Alzheimer’s disease; MoCA, Montreal Cognitive Assessment (Beijing
version); AVLT, auditory verbal learning test; eTIV, estimated total intracranial volume.
The values represent the mean ± standard deviation.
a Denotes a significant difference between the NC group and other groups (a p < 0.05, aa p < 0.01, and aaa p < 0.001).
b Indicates a significant difference between the SCD group and the other groups (b p < 0.05, bb p < 0.01, and bbb p < 0.001).
c Represents a significant difference between the aMCI and other groups (c p < 0.05, cc p < 0.01, and ccc p < 0.001).

connectivity (Poppenk et al., 2013). In this study, the anterior                      images to investigate the structural covariance between
hippocampus and posterior hippocampus were defined based                              seed regions and whole brain voxels in each group. The
on the previous studies (Poppenk et al., 2013; Li et al., 2018;                       mean values extracted from the seed regions, age, sex,
Nordin et al., 2018), and we adopted the automated anatomical                         education years, and estimated total intracranial volume
labeling (AAL) (Tzourio-Mazoyer et al., 2002) atlas for the                           (eTIV) were used as covariates. We performed specific T
segmentation of the hippocampus. In MNI coordinates, the                              contrasts to identify voxels expressing a positive correlation
anterior hippocampus masks from Y: −2 to −18 mm and                                   within each group (NC, SCD, aMCI, and AD). The resulting
the posterior hippocampus masks from Y: −24 to −42 mm.                                maps for each group were thresholded at p < 0.05, and
The seed regions representing functional large-scale networks                         the false discovery rate (FDR) was employed for multiple
were selected within the right entorhinal cortex (R EC) (MNI                          comparison correction. Cluster sizes larger than 100 voxels
coordinates: 25, −9, and −28), left posterior cingulate cortex (L                     (337.5 mm3 ) were reported.
PCC) (MNI coordinates: −2, −36, and 35), right frontoinsular                              Furthermore, the between-group differences in structural
cortex (R FIC) (MNI coordinates: 38, 26, and −10), and right                          covariance compared with the NC group were assessed by
dorsolateral prefrontal cortex (R DLPFC) (MNI coordinates: 44,                        differences in slopes. We used a linear interaction model
36, and 20). These regions anchor the DMN (medial temporal                            combined with dummy coding, and the mean values extracted
lobe subsystem and midline core subsystem), SN, and ECN                               from the seed regions, group, interaction term (group × mean
(Montembeault et al., 2016; Li et al., 2019a). Then, analyses of                      values of seed regions), age, sex, education years, and eTIV were
the contralateral regions of the R EC, L PCC, R FIC, and R                            used as covariates. Specific T contrasts were established to map
DLPFC were performed. Finally, the subregions of the basal                            the significantly different structural covariance voxels in slopes
forebrain were defined by a basal forebrain atlas in MNI space                        between two groups, including positive and negative correlations.
that has been widely used in the previous studies (Kilimann                           We set the threshold at p < 0.01 at the voxel level and p < 0.05
et al., 2014; Scheef et al., 2019; Chen et al., 2021). The Ch4p                       at the cluster level with two-tailed Gaussian random field (GRF)
(cholinergic system of the posterior nucleus basalis Meynert) and                     correction. Cluster sizes larger than 100 voxels (337.5 mm3 ) were
Ch1/2 (cholinergic system of combined clusters of the medial                          reported. The coordinates of the peak intensity of the cluster
septum and the vertical limb of the diagonal band) with observed                      within the scope of the AAL template were reported, except when
volume reductions in SCD (Scheef et al., 2019; Chen et al.,                           there was only one cluster.
2021) and AD (Kilimann et al., 2014) were selected as seed                                To investigate the correlation between the volume of
regions. The volume of the hippocampus and basal forebrain                            structural covariance peak regions and clinical tests, we
subregions were represented by mean values of the modulated                           performed two-tailed partial correlation analysis within each
GM voxels within the masks in MNI space. For the functional                           group, which showed a significant difference in the structural
large-scale network seed regions, 4-mm radius sphere masks were                       covariance (Li et al., 2019a), and the effects of age, sex, and
constructed by using the MarsBaR toolbox3 , and the mean GM                           education years were ruled out (p < 0.05). The GM volume of
intensity was calculated.                                                             the peak regions was extracted by spheres with a radius of 4 mm
                                                                                      around the peak intensity coordinates.
Structural Covariance Analysis                                                            Group differences in age, years of education, eTIV, and
Multiple regression models combined with voxel-based                                  neuropsychological test scores (MoCA and AVLT) were evaluated
statistical analysis were performed on the modulated GM                               by ANOVA (p < 0.05), and Bonferroni post hoc analysis was
                                                                                      performed. The chi-square test was used to investigate the
3
    http://marsbar.sourceforge.net/                                                   sex distribution.

Frontiers in Aging Neuroscience | www.frontiersin.org                             4                                          August 2021 | Volume 13 | Article 686598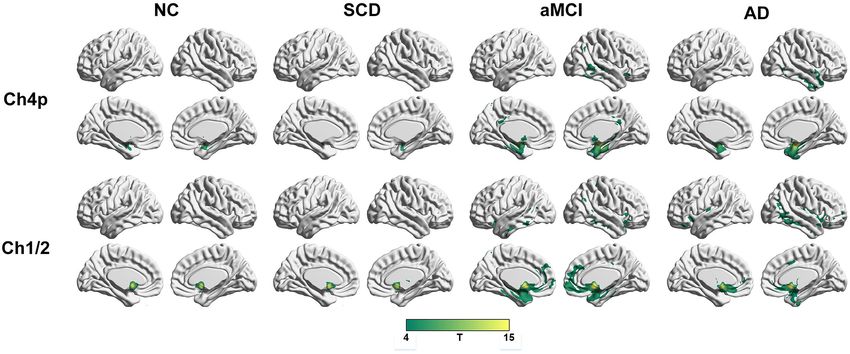
Fu et al.                                                                                                                                         Changes of SCNs in SCD

RESULTS                                                                                  DMN midline core subsystem and SN, the aMCI group showed
                                                                                         a greater extent of structural association than the other groups.
Demographics                                                                             In the ECN, the AD group exhibited an increased extent of
There were no significant differences in age, sex, education years,                      structural association compared with the SCD, aMCI, and NC
or eTIV for each pair of groups. The AVLT-delayed recall scores                          groups. The SCD group showed a decreased extent of structural
were significantly lower in the SCD group compared with the NC                           covariance in both DMN subsystems, SN and ECN. In the DMN
group (p < 0.05). Moreover, all the neuropsychological test scores                       medial temporal subsystem, DMN midline core subsystem and
(MoCA and AVLT) in the aMCI group were significantly lower                               SN, the number of clusters in the SCD group, aMCI and AD
than those in the NC and SCD groups (p < 0.001). In addition,                            groups were decreased compared with the NC group. Regarding
all the neuropsychological test scores (MoCA and AVLT) in the                            the bilateral anterior hippocampus and posterior hippocampus,
AD group were lower than those in the other groups (p < 0.001).                          the aMCI group showed a greater extent of structural covariance
The results are shown in Table 1 and Supplementary Figure 1.                             than the other groups. In all the subfields of the hippocampus,
                                                                                         the subjects in the SCD group presented a decreased extent
                                                                                         of structural covariance compared with the NC group. In the
Patterns of Structural Covariance Within                                                 SCNs, seeded from subregions of the basal forebrain, both Ch4p
Groups                                                                                   and Ch1/2 showed a greater extent of structural covariance
To qualitatively compare the patterns of positive correlations                           in the aMCI group than in the other groups. The results of
across subjects within all groups, statistical maps are displayed                        contralateral seeds for the DMN subsystems, SN, and ECN,
in Figures 1–3, and the details are shown in Supplementary                               obtained by changing the sign on the x coordinate of each
Tables 1–12. Regarding the DMN medial temporal subsystem,                                seed, are listed in Supplementary Tables 1–4. In addition, the

  FIGURE 1 | Structural covariance networks seeding from the default mode network, salience network, and executive control network within groups. T-statistic
  maps, p < 0.05, corrected by false discovery rate (FDR) with cluster size larger than 100 voxels. L, left; R, right; EC, entorhinal cortex; PCC, posterior cingulate
  cortex; DLPFC, dorsolateral prefrontal cortex; FIC, frontoinsular cortex; AD, Alzheimer’s disease; NC, normal control; aMCI, amnestic mild cognitive impairment;
  SCD, subjective cognitive decline.

Frontiers in Aging Neuroscience | www.frontiersin.org                                5                                            August 2021 | Volume 13 | Article 686598
Fu et al. Changes of SCNs in SCD
FIGURE 2 | Structural covariance networks seeding from the anterior and posterior hippocampus within groups. T-statistic maps, p < 0.05, corrected by false
discovery rate (FDR) with cluster size larger than 100 voxels. The small clusters are circled by the red circles, and they are enlarged. L, left; R, right; aHPC, anterior
hippocampus; pHPC, posterior hippocampus; AD, Alzheimer’s disease; NC, normal control; aMCI, amnestic mild cognitive impairment; SCD, subjective cognitive
decline.
results of other subregions of the basal forebrain are listed in parietal gyrus (2,289 voxels) and those in the aMCI group in
Supplementary Tables 9–12. the right precentral gyrus (1,541 voxels); the subjects in the
NC group showed decreased strength in structural covariance
in the right middle temporal gyrus compared with subjects in
Significant Between-Group Differences the aMCI group (3,646 voxels). Regarding the ECN, the subjects
in the Structural Covariance GM Network in the NC group showed significantly increased strength in
Regarding the DMN medial temporal subsystem, the subjects in structural covariance compared with those in the SCD group in
the NC group showed increased strength in structural covariance the right inferior temporal gyrus (865 voxels); the subjects in the
compared with those in the SCD group in the right supramarginal NC group showed decreased strength in structural covariance
gyrus (2,280 voxels) and in the left precentral gyrus compared compared with those in the aMCI group in the right median
with the aMCI (3,034 voxels) and AD (10,492 voxels) groups. cingulate (269 voxels) and those in the AD group in the right
Regarding the DMN midline core subsystem, the subjects in precuneus (934 voxels). The results are shown in Table 2 and
the NC group showed significantly increased strength in the Figure 4.
structural covariance compared with those in the SCD group Within the SCN seeding from the left anterior hippocampus,
in the right inferior temporal gyrus (5,277 voxels), those in decreased strength in structural covariance were observed in
the aMCI group in the left middle frontal gyrus (7,638 voxels), the SCD (left middle temporal gyrus; 313 voxels), aMCI (right
and those in the AD group in the left precentral gyrus (1,743 precentral gyrus; 2,119 voxels), and AD (right superior temporal
voxels). Regarding the SN, the subjects in the NC group gyrus; 2,665 voxels) groups compared with the NC group.
showed significantly increased strength in structural covariance Moreover, within the SCN seeding from the left posterior
compared with those in the SCD group in the left inferior hippocampus, decreased strength in structural covariance was
Frontiers in Aging Neuroscience | www.frontiersin.org 6 August 2021 | Volume 13 | Article 686598Fu et al. Changes of SCNs in SCD
TABLE 2 | Significant between-group (NC-SCD, NC-aMCI, and NC-AD) differences in structural covariance seeding from the DMN, SN, and ECN.
Seed Contrast Peak region MNI coordinates Extent Peak intensity
X Y Z
R entorhinal cortex NC > SCD SupraMarginal_R 63 −24 43.5 2280 −3.9511
NC > aMCI Precentral_L –7.5 −7.5 39 3034 −3.9178
NC > AD Precentral_L –3.5 −6 43.5 10492 −4.5574
NC < AD ParaHippocampal_R 18 −1.5 –2.5 273 3.267
L posterior cingulate cortex NC > SCD Temporal_Inf_R 49.5 −36 –6.5 5277 −4.2714
NC > aMCI Frontal_Mid_L –5.5 24 34.5 7638 −5.4367
NC > AD Precentral_L –6.5 –6.5 72 1743 −3.7043
NC < SCD Precuneus_R 3 −51 45 357 3.2657
NC < aMCI Temporal_Mid_R 51 –58.5 16.5 431 3.3112
NC < AD Temporal_Mid_R 42 –52.5 19.5 1034 4.0244
R frontoinsular cortex NC > SCD Parietal_Inf_L –34.5 −45 48 2289 −3.8531
NC > aMCI Precentral_R 15 −27 79.5 1541 −4.7806
NC > AD Precentral_R 15 −27 75 751 −3.8561
NC < aMCI Temporal_Mid_R 49.5 –46.5 6 3646 3.2717
NC < AD Supp_Motor_Area_R 12 −18 49.5 489 3.1579
R dorsolateral prefrontal cortex NC > SCD Temporal_Inf_R 54 −48 −27 865 −3.3482
NC > AD Calcarine_L −15 –49.5 10.5 106 −3.0684
NC < SCD Occipital_Mid_L −39 –67.5 1.5 313 3.4323
NC < aMCI Cingulum_Mid_R 7.5 −39 43.5 269 3.1672
NC < AD Precuneus_R 12 −57 40.5 934 3.602
L, left; R, right; AD, Alzheimer’s disease; NC, normal control; aMCI, amnestic mild cognitive impairment; SCD, subjective cognitive decline; MNI, Montreal
Neurological Institute.
FIGURE 3 | Structural covariance networks seeding from the Ch4p and Ch1/2 within groups. T-statistic maps, p < 0.05, corrected by false discovery rate (FDR) with
cluster size larger than voxels. L, left; R, right; AD, Alzheimer’s disease; NC, normal control; aMCI, amnestic mild cognitive impairment; SCD, subjective cognitive
decline.
shown in the SCD group (right middle temporal gyrus; 4,204 subjects in the NC group showed increased strength in structural
voxels) compared with the NC group; subjects in the NC covariance compared with those in the SCD (right supramarginal
group showed decreased structural covariance compared with gyrus; 1,307 voxels) and AD (left middle frontal gyrus; 1,900
those in the aMCI (right middle temporal gyrus; 1,656 voxels) voxels) groups. Within the SCN seeding from the right posterior
and AD (left angular gyrus; 603 voxels) groups. Then, within hippocampus, the subjects in the NC group showed increased
the SCN seeding from the right anterior hippocampus, the strength in structural covariance compared with those in the
Frontiers in Aging Neuroscience | www.frontiersin.org 7 August 2021 | Volume 13 | Article 686598Fu et al. Changes of SCNs in SCD
SCD (left superior frontal gyrus; 2,815 voxels) and AD (right each seed, are listed in Supplementary Tables 13–15, and the
parahippocampal gyrus; 3,511 voxels) groups. In addition, results of other subregions of the basal forebrain are listed in
within the SCN seeding from the Ch4p, the subjects in the Supplementary Tables 19–21.
NC group showed increased strength in structural covariance
compared with those in the aMCI (right superior temporal
gyrus; 5,533 voxels) and AD (right median cingulate gyrus;
Correlation Analysis Between Peak
10,790 voxels) groups. In addition, within the SCN seeding Cluster Volume and Cognitive Test
from the Ch1/2, the subjects in the NC group showed increased Scores
strength in structural covariance compared with those in the We then performed partial correlation analysis between the peak
SCD (left parahippocampal gyrus; 1,044 voxels) and AD (left cluster volumes with significant interaction effects and cognitive
superior frontal gyrus; 1,161 voxels) groups. The results are test scores within each group. The correlations were mainly
summarized in Tables 3, 4 and Figure 5. The results with located in the SCN seeding from DMN regions such as the
the contralateral seeds for the DMN subsystems, SN and hippocampus and posterior cingulate cortex. In the SCD group,
ECN, obtained by changing the sign on the x coordinate of the left anterior hippocampus-anchored (r = −0.351, p = 0.049)
TABLE 3 | Significant between-group (NC-SCD, NC-aMCI, and NC-AD) differences in structural covariance networks seeding from anterior and posterior hippocampi.
Seed Contrast Peak region MNI coordinates Extent Peak intensity
X Y Z
L anterior hippocampus NC > SCD Temporal_Mid_L –52.5 –49.5 0 313 −3.7864
NC > aMCI Precentral_R 43.5 −12 61.5 2119 −4.0192
NC > AD Temporal_Sup_R 40.5 −27 10.5 2665 −4.0872
NC < aMCI Hippocampus_L –25.5 –13.5 –13.5 239 5.0774
NC < AD Precuneus_R 3 −48 60 411 3.6251
L posterior hippocampus NC > SCD Temporal_Mid_R 49.5 −48 15 4204 −5.1987
NC > aMCI Precentral_R 16.5 −27 73.5 878 −4.3176
NC > AD Frontal_Sup_L −18 16.5 49.5 1193 −3.9886
NC < aMCI Temporal_Mid_R 48 –58.5 13.5 1656 4.5496
NC < AD Angular_L −52.5 −69 30 603 4.1876
R anterior hippocampus NC > SCD SupraMarginal_R 58.5 –28.5 42 1307 −4.3683
NC > aMCI Temporal_Sup_R 57 –31.5 15 206 −4.1619
NC > AD Frontal_Mid_L −28.5 28.5 36 1900 −4.4319
NC < SCD Occipital_Mid_L −42 –73.5 1.5 123 3.788
NC < AD Insula_R 43.5 13.5 −7.5 382 4.2362
R posterior hippocampus NC > SCD Frontal_Sup_L −16.5 22.5 63 2815 −4.5136
NC > aMCI Precentral_R 15 −27 75 571 −4.0688
NC > AD ParaHippocampal_R 33 −36 −4.5 3511 −4.4366
NC < aMCI Temporal_Mid_R 49.5 −60 13.5 570 3.9456
L, left; R, right; AD, Alzheimer’s disease; NC, normal control; aMCI, amnestic mild cognitive impairment; SCD, subjective cognitive decline; MNI, Montreal
Neurological Institute.
TABLE 4 | Significant between-group (NC-SCD, NC-aMCI, and NC-AD) differences in structural covariance networks seeding from the Ch4p and Ch1/2.
Seed Contrast Peak region MNI coordinates Extent Peak intensity
X Y Z
Ch4p NC > SCD Temporal_Mid_L –52.5 −51 1.5 133 −3.5685
NC > aMCI Temporal_Sup_R 55.5 −30 16.5 5533 −5.6571
NC > AD Cingulum_Mid_R 1.5 36 31.5 10790 −5.0984
NC < SCD Occipital_Mid_L –40.5 −72 3 126 3.5079
Ch1/2 NC > SCD ParaHippocampal_L −30 −18 –22.5 1044 −4.1796
NC > aMCI Temporal_Sup_R 57 −30 15 279 −4.4193
NC > AD Frontal_Sup_L −24 6 64.5 1161 −4.2794
NC < AD Temporal_Pole_Sup_R 55.5 16.5 –13.5 287 3.8021
Ch4p, cholinergic system of posterior nucleus basalis Meynert; Ch1/2, cholinergic system of combined clusters of the medial septum and the vertical limb of the diagonal
band; AD, Alzheimer’s disease; NC, normal control; aMCI, amnestic mild cognitive impairment; SCD, subjective cognitive decline; MNI, Montreal Neurological Institute.
Frontiers in Aging Neuroscience | www.frontiersin.org 8 August 2021 | Volume 13 | Article 686598Fu et al. Changes of SCNs in SCD FIGURE 4 | Between-group (NC-SCD; NC-aMCI; and NC-AD) differences in structural covariance networks seeding from the default mode network, salience network, and executive control network. T-statistic maps, p < 0.01 at the voxel level and p < 0.05 at the cluster level, two-tailed Gaussian random field (GRF) correction with cluster size larger than 100 voxels. The small clusters are circled by the red circles, and they are enlarged. L, left; R, right; EC, entorhinal cortex; PCC, posterior cingulate cortex; DLPFC, dorsolateral prefrontal cortex; FIC, frontoinsular cortex; AD, Alzheimer’s disease; NC, normal control; aMCI, amnestic mild cognitive impairment; SCD, subjective cognitive decline. and posterior hippocampus-anchored (r = 0.505, p = 0.003) scores; the peak volume in the middle temporal gyrus (left peak volumes (middle temporal gyrus) showed significant posterior hippocampus-anchored) significantly correlated with correlations with AVLT recognition scores. In the aMCI group, AVLT recognition scores (r = 0.420; p = 0.007); the peak volume the peak volume in the hippocampus (left anterior hippocampus- in the middle temporal gyrus (right posterior hippocampus- anchored) significantly correlated with AVLT-delayed recall anchored) significantly correlated with AVLT recognition scores (r = 0.351, p = 0.027) and AVLT recognition (r = 0.456, p = 0.003) (r = 0.463; p = 0.003); the peak volume in the middle temporal Frontiers in Aging Neuroscience | www.frontiersin.org 9 August 2021 | Volume 13 | Article 686598
Fu et al.                                                                                                                                      Changes of SCNs in SCD

  FIGURE 5 | Between-group (NC-SCD; NC-aMCI; and NC-AD) differences in structural covariance networks seeding from the left anterior and posterior
  hippocampus and Ch4p. T-statistic maps, p < 0.01 at the voxel level and p < 0.05 at the cluster level, two-tailed GRF correction with cluster size larger than 100
  voxels. The small clusters are circled by the red circles, and they are enlarged. L, left; R, right; aHPC, anterior hippocampus; pHPC, posterior hippocampus; AD,
  Alzheimer’s disease; NC, normal control; aMCI, amnestic mild cognitive impairment; SCD, subjective cognitive decline.

gyrus (DMN midline core subsystem-anchored) significantly                               associations. Specifically, the SCNs anchored to the DMN, SN,
correlated with AVLT recognition scores (r = 0.401; p = 0.010);                         and ECN decreased in the SCD group compared with the NC
and the peak volume in the middle temporal gyrus (SN-                                   group. The pattern changes of SCNs seeding from the anterior
anchored) significantly correlated with AVLT recognition scores                         hippocampus, posterior hippocampus, Ch4p, and Ch1/2 as the
(r = 0.376; p = 0.017). In the AD group, the peak volume in the                         order of NC-SCD-aMCI-AD showed similar trends to the SCNs
precuneus showed a significant correlation with AVLT-delayed                            anchored to the DMN. However, the connectivity strength of
recall scores (r = 0.450, p = 0.005). The results of the correlation                    the SCNs seeding from the DMN, SN, anterior hippocampus,
analyses are summarized in Supplementary Tables 22–24.                                  posterior hippocampus, Ch4p, and Ch1/2 decreased in the
                                                                                        individuals with SCD, aMCI, and AD compared with the NCs.
                                                                                        In addition, the connectivity strength of the SCNs seeded from
DISCUSSION                                                                              the ECN was increased in the patients with aMCI and AD.
                                                                                        Our results suggest that the pattern changes in the SCNs as
The present study aimed to investigate the AD-related changes in                        the order of NC-SCD-aMCI-AD are dynamic and divergent,
the GM in SCNs in individuals with SCD and the patients with                            which may provide evidence for disconnection in SCNs in
aMCI and AD. Regarding the DMN and SN, the subjects in the                              individuals with SCD.
aMCI and AD groups showed increased and decreased structural                               The results are partially consistent with previous studies
associations, respectively. Regarding the ECN, the subjects in                          showing changes in the DMN (Seeley et al., 2009; Zhou et al.,
the aMCI and AD groups exhibited linearly increased structural                          2010; Li et al., 2015; Chang et al., 2018; Xue et al., 2019), SN

Frontiers in Aging Neuroscience | www.frontiersin.org                              10                                          August 2021 | Volume 13 | Article 686598
Fu et al. Changes of SCNs in SCD
(Zhou et al., 2010; Li et al., 2015), and ECN (Weiler et al., 2014; between the anterior hippocampus and DMN. In addition,
Li et al., 2015) in patients with MCI and AD based on fMRI a previous study based on SCNs reported that structural
analysis. Moreover, the results in this study were generally in line connectivity between the hippocampus and DMN regions
with the previous studies based on SCNs, which observed changes was limited to the anterior hippocampus, although these
in the DMN, SN, and ECN in patients with AD (Montembeault discrepancies may have been due to methodological differences
et al., 2016; Chang et al., 2018; Li et al., 2019a) and MCI (Li et al., 2018).
(Shu et al., 2018). The possible underlying mechanism is that Atrophy in the cholinergic basal forebrain has been observed
Aβ/tau/neurodegeneration pathological processes originate and in advanced age (Grothe et al., 2012), individuals with SCD
concentrate in the DMN regions (Masters et al., 2015), the (Scheef et al., 2019; Chen et al., 2021), and patients with
connectivity strength within the DMN is weakened, and more AD (Grothe et al., 2012; Kilimann et al., 2014). Specifically,
tissue is needed for the functional compensation. However, a functional network analysis seeding from the anterior basal
functional compensation by a large-scale network was shown in forebrain observed positive functional connectivity of the
the SN and ECN due to AD pathology in our results. In our anterior basal forebrain mainly located in the DMN; and
opinion, performing functional compensation is a more complex connectivity of the posterior basal forebrain mainly located in
process, indicating that there may be multiple ways to participate the SN in individuals with SCD (Chiesa et al., 2019). In the
in this process, not just compensation by large-scale networks. present study, the structural connectivity of Ch4p and Ch1/2 was
Although the results from the SCN analysis do not perfectly mainly located in the DMN medial temporal subsystem in the
overlap the results with the functional network, many researchers individuals with SCD. Thus, the discrepancies may be due to
agree that SCN analysis is an effective tool to investigate the methodological differences and different delineation protocols.
topological organization of the brain and serves as a measure of However, structural connectivity of the Ch4p and Ch1/2 in
network integrity in the cross-sectional group studies (Zielinski the patients with aMCI located in both the medial temporal
et al., 2010; Alexander-Bloch et al., 2013; Montembeault et al., subsystem and midline core subsystem of the DMN and SN
2016; Li et al., 2019a). was observed. In addition, the pattern changes of SCN seeding
SCNs seeded from the anterior hippocampus and posterior from the Ch4p were similar to the pattern changes of SCN
hippocampus have been used to investigate the effects of seeding from the R EC, and the pattern changes of SCN seeding
aging (Li et al., 2018; Nordin et al., 2018), memory (Nordin from the Ch1/2 were similar to the pattern changes of SCN
et al., 2018), plasticity (Guo et al., 2020), and sex (Persson seeding from the L PCC as the order of NC-SCD-aMCI-AD. In
et al., 2014). However, the connectivity changes of SCNs addition, the pattern changes of SCN seeding from the Ch4p
induced by AD-related pathology seeding in the anterior were similar to the pattern changes of SCN seeding from the
hippocampus and posterior hippocampus remain poorly hippocampus as the order of NC-SCD-aMCI-AD. As described
understood. Although the hippocampus belongs to the in a previous study, a significant association between the volume
DMN medial temporal lobe subsystem, the function of the in the Ch4p and right precuneus hypometabolism was shown
hippocampus is more focused on memory. With specialization in SCD (Scheef et al., 2019). In summary, the atrophy of Ch4p
along the long axis, the hippocampus was divided into two has the potential to be a neurodegeneration biomarker in the
anatomical structures, the anterior hippocampus and the early stages of AD.
posterior hippocampus. Moreover, long-range connections Regarding the DMN, studies based on the functional network
between the anterior hippocampus and the perirhinal cortex, showed that connectivity within the DMN was dysfunctional
amygdala, hypothalamus, temporal lobe, insula, and prefrontal due to the pathology of AD (Seeley et al., 2009; Zhou et al.,
cortex; and long-range connections between the posterior 2010), and studies based on the SCN showed that the structural
hippocampus and the parahippocampal cortex, cingulate cortex, connectivity within the DMN medial temporal subsystem was
cuneus, precuneus, prefrontal cortex, and parietal lobe have disrupted due to the pathology of AD (Montembeault et al., 2016;
been confirmed in humans (Poppenk et al., 2013). Our results Li et al., 2019a). In the present results, the structural covariance
suggested that the pattern changes in SCNs seeded from the within the DMN medial temporal subsystem in patients with
anterior hippocampus and posterior hippocampus were similar AD was increased compared with that in NCs. Genetic effects
to those of SCNs seeded from the DMN. However, a greater may be a reason (Bi et al., 2019; Chang et al., 2019; Huang
extent of structural covariance was shown in the anterior et al., 2019; Li et al., 2019b; Tao et al., 2019), and studies
hippocampus than in the posterior hippocampus in all groups, focusing on the effect of Bcl-2 rs956572 (Chang et al., 2018) and
which was consistent with a previous study (Li et al., 2018). MTHFR C677T (Chang et al., 2017) based on SCN showed that
The possible mechanism is that the neurodegenerative diseases homozygotes and heterozygotes exhibited different SCN patterns,
were similar to the accelerated aging, and the age-related although the subjects were all diagnosed with AD. Moreover,
functional connectivity strength in healthy adults between different diagnostic criteria and acquisition parameters may be
the posterior hippocampus and DMN was stronger than the a reason, and the patients with AD in the Alzheimer’s disease
connectivity between the anterior hippocampus and DMN Neuroimaging Initiative database4 are at early stages of AD
(Damoiseaux et al., 2016), while the connectivity changes (CDR > 0.5), but the patients with AD in the present study
in the DMN induced by AD-related pathology may have included those in the early, mid-term, and late stages of AD
a greater impact on the connections between the posterior
hippocampus and DMN compared with the connections 4
http://adni.loni.usc.edu
Frontiers in Aging Neuroscience | www.frontiersin.org 11 August 2021 | Volume 13 | Article 686598Fu et al. Changes of SCNs in SCD (CDR ≥ 1). However, our results are partially in line with subcortical vascular MCI (Wang et al., 2018). Therefore, a specific those of an SCN-based study, in which the structural covariance biomarker is very important for disease diagnosis, intervention, in patients with AD increased compared with NCs within the and therapy. This study aimed to explore the imaging markers DMN midline core subsystem (Li et al., 2019a). Specifically, of SCD, aMCI, and AD based on sMRI at the network level. The although the scope of structural covariance in the AD-related results showed that the pattern changes in the SCNs as the order patients increased compared with the NCs, the connectivity of NC-SCD-aMCI-AD are dynamic and divergent. In addition, strength weakened in the AD-related patients compared with the the decreased extent of SCNs and the weakened connectivity NCs. The weakened connections in our results in individuals strength of SCNs compared with NC are potential to be the with SCD, aMCI, and patients with AD were mainly located imaging biomarkers for SCD. It is worth noting that the atrophy in the precentral gyrus, temporal lobe, prefrontal cortex, and of the entorhinal cortex was observed both in patients with AD parietal lobe. Conclusively, we speculate that the structural and PD (Jia et al., 2019). In the future, it will be interesting covariance of the DMN showed structural hyperconnectivity at to investigate whether the SCNs seeding from the entorhinal the aMCI stage, and then hypoconnectivity was observed in cortex present distinct patterns in patients with AD and PD for the dementia stage. understanding the pathology of two neurodegenerative diseases. The large-scale network referred to as the SN due to its There were some limitations in the present study. First, the consistent activation in response to emotionally significant study was based on cross-sectional data. Although we examined internal and external stimuli showed altered function in AD- NCs and those with SCD, aMCI, and AD to investigate the related patients (Zhou et al., 2010; Li et al., 2019a). Our results pattern changes of SCN, a further longitudinal study should be showed that the structural covariance of the SN increased in conducted. Indeed, a longitudinal study is more appropriate to the AD-related patients compared with the NCs, which was investigate the pattern changes across time. Second, this study consistent with a previous study (Montembeault et al., 2016). used SCN analysis based only on sMRI to explore the connectivity This result suggested that enhancement of connectivity in the SN changes of large-scale networks, and a future study combined may compensate for dysfunction in the DMN due to AD-related with a functional network based on fMRI should be done. pathology (Zhou et al., 2010; Montembeault et al., 2016). Then, a The combination of multiple modality images may provide a linear increase in structural covariance of the ECN was observed better understanding of the mechanism of neurodegenerative with the progression through the NC-aMCI-AD continuum, diseases from both structural and functional sight. Third, there which may support the hypothesis that AD is associated with is a very limited neuropsychological battery in this dataset, and opposing connectivity in the DMN and ECN (Zhou et al., more neuropsychological tests should be included in our next 2010; Montembeault et al., 2016; Li et al., 2019a). In addition, dataset. Fourth, previous studies demonstrated that diabetes we speculate that the ECN acts as a compensatory large-scale would affect cognition in patients with PD (Wang et al., 2020a), network for disconnections in the DMN due to AD pathology. whether the diabetes would affect cognition in SCD is still poorly The SCNs seeded from the DMN, SN, ECN, anterior known. Moreover, cognitive decline may be induced not only by hippocampus, posterior hippocampus, Ch4p, and Ch1/2 in the neurodegenerative diseases but also by mental state or physical SCD group showed a decreased extent of structural covariance frailty (Ma and Chan, 2020), such as depression and anxiety, compared with the NC group. However, the interaction model and more information will be collected in our next cohort study. revealed that loss of connectivity strength of SCNs was observed Finally, the relationship between neurocognitive function and within the DMN, SN, ECN, anterior hippocampus, posterior neuropathogenesis is complex, a future study combined with hippocampus, Ch4p, and Ch1/2 in the individuals with SCD. integrated results of neuroimaging and the AD biomarkers such Regarding the ECN, the subjects with SCD showed enhanced as Aβ and tau should be more persuasive. connectivity strength in the middle occipital gyrus with a small cluster (313 voxels). In addition, a previous study based on the functional network revealed that increased functional CONCLUSION connectivity in DMN regions was observed in individuals with SCD compared with NCs (Hafkemeijer et al., 2013). However, In the present study, we investigated the connectivity changes there are no reported studies based on SCN to explore SCD. of GM SCNs in individuals with SCD, aMCI, and AD. Combined with a previous study (Hafkemeijer et al., 2013), the A decreased extent of structural covariance and weakened results in the present study suggested that structural associations structural connectivity strength were observed in individuals decreased in individuals with SCD, and functional compensation with SCD compared with NCs. Moreover, the divergent and was observed, but structural compensation was not found. These dynamic connectivity changes of SCNs seeding from the DMN, results are potential to indicate that individuals with SCD are at SN, and ECN as the order of NC-SCD-aMCI-AD were shown in high risk of cognitive decline further. this study. Then, the patterns of SCN seeding from subregions Not only AD but also the other neurodegenerative of the hippocampus and basal forebrain were similar to those diseases and cerebral small vessel disease (Zhu et al., 2019) of SCN seeding from the DMN. In summary, the divergent may show cognitive decline at the early stage, such as trajectory of change patterns in SCNs along NC-SCD-aMCI- progressive supranuclear palsy (Yang et al., 2021), cerebral AD potentially provides structural covariance insight into better autosomal dominant arteriopathy with subcortical infarcts understanding the progressive mechanism of cognitive decline and leukoencephalopathy (CADASIL) (Guo et al., 2021), and due to AD-related pathology at preclinical and early stages. Frontiers in Aging Neuroscience | www.frontiersin.org 12 August 2021 | Volume 13 | Article 686598
Fu et al.                                                                                                                                               Changes of SCNs in SCD

DATA AVAILABILITY STATEMENT                                                                  FUNDING
The raw data supporting the conclusions of this article will be                              This study was supported by the National Natural Science
made available by the authors, without undue reservation.                                    Foundation of China (Grant Nos. 81972160, 61633018,
                                                                                             82020108013, 82001773, and 81622025) and the Hebei Provincial
                                                                                             Natural Science Foundation, China (Grant No. F2019203515).
ETHICS STATEMENT
The studies involving human participants were reviewed and
approved by Ethics of the Medical Research Ethics Committee                                  ACKNOWLEDGMENTS
in Xuanwu Hospital. The patients/participants provided their
written informed consent to participate in this study.                                       We would like to thank Ingo Kilimann and Michel Grothe
                                                                                             from the German Center for Neurodegenerative Diseases
                                                                                             (DZNE) Rostock/Greifswald (Rostock, Germany) for sharing the
AUTHOR CONTRIBUTIONS                                                                         cholinergic basal forebrain map.
ZF and SyL were responsible for the conception and design of this
study and wrote the first manuscript. ZF and XW performed the
image preprocessing and experiments. YH and MZ performed                                     SUPPLEMENTARY MATERIAL
the data acquisition. SyL reviewed and critiqued the manuscript.
YrH, JL, and SxL assisted in drafting the manuscript. XL and GK                              The Supplementary Material for this article can be found
reviewed and critiqued the manuscript. All authors contributed                               online at: https://www.frontiersin.org/articles/10.3389/fnagi.
to the article and approved the submitted version.                                           2021.686598/full#supplementary-material

REFERENCES                                                                                      in Alzheimer’s disease. Biomed. Res. Int. 2018:8565620. doi: 10.1155/2018/
                                                                                                8565620
Albert, M. S., DeKosky, S. T., Dickson, D., Dubois, B., Feldman, H. H., Fox,                 Chang, Y. T., Kazui, H., Ikeda, M., Huang, C. W., Huang, S. H., Hsu, S. W., et al.
    N. C., et al. (2011). The diagnosis of mild cognitive impairment due to                     (2019). Genetic interaction of APOE and FGF1 is associated with memory
    Alzheimer’s disease: recommendations from the national institute on aging-                  impairment and hippocampal atrophy in Alzheimer’s disease. Aging Dis. 10,
    Alzheimer’s association workgroups on diagnostic guidelines for Alzheimer’s                 510–519. doi: 10.14336/ad.2018.0606
    disease. Alzheimers Dement 7, 270–279. doi: 10.1016/j.jalz.2011.03.008                   Chen, Q., Wu, S., Li, X., Sun, Y., Chen, W., Lu, J., et al. (2021). Basal
Alexander-Bloch, A., Giedd, J. N., and Bullmore, E. (2013). Imaging structural                  forebrain atrophy is associated with allocentric navigation deficits in subjective
    co-variance between human brain regions. Nat. Rev. Neurosci. 14, 322–336.                   cognitive decline. Front. Aging Neurosci. 13:596025. doi: 10.3389/fnagi.2021.59
    doi: 10.1038/nrn3465                                                                        6025
Arendt, T., Taubert, G., Bigl, V., and Arendt, A. (1988). Amyloid deposition in the          Chiesa, P. A., Cavedo, E., Grothe, M. J., Houot, M., Teipel, S. J., Potier, M. C.,
    nucleus basalis of Meynert complex: a topographic marker for degenerating cell              et al. (2019). Relationship between basal forebrain resting-state functional
    clusters in Alzheimer’s disease. Acta Neuropathol. 75, 226–232. doi: 10.1007/               connectivity and brain Amyloid-β deposition in cognitively intact older adults
    bf00690530                                                                                  with subjective memory complaints. Radiology 290, 167–176. doi: 10.1148/
Ashburner, J. (2007). A fast diffeomorphic image registration algorithm.                        radiol.2018180268
    Neuroimage 38, 95–113. doi: 10.1016/j.neuroimage.2007.07.007                             Damoiseaux, J. S., Viviano, R. P., Yuan, P., and Raz, N. (2016). Differential effect of
Bi, C., Bi, S., and Li, B. (2019). Processing of mutant β-Amyloid precursor protein             age on posterior and anterior hippocampal functional connectivity. Neuroimage
    and the clinicopathological features of familial Alzheimer’s disease. Aging Dis.            133, 468–476. doi: 10.1016/j.neuroimage.2016.03.047
    10, 383–403. doi: 10.14336/ad.2018.0425                                                  Dozeman, E., van Schaik, D. J., van Marwijk, H. W., Stek, M. L., van der Horst,
Braak, H., and Del Tredici, K. (2015). The preclinical phase of the pathological                H. E., and Beekman, A. T. (2011). The center for epidemiological studies
    process underlying sporadic Alzheimer’s disease. Brain 138(Pt 10), 2814–2833.               depression scale (CES-D) is an adequate screening instrument for depressive
    doi: 10.1093/brain/awv236                                                                   and anxiety disorders in a very old population living in residential homes. Int.
Braak, H., Thal, D. R., Ghebremedhin, E., and Del Tredici, K. (2011). Stages of                 J. Geriatr. Psychiatry 26, 239–246. doi: 10.1002/gps.2519
    the pathologic process in Alzheimer disease: age categories from 1 to 100 years.         Evans, A. C. (2013). Networks of anatomical covariance. Neuroimage 80, 489–504.
    J. Neuropathol. Exp. Neurol. 70, 960–969. doi: 10.1097/NEN.0b013e318232a379                 doi: 10.1016/j.neuroimage.2013.05.054
Buckner, R. L., Andrews-Hanna, J. R., and Schacter, D. L. (2008). The brain’s default        Faul, F., Erdfelder, E., Lang, A. G., and Buchner, A. (2007). G∗ Power 3: a flexible
    network: anatomy, function, and relevance to disease. Ann. N. Y. Acad. Sci.                 statistical power analysis program for the social, behavioral, and biomedical
    1124, 1–38. doi: 10.1196/annals.1440.011                                                    sciences. Behav. Res. Methods 39, 175–191. doi: 10.3758/bf03193146
Cantero, J. L., Iglesias, J. E., Van Leemput, K., and Atienza, M. (2016).                    Fischl, B. (2012). FreeSurfer. Neuroimage 62, 774–781. doi: 10.1016/j.neuroimage.
    Regional hippocampal atrophy and higher levels of plasma amyloid-beta are                   2012.01.021
    associated with subjective memory complaints in nondemented elderly subjects.            Fu, Z., Zhao, M., Wang, X., He, Y., Tian, Y., Yang, Y., et al. (2021).
    J. Gerontol. A Biol. Sci. Med. Sci. 71, 1210–1215. doi: 10.1093/gerona/glw022               Altered neuroanatomical asymmetries of subcortical structures in subjective
Chang, Y. T., Hsu, S. W., Tsai, S. J., Chang, Y. T., Huang, C. W., Liu, M. E.,                  cognitive decline, amnestic mild cognitive impairment, and Alzheimer’s disease.
    et al. (2017). Genetic effect of MTHFR C677T polymorphism on the structural                 J. Alzheimers Dis. 79, 1121–1132. doi: 10.3233/jad-201116
    covariance network and white-matter integrity in Alzheimer’s disease. Hum.               Gao, X., Huang, Z., Feng, C., Guan, C., Li, R., Xie, H., et al. (2020). Multimodal
    Brain Mapp. 38, 3039–3051. doi: 10.1002/hbm.23572                                           analysis of gene expression from postmortem brains and blood identifies
Chang, Y. T., Huang, C. W., Chang, W. N., Lee, J. J., and Chang, C. C.                          synaptic vesicle trafficking genes to be associated with Parkinson’s disease. Brief.
    (2018). Altered functional network affects amyloid and structural covariance                Bioinform. 22:bbaa244. doi: 10.1093/bib/bbaa244

Frontiers in Aging Neuroscience | www.frontiersin.org                                   13                                             August 2021 | Volume 13 | Article 686598
You can also read