FS GROUP INTEGRATED MOBILITY PLAYER - Investor Presentation September 2018 6 September 2018 - FS Italiane
←
→
Page content transcription
If your browser does not render page correctly, please read the page content below
FS GROUP
                   INTEGRATED MOBILITY PLAYER
                                 Investor Presentation
                                      September 2018

6 September 2018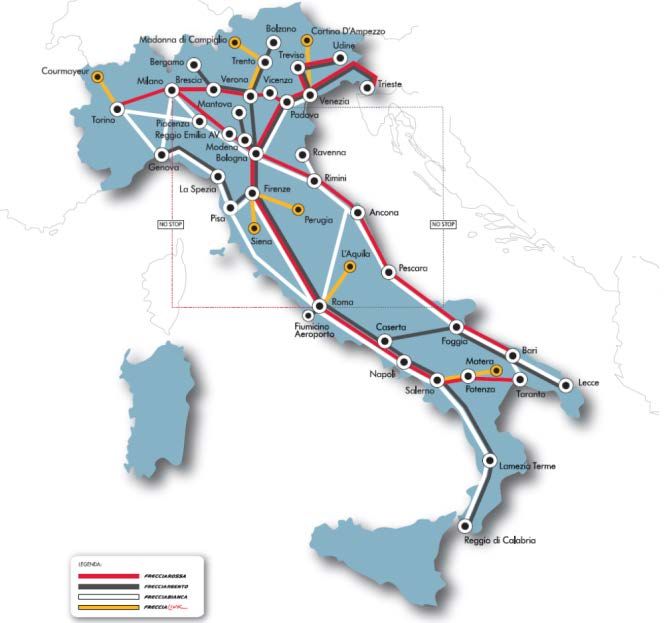
INDICE
                                                CONTENTS
01   Ferrovie dello Stato Italiane Group Overview
02   Operations and Industry Overview
03   Corporate Sustainability - Green Bond Programme
04   Financial Overview
05   Contacts

                                                            2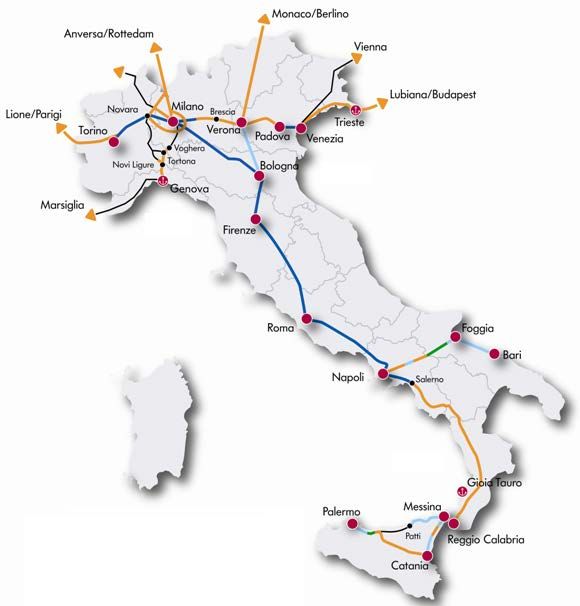
Disclaimer
IMPORTANT NOTICE – STRICTLY CONFIDENTIAL

By accessing this investor presentation, you agree to be bound by the following limitations.

 This presentation has been prepared by Ferrovie dello Stato Italiane S.p.A, is the sole responsibility of Ferrovie dello Stato Italiane S.p.A.. The information set out herein may be subject to updating, revision, verification and
amendment and such information may change materially. Ferrovie dello Stato Italiane S.p.A. is under no obligation to update or keep current the information contained in this presentation or in the presentation to which it relates and
any opinions expressed in them is subject to change without notice. None of Ferrovie dello Stato Italiane S.p.A. or any of its respective affiliates, advisers or representatives shall have any liability whatsoever (in negligence or
otherwise) for any loss whatsoever arising from any use of this presentation or its contents, or otherwise arising in connection with this presentation.

 This presentation is being communicated in the United Kingdom only to persons who have professional experience in matters relating to investments falling within Article 19(5) of the Financial Services and Markets Act 2000 (Financial
Promotion) Order 2005 and to persons to whom it may otherwise be lawful to communicate it to (all such persons being referred to as relevant persons). This presentation is only directed at relevant persons and any investment or
investment activity to which the presentation relates is only available to relevant persons or will be engaged in only with relevant persons. Solicitations resulting from this presentation will only be responded to if the person concerned
is a relevant person. Other persons should not rely or act upon this presentation or any of its contents.

 The information in this presentation is confidential and this presentation is being made available to selected recipients only and solely for the information of such recipients. This presentation may not be reproduced, redistributed or
passed on to any other persons, in whole or in part. This presentation is for information purposes only and does not constitute or form part of, and should not be construed as, any offer for sale or subscription of, or solicitation of any
offer to buy or subscribe for, any securities of Ferrovie dello Stato Italiane S.p.A. nor should it or any part of it form the basis of, or be relied on in connection with, any contract or commitment whatsoever. This presentation does not
constitute a recommendation regarding the securities of Ferrovie dello Stato Italiane S.p.A.

This presentation and the information contained herein are not an offer of securities for sale in the United States and are not for publication or distribution to persons in the United States (within the meaning of Regulation S under the
United States Securities Act of 1933, as amended.

 This presentation is for distribution in Italy only to "qualified investors" (investitori qualificati), as defined pursuant to Article 100 of Legislative Decree no. 58 of 24 February 1998, as amended and restated from time to time (the
Financial Services Act), and as defined in Article 34-ter, paragraph 1(b) of CONSOB Regulation no. 11971 of 14 May 1999, as amended and restated from time to time (the CONSOB Regulation), or in other circumstances provided under
Article 100 of the Financial Services Act and Article 34-ter, CONSOB Regulation, where exemptions from the requirement to publish a prospectus pursuant to Article 94 of the Financial Services Act are provided.

 This presentation may contain projections and forward-looking statements. Any such forward-looking statements involve known and unknown risks, uncertainties and other factors which may cause Ferrovie dello Stato Italiane S.p.A.’s
actual results, performance or achievements to be materially different from any future results, performance or achievements expressed or implied by such forward-looking statements. Any such forward-looking statements will be
based on numerous assumptions regarding Ferrovie dello Stato Italiane S.p.A.’s present and future business strategies and the environment in which Ferrovie dello Stato Italiane S.p.A. will operate in the future. Furthermore, any
forward-looking statements will be based upon assumptions of future events which may not prove to be accurate. Any such forward-looking statements in this presentation will speak only as at the date of this presentation and
Ferrovie dello Stato Italiane S.p.A. assumes no obligation to update or provide any additional information in relation to such forward-looking statements.

                                                                                                                                                                                                                                                 3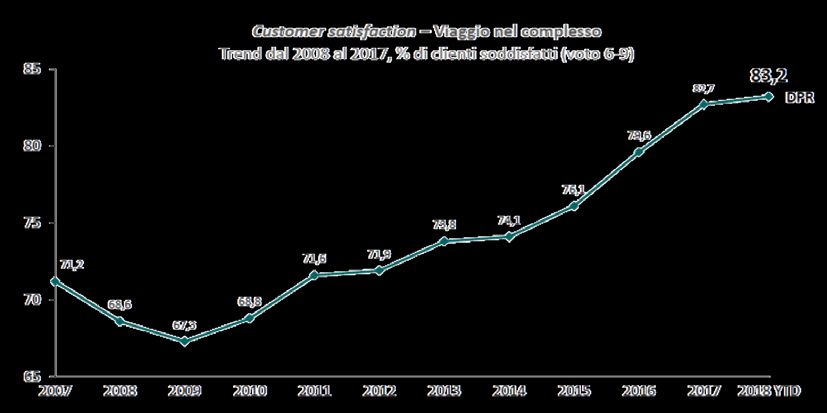
Ferrovie dello Stato Italiane
           Group Overview
FS Group in a snapshot
Ferrovie dello Stato Italiane SpA (“FS” or the “Issuer”) – 100% Italian State owned – is the holding company of the Italian railway
group (FS Group), which is the main provider of transport services in Italy by rail and bus both passenger and freight.
As one of the largest industrial groups in the country, it manages rail networks and transport services, contributing to develop
integrated mobility and logistics in Italy and abroad.
100%
(*) 100%
100% 100% 100% 51.00% 100% 100% 36.7% 100% 100% 100% 60,00% 100% 55,66% 100% 100%
Grandi Grandi
Netinera Ferrovie ANAS Cento FS
Busitalia Trainose RFI Italferr Stazioni Stazioni Ital Fercre Ferse
Trenitalia Mercitalia DL Sud M5 (b) stazioni Sistemi
Sita Nord (a) Rail Immobi certifer dit rvizi
GmbH Est (c) Urbani
liare
TRANSPORT INFRASTRUCTURE COMMERCIAL REAL ESTATE OTHER SERVICES
Group Revenue by segment (2017) ** 2017 Consolidated Highlights (€mn)
Real Estate Other services Revenue 9,299**
Services 3% EBITDA 2,313
3%
EBITDA Margin 25%
EBIT 718
Infrastructure EBIT Margin 7.7%
24% Transport
Net Income 552
70%
Net Invested Capital 45,954
Equity 38,681
(a) Effective from September 2017 Net Financial Debt 7,273
(b) Effective from January 2018
(c) Incorporated in RFI from 16 July 2018 after the spin-off of part the business in a newco Centostazioni Retail that is currently on sale
* FS Group main line and operating segments Source: FS 2017 Annual Report
**Net of (1,575)m of cons.adj.
5Key Operating Data
Long-haul transport - market Long-haul transport – Public Regional transport *
services - “Frecce” Service Contract
Road transport* Railway network Cargo transport
Stations
Tons Km total - million Tons Km abroad - million
Passengers - km million Trains\Bus - km thousand
(*) 2017 traffic data reflect the acquisitions of the year, as they include the domestic traffic of Trenitalia S.p.A., Busitalia group including Qbuzz and Ferrovie Sud Est e Servizi
Automobilistici S.r.l., and the traffic abroad of Trenitalia c2c Ltd, TrainOSE SA and Netinera group. 2016 traffic data refers to Trenitalia S.p.A., Busitalia group and Netinera group. 6
Source: FS 2017 Annual ReportBenchmarking with European rail players
Trend in passenger and cargo traffic
160
(€b) 2015 2016 2017 Issuer Rating 150
140
Revenue 8.5 8.9 9.3 Fitch BBB 130
120
110
EBITDA margin % 23% 25.7% 25% S&P BBB 100
90
80
EBIT margin % 7.5% 10% 7.7% 70
60
50
40
2012 2013 2014 2015 2016 2017
160
150
(€b) 2015 2016 2017 Issuer Rating 140
130
Revenue 43.2 43.3 45.6 120
110
100
EBITDA margin % 10% 10.3% 9.9% S&P AA- 90
80
70
EBIT margin % -0.4% 3.4% 3.7% Moody’s Aa1 60
50
40
2012 2013 2014 2015 2016 2017
160
150
(€b) 2015 2016 2017 Issuer Rating 140
130
Revenue 31.4 32.3 33.5 Fitch AA 120
110
100
EBITDA margin % 14% 12.8% 13.7% S&P AA- 90
80
70
EBIT margin % -0.3% 6.6% 7.9% Moody’s Aa3 60
50
40
2012 2013 2014 2015 2016 2017
Source: FS, DB, SNCF Annual Reports and rating agencies’ websites 7Rating Overview
RATING COMMENTS
FS' rating reflects the:
Corporate • “very important” role for the Italian government as holding group
Rating BBB of the country’s national railway and the “integral” link with its
Outlook sole owner (Italian Govt)
Stand STABLE • “Strong” business risk profile: «…dominant market position in the
Alone Italian transport segment and network concessionaire…the
Credit
bbb
vertical integration combines infrastructure manager and
Profile transportation services and gives earnings operating stability»
1 notch upgrade on • “Intermediate” financial risk profile: «FS’s financial metrics
October 30th 2017 remain solid with FFO/debt at ~ 20% in 2016»
FS' rating reflects the:
• Full ownership and high integration with the Italian
Corporate government and its key role for railway transport and
Rating
BBB mobility in Italy as well as the national infrastructural
Outlook development
STABLE
Stand • Revenue Defensibility: «…a dominant market share in
Alone BBB passenger transportation services in Italy and growing
Rating operations in UK, Greece and Netherlands»
• Financial profile: «…Fitch expects FS to maintain strong
Rating confirmed on operating cash flow generation capacity»
November 2nd 2017
Source: S&P and Fitch reports. Please refer to the rating agencies’ websites for further information. 8Integrated Mobility Player
M5 closing: Busitalia acquires ANAS becomes New BoDs
Trenitalia FS acquires 36.7% Qbuzz: the Dutch part of FS appointed for the
acquires the UK from Astaldi in M5, company which Group for an period 2018-2020
franchisee C2C the concessionaire operates public integrated Gianluigi Vittorio
which operates of the new bus transport railway and Castelli as Chairman
the London- underground line 5 services in the road Gianfranco Battisti
South Essex line in Milan Netherlands infrastructure as CEO
Feb 2017 Apr 2017 June 2017 Aug 2017 Aug 2017 Sep 2017 Jan 2018 HY 2018 30 Jul 2018
Busitalia FAST: Trenitalia signed Acquisition of Trenitalia signed
FS Group enters the new long-haul TrainOSE, the new 15 years Public
in the long Public Service leading Greek Service Contracts
distance road Contract with the railway with 8 regions and is
transportation Government for the transport negotiating with all
with Busitalia period 2017-2026 company of the others to
bring current 8 ys
contracts to new 15
years PSCs
9Operations and Industry
Overview
TransportTrenitalia: rail passenger transport in Italy and abroad
Key highlights Financial highlights
• Trenitalia is one of the leading railway operators in Europe €mn 2016 * 2017
Revenues 5,078.7 5,318.4
• Everyday manages about 9,000 trains and each year transports c. 600 million of EBITDA 1,394.5 1,585.7
passengers EBIT 332.5 399.1
• Trenitalia is also abroad with c2c in UK and Thello in France Net Income 116* 276.2
EBITDA Margin 27.5% 29%
• Organized in two business segments: EBIT Margin 6.5% 7.5%
medium/long distance passengers
regional passengers
Medium Long distance revenues (€mn) Regional revenues (€mn)
Commuter passenger
High Speed services 2016 2017 Change
2016 2017 Change services
International and
2,295 2,506 +9.9% Regional/Inter- 2,751 2,774 +0.8%
domestic services
regional services
* Note:
Trenitalia demerged its Cargo division allocating the related assets to Mercitalia Rail with effect as of 1 January 2017.
In accordance with IFRS 5 “Non-current assets held for sale and discontinued operations”, the revenue and costs of such division for 2016 were recognized in the separate item “Loss from discontinued
operations” in the income statement, after the profit from continuing operations.
Therefore Trenitalia’s 2016 and 2017 Revenues, EBITDA and EBIT items hereby shown does not include freight division results, which however contributed to the Net Income in 2016.
Source: Company information, Trenitalia 2017 Annual Report 11Focus: High Speed Transport
Frecce network • The Medium\Long Haul Passenger Division ensures the national and international passenger
transportation, including High Speed services
• The Italian High Speed network connects the main metropolitan area of the country
• High Speed services have been the key element for the modal shift from plane to rail in Italy
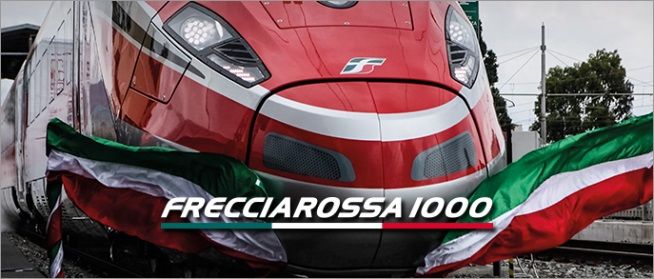
• Frecciarossa trains are the Trenitalia's flagship product, combining high-speed and
maximum comfort
The ETR 1000, named “Frecciarossa 1000” is the new high-speed train of
Trenitalia, comfortable, safe and environmentally friendly, designed to
meet the most advanced techniques.
Able to travel on all European high-speed networks.
The fleet counts 50 ETR 1000 with the last delivered in June 2017
Part of fleet was funded via the first green bond issued by FS in November
2017
Milan – Rome route modal share
Highway Air Train
Italy, sole country to have competitors on HS, has lower fares 100%
and higher frequency compare to European peers
Eligible Green 80% 36% 36%
Departure - Fare/Km Frequency 44% 49%
Destination (€/km) (n°rides between 9 - 13 ) Project 55% 57% 61% 63% 62% 64% 67%
60%
Rome – Milan 0.15 17
40%
Barcelona - Madrid 0.17 5
Lyon - Paris 0.23 5 20%
Hamburg - Berlin 0.28 5 0%
2007 2008 2009 2010 2011 2012 2013 2014 2015 2016 2017
Source: Company information Launch of the ‘Frecce’ network
12Focus: Regional Transport
Overview Trenitalia regional services portfolio as of today
• Offers urban, regional and interregional mobility 8ys* 2ys*
Longer PSCs
• Business with local administrations is regulated by 5+5ys 15ys enable more
different Public Service Contracts (‘PSCs’) 15ys investments
22ys
15ys
• PSCs are subject to specific regulation in terms of
eligible costs and adequate capital investments 8ys* 8ys*
returns 15ys
Trenitalia has been renewing
Public Service Contracts with a
8ys*
• In 2017 revenues related to regional passenger much longer duration (15years) 15ys 8ys*
services equal € 2,774mn (+0.83% vs. 2016) with all 20 Italian regions 8ys* 15ys
8ys*
8ys* 15ys
9ys*
* negotiation ongoing for new PSC signed for the period 2015 – 2020
15 years PSCs from 2019 operated by Trenord.
13Focus: Regional Transport
Service Enhancement
• The regional fleet will be upgraded in 2019-2024 by 229 new medium capacity (“Pop”) and 288 high-capacity (“Rock”) highly energy
efficient trains for a total expected investment of €4.25 bn*
Eligible Green
€ 4.25 billion
Project Total expected
investment
• First 39 Rock and 47 Pop deliveries will enhance the fleet of Emilia Romagna region from 2019
These regional trains daily let commuters, students, tourists Overall Customer satisfaction
and workers travel throughout the country reached 84% (% satisfied
clients)
We are investing for the
regional transport
turnaround
* The framework agreement signed in 2016 with the suppliers for the furniture of a total of 150 + 300 trains, is
already under review to be upgraded for the new orders. The actual orders will be placed according to the
contracts subscription with Regions.
Part of the trains will be purchased by the Regions
Source: Company information; Trenitalia 2017 Annual Report
14Busitalia: road passenger transport in Italy and abroad
For an integrated mobility
Key highlights Financial highlights
• Busitalia provides local bus transport, both urban and suburban, in Veneto, Tuscany, €mn 2016 2017
Umbria and Campania Revenues 354 472
• In August 2017 Busitalia acquired Qbuzz, the Dutch company which operates public bus EBITDA 36 43.1
transport services in the Netherlands EBITDA Margin 10% 9.1%
• Busitalia also operates long-distance bus services, tourism and rental and arranges the EBIT 13 15.3
replacement of rail services by bus ones including Freccialink EBIT Margin 4% 3.2%
NET INCOME 5.9 9
One of the country’s top players together with ATAC and ATM
500 472
Production Revenues
400 354
+500% vs 2011 330
110 mn Bus-Km 300 293
203
200
Passengers 111
69
200 mn/year 100
€mn
0
2011 2012 2013 2014 2015 2016 2017
Source: Company information; Busitalia Annual Reports 15Operations and Industry
Overview
InfrastructureRFI: Railway Infrastructure Manager
Key figures High Speed Network Traditional network
€mn 2016 2017
Revenues 2,575 2,537.7
Track access charges 1,058 1,103
CdP-Service 975.5 975.5
Sale of electrical energy for
200 59
traction
Other income 341 400
EBITDA 357 480
EBITDA margin % 14% 18.8%
EBIT 215 293
EBIT margin % 8% 11.5%
Net Income 181 262
TOTAL PRODUCTION 2017 Draft
Work In progress
354 million train-km Operating (HS)
Operating (HS up to 250 km\h)
22.5% from no-FS Group railway
companies INFRASTRUCTURE INVESTMENTS € 4,409 million
NETWORK HIGHLIGHTS 2017 CAPEX FOR EXTRAORDINARY
MAINTENANCE AND SAFETY (MN)
1,653
+77%
1,794 95% Traditional network
16,787 km network lenght 1,495
1,014
1,120 5% High Speed network
23,016 km Traditional tracks 982
1,497 km HS tracks
40% Maintenance and Safety
2012 2013 2014 2015 2016 2017
Source: Company information; FS 2017 Annual report; RFI 2017 Annual report and RFI Website
17ANAS: road infrastructure
• ANAS is part of FS Group since January 2018, following the
equity transfer from the MEF. Investment Programme Agreement 2016-2020 signed with the MIT
• With ANAS, alongside RFI, FS group is now Europe’s largest 17%
integrated rail and road hub in terms of both number of
people serviced and investments 36% new projects
routes completion
Designing, construction and maintenance 2%
of national roads 23.4 bn road access
reactivation
post-
Concessionaire of 26,000 km of roads 44% earthquake
~ 1000 km of highways
extraordinay
maintenance and 1%
safety upgrade other investments
1 2 4 5
Sharing of
Synergies from the know-how and Investment Designing and Procurement Reducing
integration technologies planning construction extra costs
44,000 km of railway and roads
18Corporate Sustainability
Green Bond ProgrammeFS Sustainability approach
Our sustainability approach permeates the full organizational structure ensuring integration of environmental, social and
economical aspects within strategic business decisions
A BUSINESS THAT IS PART OF THE E C O N O M I C COMMUNITY
AND PROVIDES INTEGRATED AND SUSTAINABLE MOBILITY
A N D LOGISTICS SERVICES, USING TRANSPORT INFRASTRUCTURES
SYNERGICALLY A N D CREATING VALUE IN ITALY A N D ABROAD
ECONOMIC SOCIAL ENVIRONMENTAL
COMMITMENT COMMITMENT COMMITMENT
Be at the forefront of an Be pioneers in the
Be a leader integrated mobility development and
in the mobility sector project that, through a implementation
by promoting the quality virtuous business model, of large-scale integrated
and efficiency of transport encourages fair business mobility solutions that
and infrastructure services practices and active help regenerate natural
engagement capital
20FS Green Bond Framework
• Ferrovie strongly believes that rail and public transport are critical for sustainable development and global efforts to combat
climate change, by facilitating the modal shift away from cars into less carbon intensive modes of transport.
• Ferrovie has developed a Green Bond Framework which is in accordance with the 2017 ICMA Green Bond Principles and
which aims at financing projects with a positive impact in terms of environmental and social sustainability. The GBF
obtained a Second Party Opinion from Sustainalytics
ELIGIBLE GREEN PROJECTS
To ensure energy efficiency improvements, carbons emission reduction and modal shift to rail in the local and long distance public transport, among other
improvements related to air quality and comfort for passengers
NEW ELECTRIC MULTIPLE UNIT (EMU) TRAINS FOR REGIONAL PASSENGER NEW HIGH SPEED TRAINS “ETR 1000”
TRANSPORT: POP and ROCK
The renewal of the regional fleet continues with these new highly energy efficient The ETR 1000, named “Frecciarossa 1000” is the new high-speed train of Trenitalia,
trains both medium capacity (“Pop”) and high-capacity (“Rock”) comfortable, safe and environmentally friendly, designed to meet the most advanced
technology (ERTMS/ECTS traction control system)
An estimated reduction of 30% in energy consumption with respect to An average reduction of 18% in energy consumption with respect to
comparable trains operating in Italy
comparable Frecciarossa ETR 500
Innovative technologies for energy efficiency (engines with natural ventilation,
use of light alloys, LED lighting, CO2 sensors for optimal climatization, smart Extremely accurate aerodynamic design to minimize motion resistance
parking mode, etc)
High efficiency of traction system
Recyclability rate over 92%
LED lighting
More bikes racks, with charging points for electric bikes
Recyclability rate over 94%
Access to "White Certificate" mechanism (national incentives scheme for high
energy efficiency investments) obtained on February 15th, 2017 First HS train provided with Environmental Product Declaration (EPD)*
Awarded in the top ten Italian initiatives for sustainable mobility 2017 Access to "White Certificate" mechanism (national incentives scheme for high
energy efficiency investments) obtained on December 1st, 2015
21FS Inaugural Green Bond
• On 30 November 2017 FS successfully placed its Eur 600 million 0.875% due 12/2023 inaugural green bond off its Eur 4.5bn EMTN Programme
• Demand exceeded 1.3 billion euro from 115 investors, more than 60% outside Italy and around 50% of final orders were from institutional
investors with sustainability commitment.
97% proceeds allocated at
the date of issue
Geografic distribution green bond investors
PROCEEDS MANAGEMENT AND ALLOCATION (€ mn)
UK Allocated net Allocated net
Iberia 2%
ELIGIBLE GREEN PROJECT proceeds as of proceeds as of
4%
Other 7 December 2017 4 April 2018
Nordics
4% 6% New High Speed Trains “ETR 1000” 535.49 549.64
Germany & Italy New Electric Multiple Unit (EMU) Trains For Regional Passenger
49.78 49.78
Austria 39% Transport: Pop And Rock
9% TOTAL 585.27 599.42
Netherlands UNIT OF TRAIN
10%
TRAIN MODEL
FUNDED
France
26%
FRECCIAROSSA 1 0 0 0 17
39 new investors
”POP” 3
compared to previous
public issues, mainly
“green”
”ROCK” 4
22Eligible Green Projects KPI reporting
Environmental performance of the rolling stocks funded via the Green Bond
ENVIRONMENTAL IMPACTS “ E T R 1 0 0 0 ” ENVIRONMENTAL IMPACTS “POP ” and “ROCK ”
KPI UNIT TOTAL IMPACT KPI UNIT POP ROCK TOTAL IMPACT
UNIT OF TRAIN N. 17 UNIT OF TRAIN N. 4 3 7
FUNDED FUNDED
TOTAL ENERGY SAVING* MWh -33,108 -20.5% TOTAL ENERGY MWh -2,565 -497 -3,061 -20.5%
SAVING*
TOTAL GHG EMISSIONS tCO2 47,960 TOTAL GHG tCO2 3,388 1,193 4,581
EMISSIONS
TOTAL GHG EMISSIONS tCO2 -12,349 -20.5% TOTAL GHG tCO2 -957 -185 -1,142 -20.5%
AVOIDED* EMISSIONS AVOIDED*
* the proxy for the calculation of energy saving and avoided GHG emissions is the “ETR 500” with 9 coaches * the proxy for the calculation of energy saving and avoided GHG emissions is the market average of comparable trains
Data of the ETR1000 are actual as these 17 trains are already in operation. Data for the POP and ROCK EMU are estimates based on the values stated by the suppliers in the tender
process according to the European technical specification TS 50591 (ex UIC/UNIFE TECREC 100_001)
“Specification and verification of energy consumption for railway rolling stock”.
The first POP an ROCK will be deployed in 2019 in Emilia Romagna region, where the Group has signed a
Public Service Contract for 22 years.
23FS Green Bond Framework
Next steps
• As part of the renewal of the regional transport fleet, further Rock and Pop (Eligible Green Projects) are in the investment
pipeline for a total expected amount of € 4.25 billion* in 2019-2024
• These investments are expected to be funded via green bond*
• Furthermore, according to the Green Bond Framework, FS may decide to include additional Project Categories for future
issuances
FS is working to increase the EMTN Programme size up to Eur 7 billion from the current Eur 4.5 billion
FS sustainable approach relates to the whole life cycle of the rail transport, including the funding process.
FS thinks that green bond is the best tool to fund the majority of investments in the coming years, to ensure and
strengthen its ambition to develop a sustainable transport service
* Part of the trains will be purchased by the Regions and therefore not in the funding needs
24Financial Overview
Robust financial performance continues to improve
9,500                                                                                                                                                                                 CAGR
                                                                                                                                                         9,299
                                                                                                                          8,928                                                       +2.48%
9,000                                                                                                                                                       Revenue
                                                                                                    8,585
                                                                                                                                                                               Solid increase in revenue
8,500                                          8,329                        8,390
                      8,228                                                                                                                                                         over the period
                                                                                                                                                 2,313
8,000
                                                                                                                       2,293
                                                                                                                                                            EBITDA
                                                                                               1,975
7,500
€mn
                  1,918
                                            2,030                      2,114                                                                                                           CAGR
7,000
                                                                                                                                                                                        +2%
                                                                                                                                                         6,986

                                                                                                                               6,635          Operating Costs           …focus on expenses containment
6,500                                                                                                6,610                                                                 despite employees growth
                      6,310                     6,296                        6,276
6,000
                  2012                     2013                        2014                    2015                    2016                      2017

                                                                                        Consistent profitability and margins

        2,500                                       2,293                            2,313                               30.0%
                                                                                                                                                                      25.7%                   24.9%
                      1,975                                                                                              25.0%               23.0%
        2,000
                                                                                                                         20.0%
        1,500
      €mn                                                                                                                15.0%
        1,000                                                  892                                                                                                            10.0%
                                                                      772                    718
                              644                                                                                        10.0%                       7.5%                                             7.7%
                                     464                                                            552
            500                                                                                                           5.0%

             0                                                                                                            0.0%
                              2015                          2016                             2017                                               2015                        2016                  2017

                                           EBITDA       EBIT         Net Income                                                                             EBITDA Margin      EBIT Margin
                                                                                                             Source: FS 2017 Annual Report                                                                   26
Group revenues breakdown
• In 2017 Revenues increased by €371 million (+4% vs 2016, +9% net of non recurring items), as a result of the rise in revenue from transport
services (+11%) and the growth in revenue from infrastructure services (+3%), offset mainly by the decrease of €353 million in other income.
Medium and long haul Short haul Rail Short haul Road Public service contract fees Infrastructure services
• +€114 million • +€74 million in Italy • +€28 million in Italy • +€112 million from Government • +€51 million:
essentially in Italy: anti-evasion measures. Consolidation of companies Renewal of the 2017-2026 public service Increased government
recovery in demand in Busitalia Group and FSE. contract between Trenitalia and the MIT for grants related to
for mobility
• +€207 million from the
the national long-haul transport. income
international market
increase in the
• +€24 million from the Consolidation of TrainOSE Increased revenue from
consolidation of the British international market toll services by €14
commercial offer of Trenitalia c2c (€177
“Freccia” products • +€145 million from Regions million due to greater
million) and the Greek Acquisition of the Dutch volumes
TrainOSE (€19 million) bus company Qbuzz
Fees from Italian regions rose by €87 million
greater volumes in Positive contribution from Dutch and
German market with German markets (€58 million), through the
Netinera (€11 million). consolidation of Qbuzz and greater fees
from Netinera.
Transport – Market
+ 371 9,299
Revenues breakdown Transport Revenues: REVENUES: (+4%)
€mn 2016 2017 change % Ordinary vs 8,928
Market vs. PSCs Extraordinary
Transport services 6,385 7,067 11%
Passenger traffic products 3,164 3,610 14%
Cargo traffic products 860 839 -2% 37% 37%
Market revenues 4,024 4,449 11%
Revenues net of
extraordinary + 779
PSCs and other contracts 248 360 45% transactions
8,535 (+9%) 9,314
Fees from the Regions 2,113 2,258 7% (+472 from
Public service contract fees 2,361 2,618 11% 63% 63% acquisitions)
Infrastructure services 1,282 1,325 3%
Other services revenues 241 240
Other income 1,020 667 2017 2016 Revenues from
Public service contract fees extraordinary 393
Total Group Revenues 8,928 9,299 4% Market revenues transactions
Source: FS 2017 Annual Report -15
2016 Euro million 2017 27Focus on operating costs
• In 2017 operating costs amounted to €6,986 million, up by 5.3% on 2016 (€6,635 million)
Personnel expense increased by €227 million mostly due to the expansion of the consolidation scope (+€178 million) and the effects of the full
application of the new national labour agreement for the railway mobility sector
The decrease in raw materials, consumables, supplies and goods (-€94 million) was significantly affected by the drop in energy costs almost
entirely due to the price effect of the new rate regime
Greater capitalisations due to the increase in investments
Transport services account for the majority of operating expenses given the higher proportion of labour and service costs
Breakdown of operating costs Total operating costs by division
4,500 4,178 7,000
3,951
5,888
6,000 5,440
3,500 Transport
5,000
2,663 Personnel expense
2,421 Infrastructure
2,500 4,000
Raw materials Real Estate
3,000 Services
1,500 1,230 2,276 2,132
1,136 Other services
€mn Services 2,000
500 1,000 Cons. Adj.
Other costs incl. 279 258 275 266
Capitalisation
€mn 0
-500 2016 2017
2016 2017
-1,000
-967 -991
-1,500 -2,000 -1,619 -1,574
Source: FS 2017 Annual Report
28FS Group’s CAPEX profile
Leading investor in development of transport, infrastructure and logistics
• For the third consecutive year, FS’s capital expenditure exceeded €5 billion (€ 5,407 million in 2017, of which €4,301 million through government
grants mainly earmarked to infrastructure).
• The majority of capex is related to the maintenance and development of the rail infrastructure network carried on by RFI, with a focus on
Traditional network (~ €4bn). Infrastructure capex is almost totally funded by the Government according to provisions of “Contratto di Programma”
between Ministry of Infrastructure and Transport and RFI.
• Trenitalia accounts for 17% - €940million, including €342 million for value-increasing maintenance.
€ 192 million was earmarked to complete the “Frecciarossa 1000” fleet (financed via the Inaugural Green Bond)
€ 218 million went to the regional fleet both for new trains and revamping (part of the new trains financed via the Inaugural Green Bond)
FS Capex in 2016 - 2017 2016 - 2017 capex breakdown
7,000
5,950 New Rolling
6,000 5,497 5,407 Stock
4%
5,000 3%
10%
26% Revamping
4,000 17% 38% 16%
3,000 78% 4% IT, plants and
67% 36%
1% other
2,000 2016
1,000 Value-
2017 increasing
€mn maintenance
0
RFI - Traditional network RFI - High Speed network
2015 2016 2017
Trenitalia Other capex
Source: FS 2017 Annual Report
29FS’ debt profile
Funding diversification
• Total gross financial debt (long term+short term) amounts to € 11,514mn* at YE 2017 vs. €11,862mn at YE 2016. The bulk of FS Group’s debt is held by FS Holding (€ 8,097mn).
• Part of FS' debt is funded directly through guaranteed State transfers (€ 2.57 billion out of the total debt of € 11.51 billion at YE 2016). This debt is earmarked to infrastructure
investments.
• With 9 issuances for € 3.95 bn outstanding, FS has significantly increased the use of senior unsecured bonds for its funding needs since the establishment of the €4.5bn EMTN
Programme, which now account for 40% of financial sources. Indeed, FS is working to increase the EMTN Programme size up to €7 billion.
• Supranational entities such as EIB, Cdp, Eurofima, still act as important Group’s lenders whereas bank lending accounts for 13%.
• FS renewed in July a €2 billion committed revolving credit facility underwritten by a pool of 11 banks and increased from the previous €1.5 bn expired in May. Besides, FS has
additional uncommitted credit lines granted by several primary banks.
• Net Financial Debt amounts to € 7,273mn at YE 2017 increasing by 513 million on YE 2016, mainly due to a decrease in cash and cash equivalents following the equity
investments made during the year.
Breakdown Financial sources 2012 - 2018 (a) Split of external debt by company as of 31 Dec 2017
13% €mn Gross financial debt
Supranational 11% EMTN FS (Holding Company and bond Issuer) 8,097
Entities bonds in
13% 12% Rete Ferroviaria Italiana 1,739
EMTN Bonds CSPP since
88% July 2016 (b) Trenitalia 737
Bank Loans
76%
2012 47%
Other Group’s Companies 941
40%
Total Long Term Debt + Short Term
2013 Financing 11,514*
2018 Q2 *Of which € 9,125mn long term debt and € 2,389mn short term debt and
current portion of long term debt
(a) These percentages are calculated on the long term debt held by FS\RFI\TI which amounts to around 9.7 billion
(b) In PSCC from July 2015 to July 2016
Source: FS 2017 Annual Report 30Balanced debt maturity profile
Effective management of financial expense
• The Group has a balanced debt maturity profile extending over the next 15 years, with the majority of maturities falling due over the next 5 years.
• In Q1 2018 FS has reduced short term borrowing from banks that is nil as of 30 June 2018.
• Historically low borrowing costs and an effective management of financial costs, including interest rate risk management policies, has resulted in a
containment of interest expense on debt generating value for the Group.
• In 2017 interest expense on debt was a record low at 1.5%.
Group long term debt maturity profile as of 30 June 2018* Interest expense on financial liabilities **
2,000
1,800 3.1%
1,600 2.8% 2.8%
2.7%
1,400 2.4%
1,200
1,000 1.7%
1.5%
800
600
400
200
€mn
-
2018 2019 2020 2021 2022 2023 2024 2025 2026 2027 2028 2029 2030 2031 2032 2011 2012 2013 2014 2015 2016 2017
Uncovered by State Transfers Covered by State Transfers
* Maturity profile calculated on the long term debt, included the current portion of the long term debt, held by FS\RFI\TI which amounts to around 9.7 billion
** The financial expense is net of government grants, therefore the ratio is calculated on the debt not funded through guaranteed government grants
Source: FS 2017 Annual Report
31Debt service capacity
• Given improvement in profitability and conservative debt management, Net Financial Debt / EBITDA has
decreased to 3.1x in 2017 from 4.7 in 2012.
• Historically low borrowing costs and effective management of financial costs, including interest rate risk
management policies, resulted in EBITDA interest cover improved substantially in the last five years reaching
17x in 2017.
• FS Italiane maintains a strong capitalisation.
Leverage evolution and EBITDA interest coverage Capitalisation
18 35%
16.9
16 31%
16.0 31% 30% 31%
14 30% 29%
30%
12
10.8
9.9 10.8 25% 24%
10 8.9
23%
8
x.x
6.1 20%
6 5.6 5.2 5.6 5.2 19%
5.0
4 4.7 17% 18% 18%
4.2 3.1 15%
2 2.9 3.4 2.9
-
10%
2012 2013 2014 2015 2016 2017
2012 2013 2014 2015 2016 2017
Net Financial Debt\EBITDA Total Debt \ EBITDA
Net Financial Debt\Equity Total Debt\EQUITY
EBITDA\Interest expense
Source: FS Annual Reports
32FY 2017 Consolidated Financial Statements
Income Statement Reclassified Statement of Financial Position
€mn 2016 2017 Change % €mn 2016 2017 Change
REVENUE 8,928 9,299 4.2 Net operating Working Capital 404 402 (2)
Revenue from sales and services 7,908 8,632 9.2 Other Net Assets 591 1,173 582
Other income 1,020 667 (34.6) Working Capital 995 1,575 580
OPERATING COSTS (6,635) (6,986) (5.3)
Net non-current assets 47,330 47,279 (51)
EBITDA 2,293 2,313 0.9
Other provisions (3,068) (2,902) 166
Amortisation, depreciation, provisions and
(1,401) (1,595) (13.8) Net assets held for sale 2 2
impairment losses
EBIT 892 718 (19.5) NET INVESTED CAPITAL 45,257 45,954 697
Net financial expense (94) (100) (6.4)
Net current financial debt 353 (65) (418)
PRE-TAX PROFIT 798 618 (22.6) Net non-current financial debt 6,407 7,338 931
Income taxes (26) (64) (146.2) Net financial debt 6,760 7,273 513
PROFIT FROM CONTINUING OPERATIONS 772 554 (28.2) Equity 38,497 38,681 184
Loss from assets held for sale, net of taxes (2)
PROFIT FOR THE YEAR 772 552 (28.5) COVERAGE 45,257 45,954 697
33FY 2017 Consolidated Financial Statements
Statements of Cash Flows
€ mn 2016 2017
Profit for the year 772 552
Amortisation and depreciation 1,306 1,378
Share of losses of equity-accounted investees (14) (14)
Accruals to provisions and impairment losses 116 263
Losses on sales (36) (74)
Change in inventories (54) (105)
Change in trade receivables 631 (149)
Change in trade payables (175) 225
Change in current and deferred taxes (4) 46
Change in other liabilities (1,826) 377
Change in other assets 896 (1,082)
Utilisation of the provisions for risks and charges (121) (203)
Payment of employee benefits (95) (145)
Net cash flows generated by operating activities 1,395 1,069
Increases in property, plant and equipment (5,599) (5,306)
Investment property (12) (6)
Increases in intangible assets (135) (196)
Increases in equity investments (154) (131)
Investments, before grants (5,899) (5,639)
Grants for property, plant and equipment 4,280 4,300
Grants for investment property
Grants for intangible assets 6
Grants for equity investments 128 95
Grants 4,414 4,395
Decreases in property, plant and equipment 291 131
Decreases in investment property 11 17
Decreases in intangible assets 2
Decreases in equity investments and profit-sharing arrangements
4 10
Decreases 308 159
Net cash flows used in investing activities (1,177) (1,085)
Disbursement and repayment of non-current loans (596) 667
Disbursement and repayment of current loans 1,098 (1,091)
Change in financial assets 445 456
Change in financial liabilities (107) (72)
Dividends (46) (300)
Changes in equity 20 (146)
Net cash flows generated by (used in) financing activities
815 (486)
Total cash flows 1,032 (503)
Opening cash and cash equivalents 1,305 2,337
Closing cash and cash equivalents 2,337 1,834 34Key Strenghts
BUSINESS AND CREDIT SUSTAINABILITY
Integrated Mobility Operator Strong commitment for a sustainable integrated
mobility
Sole concessionaire of the rail network until 2060
Promote modal shift to rail
Regulated Infrastructure business
Strong sustainability governance
Market leading positions in all passenger rail transport
services in Italy Compliant with international standard
Business diversification (product\geographical) Environmental Management System for the whole
Group
Track record of resilient performance
Sustainability KPIs improving over time
High technical barriers to entry and capital requirements
Eligible Green Projects strongly contribute to
increased sustainability and energy efficiency of
FS operations
Effective and disciplined financial management
35Contacts:
Stefano Pierini – Head of Finance, Investor Relations and Real Estate
Tel.+39 06 44102348
Mail: s.pierini@fsitaliane.it
Vittoria Iezzi – Head of Debt Capital Market
Tel. +39 06 44106655
Mail: v.iezzi@fsitaliane.it
Lorenza Di Cintio – Debt Capital Market
Tel. +39 06 44103772
Mail: l.dicintio@fsitaliane.it
http://www.fsitaliane.it/fsi-en/Investor-Relations
https://www.fsitaliane.it/content/fsitaliane/it/investor-relations/debito-e-credit-rating.html
36You can also read