The Open Waste Management Journal - Bentham Open
←
→
Page content transcription
If your browser does not render page correctly, please read the page content below
1876-4002/20                                                                                     Send Orders for Reprints to reprints@benthamscience.net

14

                               The Open Waste Management Journal
                                            Content list available at: https://openwastemanagementjournal.com

RESEARCH ARTICLE

Consumers’ Perceptions on Plastic Bags Tax Levy in Peri-urban Areas of
Eswatini: A Case of Kwaluseni and Logoba Chiefdoms
M. M. Mavuso1 and S. S. Singwane1,*
1
 Department of Geography, Environmental Science and Planning, Private Bag 4, University of Eswatini, Kwaluseni, Eswatini

    Abstract:
    Introduction:
    This study focused on assessing the perceptions of consumers on plastic bags tax levy in peri-urban areas of Eswatini, using Kwaluseni and
    Logoba chiefdoms as case studies.

    Methods:
    The areas of key focus include knowledge of and attitudes of consumers towards plastic bags pollution, strategies employed by consumers to
    manage plastic bags, consumers’ willingness to pay for plastic bags and what Eswatini Environment Authority has done so far in controlling plastic
    bags pollution.

    Results:
    A total of 165 households, (99 from Kwaluseni and 66 from Logoba) were conveniently sampled and interviewed with the aid of a questionnaire.
    Community leaders and an environmental inspector from Eswatini Environment Authority were also interviewed. The findings show that the use of
    plastic bags is increasing in both chiefdoms (92.93% at Kwaluseni and 92.42% at Logoba). Concerning what respondents do with the plastics bags
    after ferrying their goods home, 25% at Kwaluseni and 19% at Logoba of the respondents claimed to reuse some bags and throw away the rest.

    Conclusion:
    With regard to willingness to pay, the findings indicate that 49.70% of the respondents are willing to buy plastic bags.

    Keywords: Consumers’ perceptions, Eswatini, Kwaluseni, Logoba, Peri-urban areas, Plastic bags, Tax levy.

      Article History          Received: November 11, 2019                   Revised: February 10, 2020              Accepted: February 15, 2020

1. INTRODUCTION                                                                    petrochemical sources. Therefore, the problem with single-use
                                                                                   disposable plastic bags is the pollution of the environment.
    Plastics were first invented in the 1860s but developed for
                                                                                   Miller [4] states that the low cost of plastic bags has led to their
industries in the 1920s, and then became one of the fastest-
                                                                                   wasteful consumption and disposal particularly in developing
growing global industries in the 1970s due to huge popularity
                                                                                   countries, hence environmental pollution. For instance,
among consumers [1]. Plastic bags are available in huge
                                                                                   according to Madigele et al. [5], the management of plastic
numbers and varieties across the world. No accurate statistics
have been made on the total number of plastic bags produced
                                                                                   waste continues to be a major challenge throughout the world
so far, but today about a trillion plastic bags are being                          particularly in developing countries.
nonchalantly used worldwide every year [2]. Plastic shopping                           According to Dikgang and Visser [6], as with many other
bags are widely used for transporting goods all over the world                     pollution issues in Africa, the plastic bag problem is rooted in
due to their functionality, strength, and low cost [3] Notably,                    widespread poverty, corruption, environmental injustice, and
approximately half of the plastic bags manufactured worldwide                      residues of colonialism. Plastic bags pollution is both unsightly
are used as single-use disposable consumer items made from                         and a hazard to the environment particularly wildlife and
                                                                                   livestock. Plastic bags can block storm drains and sewage sys-
* Address correspondence to this author at the Department of Geography,
Environmental Science and Planning, Private Bag 4, University of Eswatini,         tems, leading to flooding and increase the spread of diseases.
Kwaluseni, Eswatini; Tel: +268 2517 0253; Email: saicos@uniswa.sz                  For instance, water trapped in the plastic bags provides an ideal

                                                      DOI: 10.2174/1876400201912010014, 2020, 13, 14-25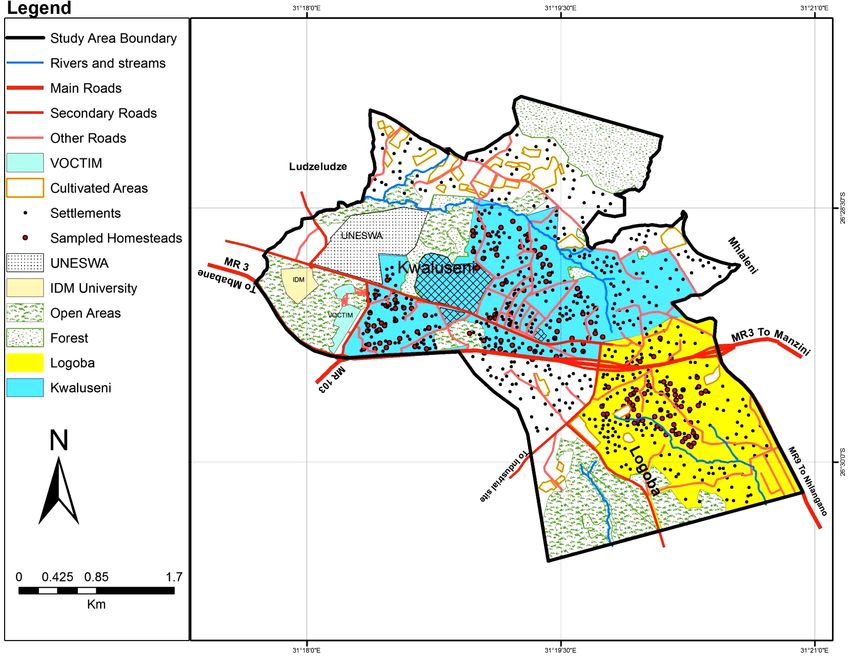
Consumers’ Perceptions The Open Waste Management Journal, 2020, Volume 13 15
breeding ground for mosquitoes, raising the risk of malaria was introduced in 2015 by the Eswatini Environment Authority
transmission. (EEA) namely the Environment Management Act, Control of
Plastics Bags Regulation Notice of 2015. The act proposed a
Noteworthy is that a majority of plastic bags are not
35 cent charge for every plastic bag handed out to the
biodegradable, and for that reason, they are disruptive on
consumers.
agricultural development. For instance, they take an incredibly
long time to break down and when they do, it is in the form of The production and consumption of plastics bags in the
powdery plastic dust which contaminates all life forms country have continued to rise. In a study conducted by
including the soil and the water forever [7]. Despite being very Dlamini et al. [12], on the production and consumption of
thin, plastic bags inhibit the roots of crops to pierce them in plastics bags in Eswatini, it transpired that the average number
order to move around the soil for natural nutrients. In of single-use plastics bags issued out for free by large
consequence, plastic bags have caused tremendous harm to the franchises in the country namely Boxer, Shoprite, Spar and
growth of agricultural products [8]. On the other hand, plastic Super Spar Stores is about 1 790 000 plastic bags per month.
bags also fill ditches on roadsides, rest on public waterways, In Eswatini, there has been no other regulation or
rivers and oceans. An example can be Cape Town, South intervention that has been brought forward to control the use of
Africa, where there were more than 3000 plastic grocery bags plastic bags which are a problem to the environment. A way of
at a certain time that covered each kilometer of the road [9]. In controlling pollution emanating from issuing plastic bags free
addition to these effects of plastic bags pollution, rivers are of charge needs to be put forth. Thus, there is a need to assess
shrinking and floodplains are choked with hundreds of plastic consumers’ perceptions of the plastic bags tax levy in the
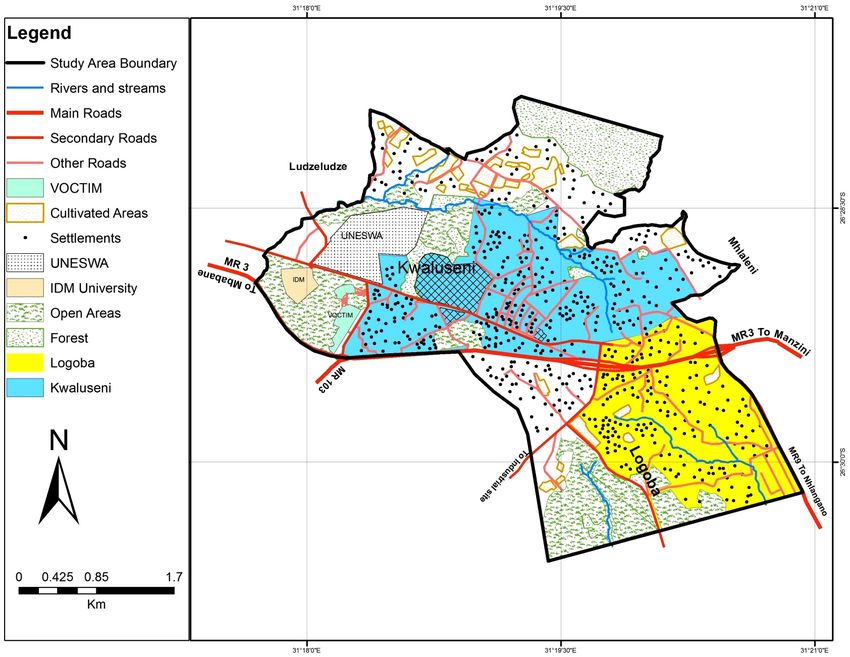
bags waste. Plastic bags pollution not only affects agriculture Kingdom of Eswatini using Kwaluseni and Logoba Chiefdoms
but also tourism, which is pivotal in the economic growth of (Fig. 1) as case studies. These chiefdoms are found under the
many countries including the Kingdom of Eswatini. jurisdiction of Kwaluseni Constituency (Fig. 1). According to
In response to plastic bags pollution, a number of Dlamini et al. [13], Kwaluseni Constituency is the leading
regulatory instruments have been used worldwide to reduce the waste producer in the country with an average of about 19,
plastic bag problem, ranging from traditional command and 685.6 tonnes per year. Kwaluseni Constituency produces
control approaches such as bans, voluntary codes of practice domestic and industrial waste which mainly comprises plastics
and marketing of alternative bags, to economic tools such as bags.
taxes or levies [10]. The issue of plastic pollution which is Plastic bags are non-biodegradable and most of them end
mostly a result of single-use plastic bags has triggered up in the dust bins immediately after use. Stevens [7], stresses
developed countries to formulate plastic bags tax levies in an the point that a majority of plastic bags are resistant to
effort to regulate the issuing of plastic bags. degradation under the influence of the sun and/or microor-
The plastic bag tax levy is a popular tax in Europe [11]. ganisms and can persist in the environment for thousands of
According to Dikgang and Visser [8] one of the most years, facilitating continuous exposure to ingredients in plastics
and increasing the risk of their accumulation, which increases
successful countries in implementing the plastic bag tax levy
the risk of their harmful effects to appear. Noteworthy is that
policy is Ireland, where it was applied in 2002 and
the Matsapha Industrial site has greatly influenced the
consequently plastic bag pollution has been significantly
settlement pattern of Kwaluseni and Logoba chiefdoms. The
reduced. The Irish government presented a 15 Euro cent
housing demand that came with the establishment of the
(E1.50) per plastic bag which was previously provided free of
industrial site induced Kwaluseni Constituency, and the sur-
charge to customers at points of sale, aimed at changing
rounding areas, to provide accommodation albeit in an unplan-
customer behavior. This tax resulted in a dramatic reduction of
ned fashion (Fig. 2). These unplanned settlements are one of
plastic bags usage in retail shops by 94% and led to a reduction
the leading producers of plastic bag waste and pollution (Fig.
in the amount of plastic litter [11]. In South Africa, a similar
3), hence the need for the study at Kwaluseni and Logoba
levy was introduced in 2003, although not as successful as it
chiefdoms.
was in Ireland [8].
The aim of the study was to assess the perceptions of
Governments around the world are increasingly awake to
consumers on the plastic bags tax levy in peri-urban areas of
the scale of plastic pollution in general as well as plastic bags
Eswatini, using Kwaluseni and Logoba chiefdoms as case
pollution in particular. Consequently, more than 60 countries
studies.
have introduced bans and levies to curb single-use plastic
waste [3]. Noteworthy is that plastic bag bans and levies, if The objectives of the study are:
properly planned and enforced, can effectively counter one of
the causes of plastic overuse. For instance, several campaigns To assess the knowledge and attitude of consumers
have been launched in the Kingdom of Eswatini to reduce the towards plastic bag pollution.
excessive plastic bags consumption, protect the ecosystem, and To investigate strategies used by consumers to manage
stimulate consumer behavioral changes. Some of these plastic bags.
campaigns failed and regulations were dropped due to the To assess consumers’ willingness to pay for plastic
opposition from commerce and industry, as well as defiance bags.
and protest from retails, groceries and plastic industry. One of To investigate what is being done by EEA towards
the campaigns which failed was the plastic bag tax policy that controlling plastic bags pollution.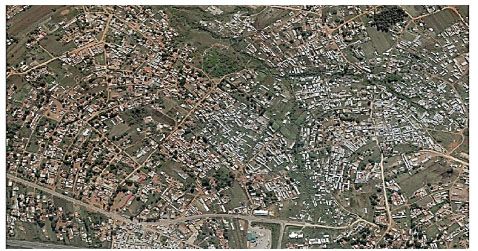
16 The Open Waste Management Journal, 2020, Volume 13                        Mavuso and Singwane

Fig. (1). Kwaluseni Inkhundla showing Kwaluseni area and Logoba chiefdoms.

Fig. (2). A section of unplanned settlements at Kwaluseni Inkhundla.
Consumers’ Perceptions                                                          The Open Waste Management Journal, 2020, Volume 13 17

Fig. (3). Plastic bags in a stream at Kwaluseni area.

2. MATERIALS AND METHODS                                          were also mapped using a Global Positioning System (GPS)
                                                                  (Fig. 4). Notably, in the event that the head of the household
2.1. Sources of Information                                       was not around, the respondent was an individual above the
                                                                  age of 18.
    The target population in the study included heads of
households, local community authorities at Kwaluseni and          2.2. Data collection
Logoba chiefdoms and an officer from the Eswatini                     In-depth face to face interviews guided by questionnaires
Environment Authority. Since most of the settlements were         were administered to heads of households (Supp. Appendix
unplanned and could not be covered all at the given time frame,   A), community authorities (Supp. Appendix B) and the EEA
convenient sampling was adopted by the study. Convenient          officer (Supp. Appendix C). The data collected were coded
sampling according to Creswell et al. [14], refers to the         and inputted in the Statistical Package for Social Sciences
situation where population elements are selected based on the     (SPSS) version 20 for analysis. The data was summarized and
fact that they are easily and conveniently available. The study   presented in the form of narratives, tables and charts. The data
had a sampling frame of 1 650 homesteads, where 987 were          were analyzed using cross-tabulation of variables after
from Kwaluseni and 663 from Logoba. Due to homogeneity of         calculating frequencies for the relevant variables of the study.
the population (they are all plastic bag consumers); a sample
size of 10% was extracted from each of the two communities.       3. RESULTS
To arrive at 10%, a sample size calculator was used where a           The findings indicate that out of the 165 respondents,
confidence level of 95% and confidence intervals of 9.35 at       50.9% were males and 49.1% were females. Notably, a
Kwaluseni chiefdom and 11.46 at Logoba chiefdom were              majority of the respondents from Kwaluseni chiefdom were
chosen. Therefore, Kwaluseni chiefdom was represented by 99       males (53.54%) with females constituting 46.46%, whereas at
homesteads and Logoba chiefdom by 66 homesteads thus              Logoba there were more females (53.03%) than males
having a sample of 165 homesteads. Then within a homestead,       (46.97%). With regard to the age of the respondents, the most
one head of the household was interviewed regardless of the       dominant age group in both chiefdoms was 30-39 (Kwaluseni
number of households in each homestead. Sampled homesteads        42.42% and Logoba 39.39%) (Fig. 5).
18 The Open Waste Management Journal, 2020, Volume 13 Mavuso and Singwane
Fig. (4). Sampled homesteads at Kwaluseni and Logoba chiefdoms.
45 42.42
39.39
40
35 30.3 28.79
Percentage
30
25 19.7
20
14.14
15
10 8.08 5.05
4.55 6.06
5 0 1.52
0
20-29 30-39 40-49 50-59 60-69 70+
Age Group
Kwaluseni Logoba
Fig. (5). Age of respondents at Kwaluseni and Logoba chiefdoms.Consumers’ Perceptions The Open Waste Management Journal, 2020, Volume 13 19
The second and third dominant age groups were 20-29 and bag pollution
40-49 (Fig. 5). Correspondingly, this is expected since the two A majority of the respondents claim to use plastic bags
chiefdoms are close to the Matsapha Industrial site which is when going shopping (96.9% from Kwaluseni and 98.5% from
perceived to avail job opportunities. However, when cross Logoba). The findings indicate that among the respondents
tabulating age and occupation status of the economically active who use plastic bags when shopping, 83.23% always use them,
group to ascertain the socio-economic status of the respondents 10.56% use plastic bags often and 6.21% sometimes use plastic
in the two chiefdoms, the findings depict that 30% were bags. Notably, a majority (52%) of those who use plastic bags
unemployed, 32% self-employed and only 38% were employed when shopping are males at Kwaluseni chiefdom. Contrary, at
(Table 1). Logoba chiefdom, more females (52%) use plastic bags when
Regarding education level, 3.03% of the respondents from shopping than males.
Kwaluseni chiefdom and 12.12% from Logoba chiefdom were To assess whether education level has an influence on the
not educated (Fig. 6). The dominant highest level of education usage of plastic bags when going shopping, cross-tabulation
attained was High school (Kwaluseni 45.45% and Logoba was done. From the cross-tabulation, it transpired that the level
48.48%) followed by tertiary (Kwaluseni 42.42% and Logoba of education does not have an influence on the usage of plastic
27.2.7%) (Fig. 6). This is justified considering that the bags when going shopping (Fig. 7). For instance, the findings
University of Eswatini is located within the Kwaluseni show that those with high school education (37.50% from
chiefdom; hence more respondents with tertiary education. Kwaluseni and 41.54% from Logoba) are the leading group in
terms of usage of plastic bags when shopping followed by
3.1. Knowledge and attitudes of consumers towards plastic those with tertiary education in both the locations (Fig. 7).
Table 1. Age and occupation status of respondents at Kwaluseni and Logoba chiefdoms
Unemployed Self Employed Employed Total
Age Group
Frequency % Frequency % Frequency % Frequency %
20-29 24 15.48 8 5.16 11 7.10 43 27.74
30-39 18 11.61 24 15.48 26 16.77 68 43.87
40-49 3 1.94 13 8.39 17 10.97 33 21.29
50-59 2 1.29 4 2.58 5 3.23 11 7.10
Total 47 30 49 32 59 38 155 100
60
48.48
50 45.45
42.42
Percentage
40
27.27
30
20 12.12 12.12
9.09
10 3.03
0
Primary High School Tertiary Not Educated
Education Education Education
Education Level
Kwaluseni Logoba
Fig. (6). Education level of respondents in Kwaluseni and Logoba chiefdoms.20 The Open Waste Management Journal, 2020, Volume 13 Mavuso and Singwane
45 41.54
40 37.50
35 31.25
Percentage
30 24.62
25
20
12.31
15 7.29 9.23
8.33 7.29
10 3.13 1.54 1.54 6.15
3.13 2.08
5 0 0 0 0 0 1.54 0 0 1.54
0
Always Often Sometimes Always Often Sometimes
Kwaluseni Logoba
Frequency
Primary Education High School Education Tertiary Education Not Educated
Fig. (7). Education level and frequency of plastic bag usage at Kwaluseni and Logoba.
Not necessary 9.09
7.25
Discontinued
Harmful to the environment 24.24
27.54
Cause Pollution 60.61
47.83
Not biodegradable 6.06
17.39
Some are employed in the plastic firms 0
6.67
Continued
Handicrafts 0
6.67
Lack of alternatives 3.03
6.67
Convenient 96.97
80.00
0 10 20 30 40 50 60 70 80 90 100
Percentage
Logoba Kwaluseni
Fig. (8). Reasons for continuing and discontinuing the use of plastic bags in both chiefdoms.
In both chiefdoms, respondents were of the view that usage Logoba). In addition, the usage of plastic bags in the chiefdoms
of plastic bags is increasing (92.93% at Kwaluseni and 92.42% is promoted by their being light in weight. This therefore,
at Logoba). The respondents’ reason for the increase in the use indicates that if plastic bags may be made available at a cost,
of plastic bags is mainly because plastic bags are easily or there might be a decline in their usage.
freely available (34.42% at Kwaluseni and 19.48% at Logoba). A majority of the respondents both from Kwaluseni (80%)
Another reason for the increase in the use of plastic bags is the and Logoba (96.97%) chiefdoms were of the view that plastic
lack of alternatives (14.29% at Kwaluseni and 12.99% at bags usage should be continued because of its convenienceConsumers’ Perceptions The Open Waste Management Journal, 2020, Volume 13 21
(Fig. 8). Another reason given for continuing with the use of informing consumers on environmental issues. In both the
plastic bags is the lack of alternatives (Kwaluseni (6.67%) and chiefdoms, the media is the leading source of environmental
Logoba (3.03%). Moreover, respondents from Kwaluseni information (44.44% at Kwaluseni and 28.79% at Logoba)
chiefdom (6.67%) advocated for the continuation of plastic Table 2 . Other respondents indicated that they use their own
bags usage because these are used by self-employed people to experience as sources of knowledge (32.32% at Kwaluseni and
make handicrafts for sale (Fig. 8). 19.70% Logoba) (Table 2).
On the other hand, other respondents advocated for In terms of how plastic bags harm the environment, the
discontinuation of plastic bags usage. One of the reasons for
findings reflect that one way is through pollution (42%) (Fig.
discontinuing plastic bags usage was because they cause
pollution (47.83% at Kwaluseni and 60.61% at Logoba) (Fig. 9). The findings also depict that plastic bags release toxic sub-
8). Another reason for discontinuing plastic bags usage was stances (17%) that cause a threat to the soil and micro-
because the respondents from Kwaluseni (24.24%) and from organisms in the soil (Fig. 9). In addition, 15% of the respon-
Logoba (27.54%) chiefdoms viewed plastic bags as harmful to dents stated that plastic bags are a threat to vegetation growth
the environment (Fig. 8). This is justified because plastic bags more especially grass and 13% of the respondents claimed that
take an incredibly long time to break down and when they do,
plastic bags when indiscriminately disposed of may also lead to
they release toxic substances that contaminate all life forms
including the soil and water. Correspondingly, 17.39% of the
clogging of drainage systems like road drainages (Fig. 9).
respondents from Kwaluseni and 6.06% from Logoba reported Notably, the findings show that the respondents know about the
that they advocate for a discontinuation of plastic bags usage problems caused by plastic bags on the environment more
because they are not biodegradable (Fig. 8). especially if they are not well managed. In contrast, 13% of the
Regarding sources of information on environmental issues, respondents claimed that plastic bags do not bring any harm to
the findings depict that the media plays a vital role in the environment (Fig. 9).
Table 2. Sources of knowledge on environmental issues.
Kwaluseni Logoba Total
Source of Knowledge
Frequency % Frequency % Frequency %
Own experience 32 32.32 13 19.7 45 27.27
Friends/Family 4 4.04 8 12.12 12 7.27
School/Tertiary 17 17.17 13 19.7 30 18.18
Media 44 44.44 19 28.79 63 38.18
All of the above 2 2.02 1 1.52 3 1.82
None 0 0 12 18.18 12 7.27
Total 99 100 66 100 165 100
50 42
40
Percentage
30
20 13 17 15 13
10
0
Pollution Clog drainage Release toxic Threath to They do not
systems sustances vegetation
Harm
Fig. (9). Harm to the environment by plastic bags in both chiefdoms.22 The Open Waste Management Journal, 2020, Volume 13 Mavuso and Singwane
Fig. (10). A full waste bin near houses at Kwaluseni chiefdom.
Fig. (11). Waste disposed in an open space at Logoba chiefdom.
With regard to areas seriously polluted by plastic bags, the 11). The findings indicate that there are problems with the way
findings depict that at Kwaluseni chiefdom; they are market consumers manage their plastic bags.
places (23.23%), followed by residential backyards (22.22%)
(Table 3) (Fig. 10). Furthermore, 20.20% of the respondents 3.2. Plastic bags waste reduction strategies
stated that open spaces are also seriously polluted by plastic The findings reflect that some consumers are already using
bags and 15.15% claimed roadsides are also seriously polluted reusable shopping bags (62.61% at Kwaluseni and 40.91% at
(Table 3). On the other hand, at Logoba chiefdom the seriously Logoba). However, respondents do not always use reusable
polluted areas include roadsides (22.73%), open areas shopping bags. Notably, in both chiefdoms, 10.23% of the
(22.73%) and residential backyards (18.18%) (Table 3) (Fig. respondents claim to always use reusable bags when shopping,Consumers’ Perceptions The Open Waste Management Journal, 2020, Volume 13 23
29.55% claim to use reusable shopping bags often and 60.23% sometimes full and it takes some time to be emptied (Fig. 10).
sometimes use reusable shopping bags when shopping. This, in Normally, the waste in the homesteads is collected by a tractor
turn, reflects that only a few individuals consistently contribute donated by Eswatini Environment Authority (EEA) to the
to the reduction of plastic bags waste through the usage of Kwaluseni Inkhundla and it services both chiefdoms. Notably,
reusable bags, thus there will be a slight decline in plastic bags it takes some time for the waste bins to be serviced because
waste or no decline at all. some homesteads are not easily accessible by road due to the
It is obvious that at the end of their short service life, nature of the settlement patterns (being unplanned) in the two
plastic bags become wastes. Therefore, it was imperative to chiefdoms.
assess how consumers dispose of plastic bag wastes in the two
chiefdoms. For instance, it transpired that 25% of the respon- 3.3. Willingness to Pay
dents at Kwaluseni and 19% at Logoba claimed to reuse some The findings indicate that 51.70% of the respondents from
plastic bags and throw away others (Fig. 12). Notably, Kwal- both chiefdoms support the trend of selling plastic bags to
useni chiefdom had a higher percentage of plastic bags consumers in the shops and they believe that the charge can
consumers (12.0%) who ‘use and throw away’ all plastic bags reduce plastic bags pollution. Moreover, 26.67% of the
while Logoba chiefdom had only 4%. This practice (‘use and respondents voiced out that they would oppose the trend of
throw away’) is particularly attributed to the availability of selling plastic bags and 21.66% said they are really unsure. In
plastic bags free of charge in large quantities to the consumers. both chiefdoms, most of the respondents were willing to buy
Other than ‘use and throw away’, respondents also burned each plastic bag only at E0.50 (29% at Kwaluseni and 19% at
plastic bags (9.1% at Kwaluseni and 9.1% at Logoba) as a way Logoba) (Fig. 13). Noteworthy is that those who were not
to dispose them of (Fig. 12). willing to buy the plastic bags suggested some other ways in
Noteworthy is that, consumers face a number of challenges which plastic bags could have been reduced. For instance,
when disposing of plastic bags. For instance, 31.5% of the 31.68% of the respondents in both chiefdoms suggested that
respondents from both chiefdoms indicated that the waste bin plastic bags should be completely banned in the country,
was far from their houses (Table 4). Another problem faced by whereas 26.67% suggested that plastic bag usage can be
the consumers is the issue of no waste bins in the homesteads voluntarily reduced by consumers through behavior change.
(32.3% at Kwaluseni and 34.8% at Logoba) (Table 4). In such Furthermore, 25% of the respondents in both chiefdoms
cases, respondents had no choice but to dispose of their wastes suggested environmentally friendly methods of carrying goods
on empty spaces near their houses (Fig. 10). Furthermore, like paper bags, while 16.67% emphasized on increasing
9.09% of the respondents at Kwaluseni and 16.7% at Logoba awareness on the problems caused by plastic bags on the
(Table 4) pointed out that in some instances, the waste bin is environment.
Table 3. Seriously polluted areas at Kwaluseni and Logoba chiefdoms.
Kwaluseni Logoba
Polluted Areas
Frequency % Frequency %
Open spaces 20 20.20 15 22.73
Market places 23 23.23 6 9.09
Roadsides 15 15.15 15 22.73
Residential backyards 22 22.22 12 18.18
Rivers 2 2.02 5 7.58
Everywhere 14 14.14 7 10.61
None 3 3.03 6 9.09
Total 99 100 66 100
Table 4. Problems faced when disposing of their plastic bags.
Problem Faced Kwaluseni Logoba Total
Frequency % Frequency % Frequency %
Waste bin is far 27 27.3 25 37.9 52 31.5
No waste bin in the area 32 32.3 23 34.8 55 33.3
Waste bin is not accessible 9 9.09 11 16.7 20 12.1
At time full 16 16.2 6 9.09 22 13.3
No problem 15 15.2 1 1.52 16 9.7
Total 99 100 66 100 165 10024 The Open Waste Management Journal, 2020, Volume 13 Mavuso and Singwane
30 25
25
19
Percentage
20
15 12
9.1 9.1
10 7.3
4 4.2 4.8
5 0.6 1.2 0.6 0.6 1.2 1.2 0
0
Throw the Reuse some Reuse all of I sell them Make Burn them Dustbine Dont use
away and throw them handicrafts lining plastic bags
some away
Kwaluseni
Fig. (12). Method of disposing plastic bags after carrying groceries home in both chiefdoms.
30 28.57
19.05
Percentage
20
12.38
10.48
10 7.62 6.67
4.76
1.90 1.90 2.86 0.95
0.95 0.95 0 0.95
0
0
E0.20 E0.50 E0.70 E1.00 E1.50 E2.00 E3.00 E5.00
Amount
Fig. (13). Harm to the environment by plastic bags in both chiefdoms.
3.3.1. Foreseeable impacts of the plastic bags tax levy Furthermore, 19.4% of the respondents pointed out that those
In general, it is known that everything has positive and who will afford to buy plastic bags will continue to cause
negative impacts hence the plastic bag tax levy. Respondents pollution through their indiscriminate disposal of waste. It also
pointed out that there are both positive and negative impacts of transpired that 2.4% of the respondents feared for job losses in
the plastic bags tax levy. From the findings, it was observed the plastic bags manufacturing firms since the firms would be
that 65.5% of the respondents in both chiefdoms anticipated making fewer sales when consumers are to buy plastic bags in
that the plastic bag tax levy will help in the reduction of plastic the shops. Contrary to this, 23.4% of the respondents indicated
bag usage. Consequently, plastic bags pollution will be reduced that they foresee no negative impact of the plastic bag tax levy.
since the usage of plastic bags will also be minimized.
Respondents also voiced out that buying plastic bags will help 3.4. Views of Key Informants on the Plastic Bag Tax Levy
raise environmental awareness and thus promote the usage of
reusable shopping bags instead of plastics bags (18.1%). In 3.4.1. Community authorities
contrast, 16.4% of the respondents indicated that the plastic Plastic bag usage in both chiefdoms is viewed to be
bag tax levy will have no positive impact. increasing and this increase is instigated by some reasons.
With regard to the anticipated negative impacts, According to the community authorities, the increased usage of
respondents (33.9%) pointed out that the plastic bag tax levy plastic bags is due to the fact that they are available for free in
will add an extra cost to their living. Moreover, 20.9% of the large quantities. It was also found that there is a low level of
respondents from both chiefdoms stated that buying plastic awareness on the problems caused by plastic bags on the
bags will create an inconvenience in their shopping experience. environment among the community members. Moreover, sinceConsumers’ Perceptions The Open Waste Management Journal, 2020, Volume 13 25
plastic bags are light in weight, it is, therefore, more promulgation. The EEA anticipates that through the plastic bag
convenient to use them when carrying groceries and moving regulation, it will be ensured that plastic bags introduced into
around. the country are those that are recyclable. Also, the issuance of
plastic bags from shops will be reduced since people would be
According to the community leaders in both chiefdoms,
reusing them. However, the legislation is anticipated to have
plastic bags waste is a menace. Community members do not
minimal effect on the motivation of highly affluent people’s
dispose of their waste plastic bags in rightful places. It was
usage of plastic bags.
pointed out that some of the compounds/ homesteads do not
have proper areas where waste is disposed and in cases where
4. DISCUSSION
there are, it takes some time to service them since they are
inaccessible. In mitigating the problems of plastic bags waste This section discusses the findings of the study on the
management, the community leaders try to educate the perceptions of consumers in peri-urban areas on the plastic tax
community members on proper waste management strategies levy, using Kwaluseni and Logoba chiefdoms as case studies.
and even invite speakers from Eswatini Environment Authority
(EEA) to also raise awareness among community members. In 4.1. Consumers’ Perceptions
some instances, the communities embark on clean up The findings of the study revealed that plastic bags
campaigns with the assistance of EEA, Matsapha Town Board utilization is increasing in both the chiefdoms (92.93% at
and at times with students from the University of Eswatini Kwaluseni and 92.42% at Logoba). It was found out that the
(UNESWA), as well as pupils from surrounding schools availability of plastic bags free of charge was the main reason
namely; Swazi National High School, Phumelele High School, for the increase in plastic bags usage in both chiefdoms. The
Kwaluseni Primary and Kwaluseni Infant Primary School. findings are corroborated by Hammami et al. [15], who also
Community leaders from both chiefdoms indicated that figured out that increasing plastic bag pollution was a result of
they were much aware of the proposed Control of Plastic plastic bags being highly available at a low cost or not at all.
Regulation of 2015 and were happy about it. They, however, With regard to willingness to pay, the study observed that
pointed out that not all community members are happy about it. the consumers were willing to pay. However, the consumers
This is because they feared that the regulation will hit hard on noted that paying for plastic bags would also impact negatively
their standard of living. Also, some of the community members on them. For instance, they anticipated that they may not afford
from chiefdoms were employed by the plastic bags to pay for the plastic bags which in turn may interfere with
manufacturing industries and they feared for their job security. their standard of living. The results of the study are in
agreement with those of Raje et al. [16], who observed that
3.4.2. Eswatini Environment Authority
consumers in the low-income settlements normally express
The Eswatini Environment Authority (EEA) also noted their inability to pay more due to a continuous increase in the
with concern the rapid increase in plastic bags usage. The EEA price of other basic amenities like food, shelter and clothing.
pointed out that the growing population, especially in the urban
and peri-urban areas, significantly leads to an increase in the 4.2. The Plastic Bag Tax Levy
usage of plastic bags. Also, an increase in affluence of the local The findings indicated that the plastic bag tax levy in the
population contributes to an increase in the usage of plastic country is still a bill, awaiting parliamentary approval as
bags since people afford to buy groceries in large quantities reported by an officer from the Eswatini Environment
thus requiring a large quantity of plastic bags to transport their Authority. Whilst the bill is still waiting for parliamentary
grocery home. The diversification of commodities especially approval, there are other legislations used to control the
those that need to be packed before they are sold also disposal of plastic bags. These include the Litter Regulations of
contribute to the increase in plastic bags usage. 2011, Waste Regulations of 2010 and the Environmental
A notable number of problems in the usage of plastic bags Management Act No. 5 of 2002. However, these legislations do
have been identified. The environmental inspector pointed out not directly address the utilization of plastic bags, since they
that currently, the country has no comprehensive recollection were not crafted to control plastic bags usage in the country but
mechanism for used plastic bags; hence they end up in the rather proper waste management. Therefore, this means that
environment either as solid waste or contribute to air pollution controlling plastic bags usage is still a challenge in the country.
when they are burnt. Furthermore, even the proportion that is As such, there are more problems resulting in the continuous
recollected ends up mostly in landfills due to the inadequacy of availability of plastic bags for free.
recycling initiatives. In addition, the EEA noticed that some of
Based on the findings of the study, it is evident there is a
the uncollected plastic bags end up clogging streams and some
need for alternatives to plastic bags since the tax levy has not
are consumed by livestock.
yet been effective in the Kingdom of Eswatini. Notably, the
It is also transpired that the EEA once piloted a regulation alternatives must be those which are environmentally friendly
to control the usage of plastic bags in the country. However, such as jute bags, paper bags, bio-degradable bags and reusable
the legislation did not come into force and it is still a draft bags [8]. In particular, Jalil et al. [8], argue that jute bags are
pending parliamentary approval. With regard to the overall recommended as an environment-friendly substitute to plastic
reception of the regulation by consumers, the EEA discovered bags because they are made from a biodegradable material,
that a larger proportion of the population in the country felt that which is derived from a plant fiber called jute, mostly
the regulation was long overdue and was looking forward to its comprising cellulose. Regarding paper bags, they are also26 The Open Waste Management Journal, 2020, Volume 13 Mavuso and Singwane
recommended as an environment-friendly substitute to plastic REFERENCES
bags because the natural fibers of paper and its recyclability
[1] L. Williamson, "It’s not my bag, baby. On earth", Environ politics
produces a positive image of the paper bags as observed by people, vol. 25, no. 2, pp. 32-34, 2003.
Jalil et al. [8]. Furthermore, although considered a probable [2] G. Miller, Sustaining the Earth: An Integrated Approach., Thomson
option, biodegradable plastic bags are not eco-friendly as they Brooks/Cole: Pacific Grove, CA, 2005.
[3] UNEP, The State of Plastics: A Roadmap for Sustainability. India:
contain toxic materials which have harmful effects on the UNEP,
environment as witnessed by Jalil et al. [8]. Finally, there are 2018.https://wedocs.unep.org/bitstream/handle/20.500.11822/25496/si
the reusable bags which include rigid plastic boxes and ngleUsePlastic_sustainability.pdf
[4] G. Miller, Plastic Shopping Bags: An Analysis of Policy Instruments
baskets; thick plastic bags; woven plastic bags; cloth bags; and
for Plastic Bag Reduction., Universiteit Utrecht, 2012.
the oldest market containers, cane woven baskets as discussed [5] P. Madigele, J. Mogomotsi, and M. Kolobe, "Consumer willingness to
by Jalil et al. [8]. Noteworthy is that Jalil et al. [8], contend pay for plastic bags levy and willingness to accept eco-friendly
that reusable bags can cause a lot of environmental toxicities, alternatives in Botswana", Zhongguo Renkou Ziyuan Yu Huanjing, vol.
15, no. 3, pp. 255-261,
particularly to the agricultural sectors and therefore their users 2017.https://www.tandfonline.com/doi/abs/10.1080/10042857.2017.13
must be environmental sentient as well as coupled with a sense 69243 [Accessed 18 August 2018].
of civic-mindedness. [http://dx.doi.org/10.1080/10042857.2017.1369243]
[6] J. Dikgang, and M. Visser, "Behavioral response to plastic bag
legislation in botswana", Environ Develop: Discuss Paper Series,
CONCLUSION 2010.http://efdinitiative.org/sites/default/files/efd-dp-10-13.pdf
[7] E. Stevens, Green Plastics: An Introduction to the New Science of
Based on the findings of the study, it can be concluded that Biodegradable Plastics., Princeton University Press: Princeton, 2002.
a majority of the respondents in both chiefdoms supports the [8] A. Jalil, N. Mian, and M. Rahman, "Using plastic bags and its
plastic bag tax levy and are also willing to pay for the plastic damaging impact on environment and agriculture: an alternative
proposal", Int j. learn Develop, vol. 3, no. 4, pp. 1-14,
bags. However, the amount which most respondents are willing 2013.https://pdfs.semanticscholar.org/8be5/cfe216997121a0f70af177d
to pay for a plastic bag is relatively small (E0.50), which may 92fe0b8fd92f3.pdf [Accessed 20 January 2019].
have a little effect on reducing plastic bag usage among the [http://dx.doi.org/10.5296/ijld.v3i4.4137]
[9] P.G. Ryan, and N. Rice, "The free shopping bag debate: costs and
population. Even though the initiative of the plastic bag tax attitudes", S. Afr. J. Sci., vol. 92, no. 4, pp. 163-164, 1996.
levy is a good move in addressing issues of plastic bags [10] S. Rayne, "The need for reducing plastic shopping bag use and
pollution in the country, a lot still needs to be done to enjoy its disposal in Africa", African j. Environ sci. Techn, vol. Vol. 3,
2008.No. 3, vol. Vol. 3,
benefits. 2008.https://academicjournals.org/journal/AJEST/article-full-text-pdf/
654F8F411421 [Accessed 2 August 2018].
CONSENT FOR PUBLICATION [11] F. Convery, S. McDonnell, and S. Ferrerira, "The most popular tax in
Europe? Lessons from the Irish plastic bags levy", Environ. Resour.
Not applicable. Econ., vol. 38, no. 1, pp. 1-11,
2007.https://ideas.repec.org/a/kap/enreec/v38y2007i1p1-11.html
AVAILABILITY OF DATA AND MATERIALS [Accessed 29 September 2018].
[http://dx.doi.org/10.1007/s10640-006-9059-2]
Not applicable. [12] A. Dlamini, E. Hoden, H. Ryberg, and S.C. Msibi, A survey on the
production and consumption of plastic bags in swaziland., Depart
Environ Assess and Comp, Swaz Environ Auth: Mbabane, Swaziland,
FUNDING 2016.
[13] W.M. Dlamini, M.M. Mathunjwa, S.K. Mkhonta, G.A. Mavimbela,
None. S.D. Mabaso, and I.B. Zuydam, National inventory on open burning
practices and unintentional persistent organic pollutants (upops)
CONFLICT OF INTEREST releases., EswatiniEnvironment Authority, 2017.
[14] J.W. Creswell, L. Ebersohn, I. Eloff, R. Ferreira, N. Ivabkova, J.
The authors declare no conflict of interest, financial or Jansen, and V. Plano Clark, First Steps.Research., 2nd ed Van Schaik
otherwise. Publishers: Pretoria, 2016.
[15] M.B.A. Hammami, E.Q. Mohammed, A.M. Hashem, M.A. Al-Khafaji,
F. Alqahtani, S. Alzaabi, and N. Dash, "Survey on awareness and
ACKNOWLEDGEMENTS attitudes of secondary school students regarding plastic pollution:
implications for environmental education and public health in Sharjah
The authors would like to express their appreciation to the city, UAE", Environ. Sci. Pollut. Res. Int., vol. 24, no. 25, pp.
community leaders and members of Kwaluseni and Logoba 20626-20633, 2017.https://www.ncbi.nlm.nih.gov/pubmed/28712081
chiefdoms as well as the Eswatini Environment Authority for [Accessed 10 January 2019].
[http://dx.doi.org/10.1007/s11356-017-9625-x] [PMID: 28712081]
cooperating during the survey. [16] D. Raje, P. Dhobe, and A. Deshpande, "Consumer’s willingness to pay
more for municipal supplied water: a case study", Ecol. Econ., vol. 42,
SUPPLEMENTARY MATERIAL no. 3, pp. 391-400,
2002.https://ideas.repec.org/a/eee/ecolec/v42y2002i3p391-400.html
Supplementary material is available on the publishers web [Accessed 12 August 2018].
site along with the published article. [http://dx.doi.org/10.1016/S0921-8009(02)00054-X]
© 2020 Singwane et al.
This is an open access article distributed under the terms of the Creative Commons Attribution 4.0 International Public License (CC-BY 4.0), a copy of which is
available at: (https://creativecommons.org/licenses/by/4.0/legalcode). This license permits unrestricted use, distribution, and reproduction in any medium, provided
the original author and source are credited.You can also read