Rapid and Quantitative Determination of Sildenafil in Cocktail Based on Surface Enhanced Raman Spectroscopy - MDPI
←
→
Page content transcription
If your browser does not render page correctly, please read the page content below
molecules
Article
Rapid and Quantitative Determination of Sildenafil
in Cocktail Based on Surface Enhanced
Raman Spectroscopy
Lei Lin 1,2 , Fangfang Qu 1,2 , Pengcheng Nie 1,2,3 , Hui Zhang 1,2 , Bingquan Chu 1,4 and
Yong He 1,2, *
 1   College of Biosystems Engineering and Food Science, Zhejiang University, Hangzhou 310058, China;
     linlei2016@zju.edu.cn (L.L.); ffqu@zju.edu.cn (F.Q.); npc2012@zju.edu.cn (P.N.); 13644410041@163.com (H.Z.);
     bqchu@zust.edu.cn (B.C.)
 2   Key Laboratory of Spectroscopy Sensing, Ministry of Agriculture, Zhejiang University,
     Hangzhou 310058, China
 3   State Key Laboratory of Modern Optical Instrumentation, Zhejiang University, Hangzhou 310058, China
 4   School of Biological and Chemical Engineering, Zhejiang University of Science and Technology,
     Hangzhou 310023, China
 *   Correspondence: yhe@zju.edu.cn; Tel.: +86-0571-8898-2143

 Received: 20 April 2019; Accepted: 7 May 2019; Published: 9 May 2019

 Abstract: Sildenafil (SD) and its related compounds are the most common adulterants found in
 herbal preparations used as sexual enhancer or man’s virility products. However, the abuse of SD
 threatens human health such as through headache, back pain, rhinitis, etc. Therefore, it is important
 to accurately detect the presence of SD in alcoholic beverages. In this study, the Opto Trace Raman 202
 (OTR 202) was used as a surface-enhanced Raman spectroscopy (SERS) active colloids to detect SD.
 The results demonstrated that the limit of detection (LOD) of SD was found to be as low as 0.1 mg/L.
 Moreover, 1235, 1401, 1530, and 1584 cm−1 could be qualitatively determined as SD characteristic
 peaks. In a practical application, SD in cocktail could be easily detected using SERS based on OTR 202.
 Also, there was a good linear correlation between the intensity of Raman peaks at 1235, 1401, 1530,
 and 1584 cm−1 and the logarithm of SD concentration in cocktail was in the range of 0.1–10 mg/L
 (0.9822 < R2 < 0.9860). The relative standard deviation (RSD) was less than 12.7% and the recovery
 ranged from 93.0%–105.8%. Moreover, the original 500–1700 cm−1 SERS spectra were pretreated
 and the partial least squares (PLS) was applied to establish the prediction model between SERS
 spectra and SD content in cocktail and the highest determination coefficient (Rp2 ) reached 0.9856.
 In summary, the SD in cocktail could be rapidly and quantitatively determined by SERS, which was
 beneficial to provide a rapid and accurate scheme for the detection of SD in alcoholic beverages.

 Keywords: sildenafil; cocktail; surface enhanced Raman spectroscopy; quantitative determination;
 partial least squares

1. Introduction
      Sildenafil (SD) and its related compounds are the most common adulterants found in herbal
preparation, which can be used as sexual enhancer or man’s virility products [1]. Its pharmacological
effect is to inhibit the metabolism of the second messenger cyclic guanosinc monophosphate (cGMP),
promote the relaxation of cavernous artery smooth muscle, and then improve the symptoms of
erectile dysfunction (ED) [2,3]. However, the usage of SD is controlled through medical supervision
due to their harmful side-effects such as headache, dyspepsia, back pain, rhinitis, flu syndrome,
etc. [4]. In recent years, SD, through illegal business, has illegally added to Chinese patent medicines

Molecules 2019, 24, 1790; doi:10.3390/molecules24091790                          www.mdpi.com/journal/molecules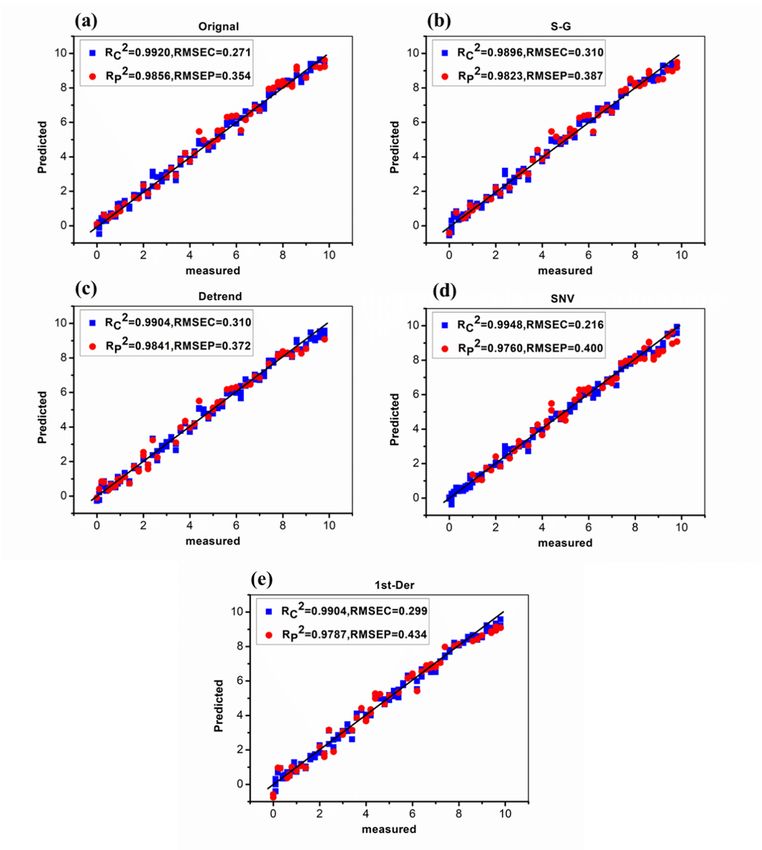
Molecules 2019, 24, 1790                                                                          2 of 12

and alcoholic drinks in pursuit of high profits. Generally, traditional methods for determining SD
in alcoholic beverages include ultraviolet spectrophotometry (UV) [5,6], high-performance liquid
chromatography (HPLC) [7], gas chromatography-mass spectrometry (GC–MS) [8–10], thin-layer
chromatography (TLC) [11,12], and near Infrared Spectrometry (NIR) [13,14]. Xin et al. [15] applied
HPLC method to detect seven kidney-tonifying and yang-strengthening illegal additives. It was
shown that the limits of detection (LODs) were in the range of 8.2–33.4 ng. Kee et al. [16] achieved the
classification of two sets of isomers (sildenafil analogues and mercaptosidinafil analogues) by Orbitrap
mass spectrometry (MS) method, and the database of these compounds was established using quality
processing software. Tagami et al. [17] established a method for the isolation and identification of
five sildenafil analogues using liquid chromatography-mass spectrometry (LC-MS). Huang et al. [18]
achieved the qualitative and quantitative detection of 17 kidney-tonifying and yang-strengthening
chemicals that were illegally added in Chinese patent medicine by LC-MS method. The results
suggested that the LODs were in the range of 0.05–1.25 mg/kg. Although these detection methods
achieved high sensibility, the developments of these methods were limited by the cumbersome pre-test,
time-consuming detection, inconvenient instrument, expensive reagents, and other shortcomings [19].
      Compared with the methods mentioned above, surface-enhanced Raman spectroscopy (SERS),
which can provide ultrasensitive and unmarked chemical analysis, has attracted focus and attention in
past decades [20,21]. Besides, SERS is suitable for rapid screening of molecule substances’ absorbed
molecules because of its advantages of simple pretreatment, convenient equipment, and fast detection
speed [22]. In the field of SD analysis and detection using SERS technique, scholars have carried out
relevant researches. Liu et al. [12] applied the thin-layer chromatographic surface- enhanced Raman
spectroscopy (TLC-SERS) to detect the SD in proprietary medicines and health products. It was found
that 1563, 1530, 1405, 1240, 1272, and 1582 cm−1 could be qualitatively determined as SD characteristic
peaks, while the quantitative detection of SD was not involved. Zhen et al. [23] combined SERS with
gold and silver nanoparticles to analyze SD in health wine. It was indicated that the LOD of SD
reached 0.5 mg/kg. However, the correlation coefficient (R2 = 0.9472) was not high in the range of
0.1 to 10 mg/L. Wang et al. [24] found that 11 kinds of SD drugs could be classified into five groups
according to their structures. The results demonstrated that the LOD of the SD was found to be as
low as 0.05 mg/kg using SERS technology. Although the linear correlation coefficient (R2 = 0.97) was
relatively high, there were only five samples in the linear regression equation. Yu et al. [25] achieved
the rapid detection of SD citrate in health wine using disperse magnetic solid phase microextraction
and surface enhanced Raman scattering (Dis-MSPME-SERS). The results suggested that the minimum
detectable concentration was 1.0 × 10⁻⁸ M. But the Dis-MSPME-SERS pretreatment method was
complex and time-consuming.
      Above the analysis, it is important to accurately detect SD in health wine using SERS. In this
paper, the SD in cocktail was selected as the research object. The main objective of this paper is to
rapidly and quantitatively determine SD in cocktail combined with chemometric methods and improve
the accuracy of SD detection, which is of great significance for rapid and accurate detection of SD
in cocktail.

2. Results and Discussion

2.1. Opto Trace Raman 202 and its Spectral Analysis
     To investigate the enhancement effects of Opto Trace Raman 202 (OTR 202), the structure,
UV spectrum, and Raman spectroscopy (RS) of OTR 202 were analyzed. Figure 1a is the transmission
electron microscopy (TEM) image of OTR 202, Figure 1b displays the UV/Visible spectra of OTR 202,
and Figure 1c shows the Raman spectrum of OTR 202.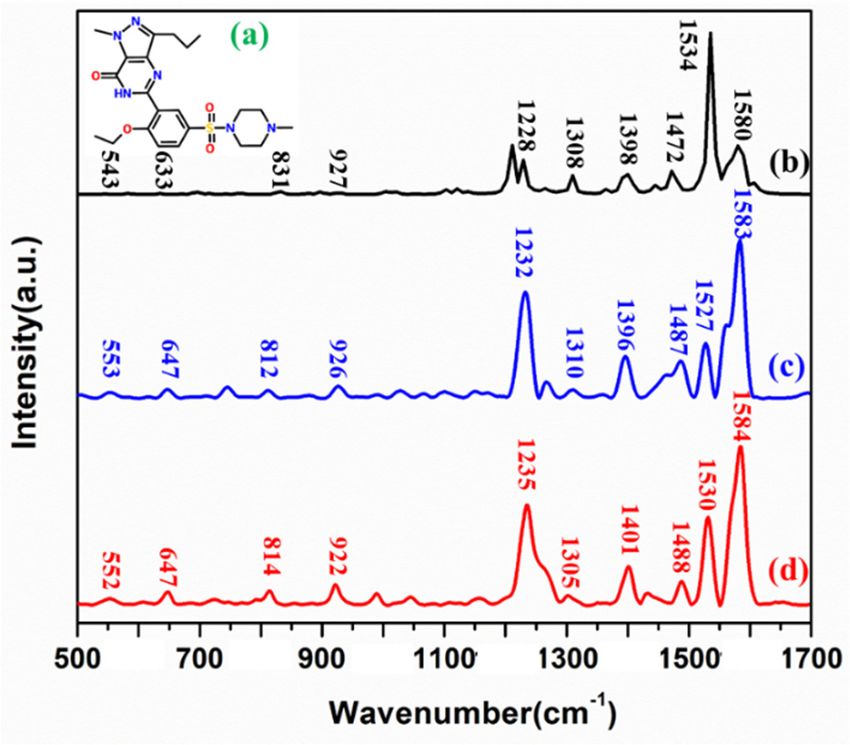
Molecules 2019, 24, 1790 3 of 12
Molecules 2019,
Molecules 2019, 24,
24, xx 33 of
of 12
12
Figure
Figure 1.
Figure 1. (a)
1. (a) Transmission
(a) Transmission electron
Transmission electron microscopy
electron microscopy (TEM)
microscopy(TEM) images
(TEM)images of
imagesof Opto
ofOpto Trace
OptoTrace Raman
Trace Raman 202
Raman202 (OTR
202(OTR 202);
(OTR202);
202);
(b)
(b) the
(b) the UV/Visible
the UV/Visible spectra of OTRT 202; (c) the Raman spectrum
UV/Visible spectra of OTRT 202; (c) the Raman spectrum (RS) (RS) of
(RS) of OTR
of OTR 202.
OTR 202.
202.
It can
It can be
canbe clearly
beclearly seen
clearlyseen
seenthat thethe
that
that the average
average
average diameter
diameter
diameter of OTR
of OTR 202 was
of OTR
202 was aboutabout
202 about
was 30 nm.
30 nm. As
30As
nm.shown
shown in Figure
As shown
in Figurein
1b, the
Figure UV/Visible
1b, the characteristic
UV/Visible absorption
characteristic peaks
absorption of OTR
peaks 202
of was
OTR at 533
202 nm.
was Beside
at
1b, the UV/Visible characteristic absorption peaks of OTR 202 was at 533 nm. Beside this, the Raman 533 this,
nm. the
BesideRaman
this,
spectrum
the Ramanof
spectrum ofspectrum
OTR 202
OTR 202 only
of only hadonly
OTR had
202 aa faint
faint signal
hadsignal at
a faintat 1630atcm
signal
1630 cm
1630
−1 cm−1 (Figure
−1 (Figure
(Figure 1c), suggesting
1c), suggesting that OTR
1c), suggesting
that OTR
that OTR202
202
themselves
202 themselves
themselves hadhad
had no strong
no strong Raman
no strong Raman
Raman characteristic
characteristic
characteristic peaks
peaks
peaks and
andanddid
did not
did have
nothave
not haveanan interferential
aninterferential effect
interferentialeffect on
effect on
experimental results. Therefore, the OTR 202 was
was suitable
suitable as
as SERS
SERS substrate
substrate to
to detect
detect
experimental results. Therefore, the OTR 202 was suitable as SERS substrate to detect SD in this paper. SD
SD in
in this
this paper.
paper.
2.2. TheSD
2.2. The
The SDMolecule
SD Molecule and
Molecule and its
and its Assignment
its Assignment of
Assignment of Raman
Raman Peaks
Peaks
The molecular
The structure
structure of
molecular structure of SD
of SD(molecular
SD (molecularformula:
(molecular formula:CC
formula: 22H
C22
22HH30
30N
30
O444S)
N666O
O S)is
S) isisshown
shownin
shown inFigure
in Figure 2a.
Figure Density
2a. Density
Density
functional theory
functional theory
functional (DFT),
theory (DFT), as a common method for molecular geometry optimization
(DFT), as a common method for molecular geometry optimization and frequency and frequency
vibration calculation,
vibration calculation, can describe the
can describe
describe theground
the ground state
ground statephysical
state physicalproperties
physical propertiesof
properties ofatoms
of atomsand
atoms andmolecules
and molecules[26].
molecules [26].
[26].
In this paper, DFT was applied to calculate SD molecule and optimize its structure
In this paper, DFT was applied to calculate SD molecule and optimize its structure in Gaussian.v09 in Gaussian.v09
software. In
software. Inthis
In thissoftware,
this software,the
software, thevibrational
the vibrationalform
vibrational formof
form ofofrelevant
relevantchemical
relevant chemicalbonds
chemical bondscalculated
bonds calculatedby
calculated byHartree-Fock
by Hartree-Fock
Hartree-Fock
function can
wave function
wave can be
can be obtained
be obtained[27].
obtained [27]. Figure
[27]. Figure2b
Figure 2bisis
2b isthe
theRS
the RSofof
RS ofSDSDsimulated
SD simulatedby
simulated byDFT,
by Figure
DFT,
DFT, Figure
Figure2c2c
is is
2c the
is theRSRS
the of
RS
solid SD.
of solid
of Besides,
solid SD.
SD. Besides,in order
Besides, in to
in order verify
order to the
to verify necessity
verify the
the necessityof
necessity ofusing OTR
of using
using OTR 202
OTR 202 reinforcement,
202 reinforcement, the
reinforcement, the SERS of
the SERS
SERS ofSD was
of SD
SD
analyzed.
was Figure
analyzed. 2d
Figure shows
2d the
shows SERS
the spectra
SERS of
spectra SDofwith
SD
was analyzed. Figure 2d shows the SERS spectra of SD with OTR 202. OTR
with 202.
OTR 202.
Figure 2.
Figure (a) Molecular
2. (a)
(a) Molecular structure
structure of
of sildenafil
sildenafil (SD);
(SD); (b)
(b) the
the theory calculation
theory calculation by density
calculation by
by functional
density functional
functional
Figure 2. Molecular structure of sildenafil (SD); (b) the theory density
theory (DFT);
theory (DFT); (c)
(DFT); (c) RS
(c) RS of
RS of solid
of solid SD.
solid SD. (d)
SD. (d) Surface-enhanced
(d) Surface-enhanced Raman
Surface-enhanced Raman spectroscopy
Raman spectroscopy (SERS)
spectroscopy (SERS) spectra
(SERS) spectra of
spectra of SD.
of SD.
SD.
theory
As seen
As seen in
in Figure
Figure 2,
2, the
the positions
positions ofof SD
SD spectral
spectral bands
bands and
and its
itsintensities
intensities were were basically
basically consistent
consistent
As seen in Figure 2, the positions of SD spectral bands and its intensities−1 ),were basically consistent
with the
with the experiment-detected
the experiment-detected
experiment-detected Raman Raman spectra
Raman spectra
spectra ofof SD
of SD (Raman
SD (Raman shifts
(Raman shifts < 5 cm
shifts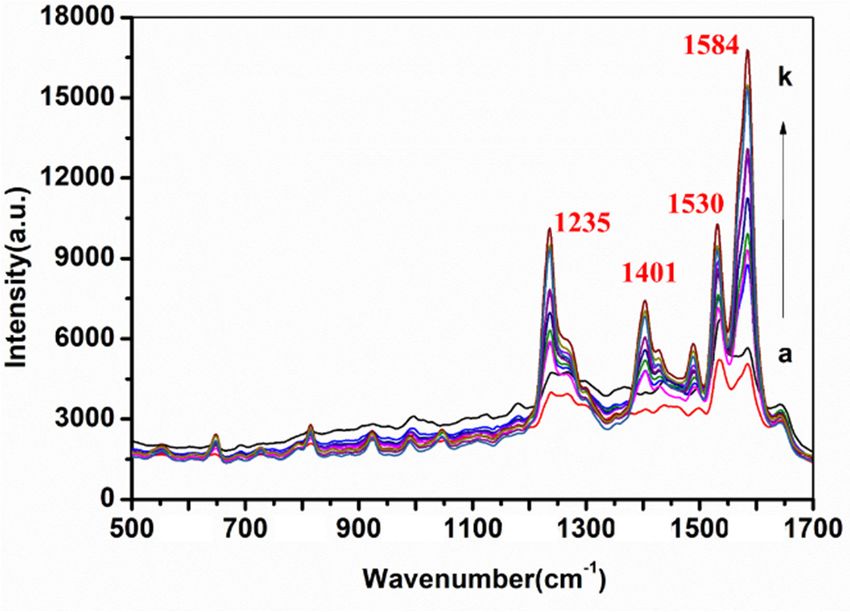
breathing deformable vibration; 647 cm−1 was the carbonyl stretching, phenetole deformable
vibration, and C-S stretching in sulfamide, and 831 cm−1 belonged to the pyrazole pyridine stretching;
922 cm−1 was assigned to the C–C deformable vibration and C–H stretching in pyrazole pyridine
group, 1235 cm−1 was the C–H stretching vibration in carbonyl, 1305 cm−1 was C–H stretching
vibration in ethyl. Further, 1401 cm−1 was the C–H deformable vibration in methyl piperazine.;1488,
Molecules 2019, 24, 1790 4 of 12
1530, and 1584 cm−1 were the C–H deformable vibration in pyrazole pyridine.
the experiment-detectedTable Raman1. The proposed
spectra of SDassignment
whose Raman of Raman peaks
shifts SD. 10 cm−1 ) were within a
(lessofthan
reasonable
Calculation range.
(cm−1) Combined with
Solid related
(cm−1 ) literature
SERS (cm[23],
−1) the assignmentsAssignments
of Raman peaks of SD are
listed in Table −1
543 (w) 1. For the SERS553of(w)
SD, 552 cm was 552 the carbonyl stretching
υ carbonyland phenetole breathing
+ δphenetole
deformable vibration; 647 cm−1 was the carbonyl stretching, phenetole deformable
υ carbonyl + δ phenetole+vibration,
υ (C-S) inand C-S
633 (w) 647 (w) 647 (w)
stretching in sulfamide, and 831 cm−1 belonged to the pyrazole pyridine stretching;
Sulfamide 922 cm−1 was
assigned831to(w)
the C–C deformable812 (w)
vibration and 814
C–H(m) υ Pyrazole
stretching in pyrazole group, 1235 cm−1
pyridine
pyridine
was the927
C–H −1 δ (C-C) + υ (C-H) in Pyrazole pyridine
(w)stretching vibration in carbonyl, 1305
926 (w) 922 cm
(m) was C–H stretching vibration in ethyl. Further,
−1
1401 cm was the C–H deformable vibration in methyl piperazine.;1488, 1530, groupand 1584 cm−1 were
1228 (m) 1232 1235 δ (C-H)in carbonyl
the C–H deformable vibration in pyrazole pyridine.
1308 (m) 1310 (w) 1305 δ (C-H) in ethyl
1398 (m) 1396 (m) 1401 (m) δ (C-H) in methyl piperazine
Table 1. The proposed assignment of Raman peaks of SD.
1472 (m) 1487 (m) 1488 (m) δ (C-H) in Pyrazole pyridine
1534 (vs) (cm−1 )
Calculation 1527
Solid (cm(s)
−1 ) SERS 1530
(cm−1(s)
) δ (C-H)Assignments
in Pyrazole pyridine
1580
543(s)
(w) 1583
553 (w)(vs) 1584
552 (vs) δ (C-H) in Pyrazole
υ carbonyl pyridine
+ δphenetole
Note:
633vs = very strong; s647
(w) = strong;
(w) m = medium; w = weak;υυcarbonyl
647 (w) + δ phenetole+
= stretching; δ = deformable vibration.
υ (C-S) in Sulfamide
831 (w) 812 (w) 814 (m) υ Pyrazole pyridine
927 (w) 926 (w) 922 (m) δ (C-C) + υ (C-H) in Pyrazole pyridine group
2.3. Limit1228
of Detection
(m)
of SD 1232 1235 δ (C-H) in carbonyl
1308 (m) 1310 (w) 1305 δ (C-H) in ethyl
To investigate the sensitivity and stability of the OTR 202 substrates for the detection of SD in
1398 (m) 1396 (m) 1401 (m) δ (C-H) in methyl piperazine
cocktail, 1472
six (m)
different SD 1487
concentrations
(m) (0,
14880.1,
(m) 0.5, 2, 5, and δ10 mg/L)
(C-H) were pyridine
in Pyrazole collected and the
1534 (vs)SERS are shown
corresponding 1527 (s)
in Figure 3A.1530 (s) δ (C-H) in Pyrazole pyridine
1580 (s) 1583 (vs) 1584 (vs) δ (C-H) in Pyrazole pyridine
According to Figure 3A,B, the SERS intensity decreased gradually with the decrease of SD
Note: vs = very strong; s = strong; m = medium; w = weak; υ = stretching; δ = deformable vibration.
concentration from 10 mg/L to 0 mg/L. It was found that the characteristic peaks at 1235, 1401, 1530,
and 1584 cm of SD in cocktail were still identified even when the SD solution concentration was as
−1
2.3. Limit of Detection of SD
low as 0.1 mg/L. It can be seen that there was faint SERS signal when the SD was 0 mg/L. This might
belongTo to the SERS the
investigate signal of someand
sensitivity substances
stability in
of cocktails.
the OTR 202Generally,
substratesthe for
LODtheofdetection
SD in cocktail
of SD
reached 0.1 six
in cocktail, mg/L and 1235,
different 1401, 1530, and
SD concentrations (0,1584 cm 2,could
0.1, 0.5,−1 5, and be10qualitatively
mg/L) weredetermined as the
collected and SD
characteristic
correspondingpeaks.SERS are shown in Figure 3A.
Figure 3. (A) (A) The
The SERS
SERS ofof sildenafil
sildenafil (SD)
(SD) in
in cocktail.
cocktail. (a)
(a)00mg/L;
mg/L;(b)
(b)0.1
0.1mg/L;
mg/L;(c)
(c)0.5
0.5mg/L;
mg/L;(d)
(d)22mg/L;
mg/L;
(e) 5 mg/L;
mg/L;(f)(f)10
10mg/L.
mg/L.(B)(B)TheThe SERS
SERS intensity
intensity of SD
of SD concentration
concentration fromfrom 10 mg/L
10 mg/L to 0 mg/L
to 0 mg/L at 1235atcm −1 ,
1235
cm , (b) cm
(b) −11401 −1 ,cm
1401 cm−1cm
−1, (c)1530
(c)1530 −1 and (d) 1584−1
and (d) 1584 cm cm . −1.
According to Figure 3A,B, the SERS intensity decreased gradually with the decrease of SD
concentration from 10 mg/L to 0 mg/L. It was found that the characteristic peaks at 1235, 1401, 1530,
and 1584 cm−1 of SD in cocktail were still identified even when the SD solution concentration was as
low as 0.1 mg/L. It can be seen that there was faint SERS signal when the SD was 0 mg/L. This might
belong to the SERS signal of some substances in cocktails. Generally, the LOD of SD in cocktail
reached 0.1 mg/L and 1235, 1401, 1530, and 1584 cm−1 could be qualitatively determined as SD
characteristic peaks.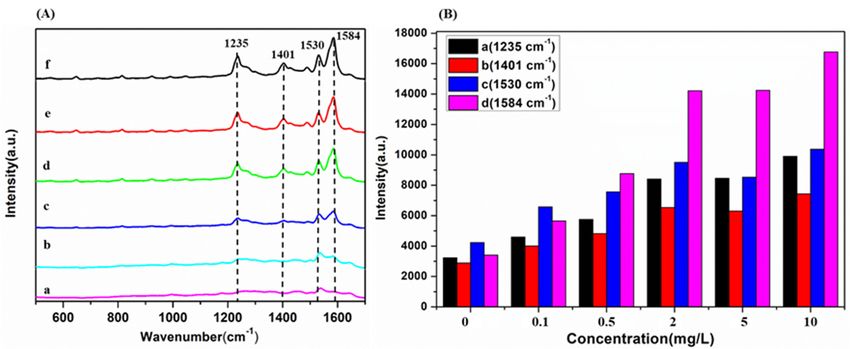
Molecules 2019, 24, 1790 5 of 12
Molecules 2019, 24, x 5 of 12
Molecules 2019, 24, x 5 of 12
2.4. Detection of SD in Cocktail
2.4. Detection of SD in Cocktail
In
In this
this study,
study,to toinvestigate
investigatethe
theaccuracy
accuracyand
andstability ofof
stability the OTR
the OTR202
202substrate forfor
substrate thethe
detection of
detection
SD in In this study,
cocktail, SD into investigate
cocktail with the
theaccuracy and stability
concentrations of the
ranging OTR
from 10 202
mg/Lsubstrate
to 0.1 for the
mg/L detection
were detected
of SD in cocktail, SD in cocktail with the concentrations ranging from 10 mg/L to 0.1 mg/L were
of SD in cocktail, SD in cocktail with the concentrations ranging from 10 mg/L to 0.1 mg/L were
using
detectedSERS. TheSERS.
using SERS Thespectra
SERSof spectra
SD in cocktail were
of SD in obtained,
cocktail wereand the representative
obtained, SERS spectra
and the representative are
SERS
detected using SERS. The SERS spectra of SD in cocktail were obtained, and the representative SERS
given
spectra inare
Figure
given4. in Figure 4.
spectra are given in Figure 4.
Figure
Figure
Figure 4.4.SERS
4. SERSspectra
SERS spectraof
spectra ofofsildenafil
sildenafil (SD)
sildenafil (SD) in
(SD) cocktail
in cocktail with
cocktailwith different
withdifferent concentrations
differentconcentrations
concentrations from
from aa to
a to
from k: 0.1,
k: 0.1,
to 0.2,
0.2,0.2,
k: 0.1,
0.4, 0.6,
0.4, 0.8,
0.6, 1,
0.8, 1,2,2,4,4,6,6,8,8,and
and10 10mg/L,
mg/L,respectively.
respectively.
0.4, 0.6, 0.8, 1, 2, 4, 6, 8, and 10 mg/L, respectively.
AsAs shown
shownininFigure
Figure4,4,with
with the
the decrease of SD
decrease of SD in
in cocktail
cocktailfrom
from1010mg/L
mg/Ltoto 2 mg/L,
2 mg/L, thethe Raman
Raman
As shown in Figure 4, with the decrease−1 of SD in cocktail from 10 mg/L to 2 mg/L, the −1Raman
peaks at 1235, 1401, 1530, and 1584 cm decreased. Therefore, 1235, 1401, 1530, and
peaks at 1235, 1401, 1530, and 1584 cm decreased. Therefore, 1235, 1401, 1530, and 1584 cm could
−1 1584 cm−1 could
peaks at 1235, 1401, 1530, and 1584 cm−1 decreased. Therefore, 1235, 1401, 1530, and 1584 cm−1 could
bebequantitatively
quantitativelydetermined
determinedas asSDSD characteristic peaksin
characteristic peaks incocktail.
cocktail.WithWitha aportable
portable Raman
Raman system,
system,
be quantitatively determined as SD characteristic peaks in cocktail. With a portable Raman system,
quantitative
quantitative SERS
SERS determinationofofSD
determination SDconcentration
concentration(0.1,
(0.1,0.2,
0.2, 0.4,
0.4, 0.6,
0.6, 0.8,
0.8, 1, 2, 4, 6, 8, and 10 mg/L)
mg/L) in
quantitative SERS determination of SD concentration (0.1, 0.2, 0.4, 0.6, 0.8, 1, 2, 4, 6, 8, and 10 mg/L)
in cocktail
cocktail has been
has been conducted
conducted and and the linear
the linear regression
regression equations
equations between
between Raman
Raman peakpeak intensity
intensity at
at 1235,
in 1235,
cocktail has1530,
1401, beenand
conducted
−11584 cm and thelogarithm
−1 and linear regression
of SD equations between
concentration in Raman
cocktail werepeak intensity at
established,
1401, 1530, and 1584 cm and logarithm of SD concentration in cocktail were established, respectively
1235, 1401, 1530,
respectively and5).1584 cm−1 and logarithm of SD concentration in cocktail were established,
(Figure
(Figure 5).
respectively (Figure 5).
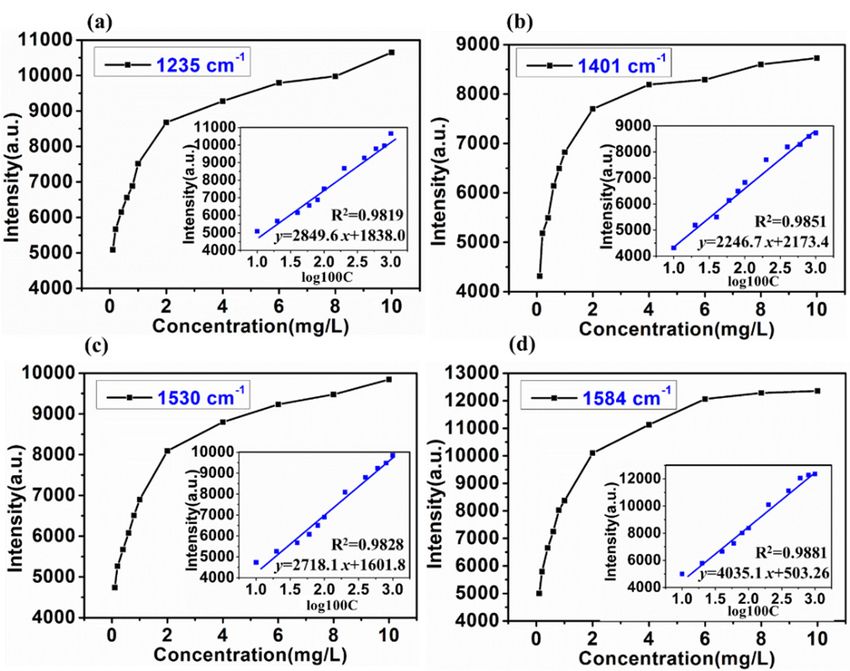
Figure
Figure 5. 5.The
Theplot
plot of
of intensities
intensities of
of SERS
SERSpeak
peakatat1235
1235cmcm −1 (a),
−1 (a), 14011401 (b),−11530
cm−1cm (b), cm cm−1 (c),
−1 (c), and
1530 1584
and
1584 −1 −1
cmcm(d) versus SD SD
(d) versus concentration in cocktail.
concentration Inset:
in cocktail. TheThe
Inset: linear calibration
linear plotted
calibration in the
plotted in thelogarithm
logarithm
Figure 5. The range
concentration
concentration plot offrom
range intensities
from 0.1mg/L
0.1 of to
mg/L SERS
to10 peak at 1235 cm−1 (a), 1401 cm−1 (b), 1530 cm−1 (c), and 1584
10mg/L.
mg/L.
cm−1 (d) versus SD concentration in cocktail. Inset: The linear calibration plotted in the logarithm
concentration range from 0.1 mg/L to 10 mg/L.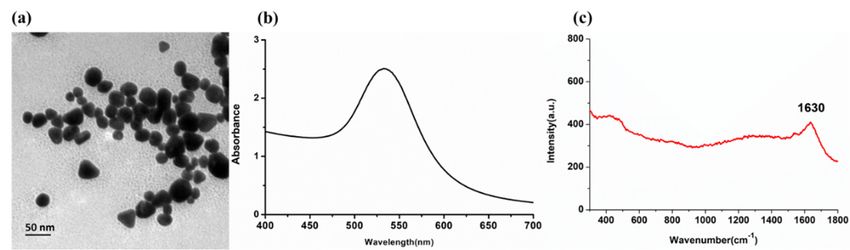
Molecules 2019, 24, 1790                                                                                                     6 of 12

     According to Figure 5, SERS spectra of SD in cocktail mixed with the OTR 202 are concentration
dependent. The peaks at 1235, 1401, 1530, and 1584 cm−1 could be regarded as a marker band for SD
in cocktail determination owing to its drastic intensity change with varying SD concentration. There
was a good linear correlation between Raman peak intensity and logarithm of SD concentration in
cocktail in each linear regression equation ranged from 0.1 mg/L to 10 mg/L (0.9822 < R2 < 0.9860),
which demonstrated that the SERS can accurately and quantitatively analyze SD in cocktail. To verify
the accuracy of this method, first, eight different SD concentration in cocktail (0.3, 0.5, 0.7, 0.9, 3, 5, 7,
and 9 mg/L) were prepared and each concentration contained three samples. Second, all the samples
were detected by SERS based on OTR 202 of three consecutive days. Third, the linear regression
equations at 1235, 1401, 1530, and 1584 cm−1 were used to predict the SD concentration in cocktail.
Table 2 presents the precision and accuracy of method for the determination of sildenafil in cocktail.

            Table 2. The precision and accuracy of method for the determination of sildenafil in cocktail.

               Added       Predicted (mg/L)     a   RSD    Recovery            Added     Predicted (mg/L)   RSD     Recovery
     Days                                                             Days
               (mg/L)        Mean + SD              (%)      (%)               (mg/L)      Mean + SD        (%)       (%)
                 0.3        0.307 ± 0.016           2.01    102.4                0.3       0.298 ± 0.012    1.53      99.6
                 0.5        0.465 ± 0.045           5.59     93.0                0.5       0.469 ± 0.031    6.67      91.4
                 0.7        0.641 ± 0.058           7.17     91.6                0.7       0.641 ± 0.058    7.17      91.6
    Day one      0.9         0.95 ± 0.071           8.71    105.6      Day       0.9       0.93 ± 0.024     3.05     103.7
                                                                      three
                 3           3.09 ± 0.16            10.1    102.1                 3         2.96 ± 0.12     11.9      98.7
                 5           4.88 ± 0.090           10.9     97.7                 5        4.84 ± 0.084     10.2       97
                 7           6.59 ± 0.107           11.8     94.1                 7        6.70 ± 0.047      5.8      95.8
                 9           9.02 ± 0.13            16      100.2                 9        8.96 ± 0.148     12.6      99.5
                 0.3        0.305 ± 0.013           1.59    101.8                0.3       0.303 ± 0.015    1.54     101.2
                 0.5        0.469 ± 0.036           4.8      93.9                0.5       0.468 ± 0.039    4.16      93.6
                 0.7        0.640 ± 0.054           6.67     91.4                0.7       0.641 ± 0.055    6.92      98.8
      Day        0.9         0.97 ± 0.066           8.09    108.1     Inter      0.9       0.952 ± 0.060    6.38     105.8
      two                                                              day
                 3           3.07 ± 0.126           12.3    102.3                 3         3.03 ± 0.13     11.8     101.2
                 5           4.96 ± 0.102           12.5     99.2                 5        4.89 ± 0.103     10.9      97.9
                 7           6.74 ± 0.081           10      96.38                 7        6.68 ± 0.105     11.24     95.4
                 9           9.09 ± 0.103           12.7    101.1                 9         9.03 ± 0.14     14.8     100.3
                                   a   SD (standard deviation); RSD (relative standard deviation).

     According to Table 2, the intra and inter day relative standard deviation (RSD) were less than
12.7% and 11.8%, respectively. The intra and inter day accuracy% ranged between 93.0%–105.6% and
93.6%–105.8%, respectively. From the results, one can infer that precision and accuracy were within the
acceptable limits.

2.5. Determination of SD in Cocktail with PLS
      Considering that the Raman peaks of SD in cocktail were mainly distributed in the range of
500–1700 cm−1 , the partial least squares (PLS) prediction model was established based on 500–1700 cm−1
SERS spectra. The SERS spectra of SD in cocktail of 155 samples were obtained and then pretreated with
Savitzky–Golay (S-G), detrend (DT), standard normal variation (SNV), and 1st-derivative (1st-Der),
respectively, and then modeled by PLS. The sample set portioning based on the joint x-y distance
(SPXY) [28] method was used to separate the soil samples into calibration set and validation set at the
ratio of 2:1. The PLS modeling results based on the 500–1700 cm−1 spectra under different pretreatments
are presented in Table 3. The scatter plot between the predicted values and the measured values of the
correction set and the prediction set sample are shown in Figure 6.
Molecules 2019, 24, 1790 7 of 12
Table 3. The PLS modeling results based on 500–1700 cm−1 spectra under different pretreatments.
Calibration Prediction
Pretreatment Principal Components
a Rc2 RMSEC Rp2 RMSEP
Original 9 0.9920 0.271 0.9856 0.354
S-G 8 0.9896 0.310 0.9823 0.387
Detrend 8 0.9904 0.310 0.9841 0.372
Molecules 2019, 24, x 7 of 12
SNV 10 0.9948 0.216 0.9760 0.400
1st-Der 8 0.9904 0.299 0.9787 0.434
pretreatments are presented in Table 3. The scatter2 plot between the predicted values and the
a Rc2 (the coefficient of determination of the calibration set); Rp (the coefficient of determination of the prediction
measured values
set); RMSEC (rootof the square
mean correction
error ofset
theand the prediction
calibration set); RMSEPset sample
(root are shown
mean square error of in
theFigure 6. set).
prediction
Figure 6. The model performance modeled by partial least squares (PLS) with different pretreatments.
Figure 6. The model performance modeled by partial least squares (PLS) with different pretreatments.
(a) Original; (b) Savitzky–Golay (S-G); (c) detrend (DT); (d) standard normal variation (SNV);
(a) Original; (b) Savitzky–Golay (S-G); (c) detrend (DT); (d) standard normal variation (SNV); (e) 1st-
(e) 1st-derivative (1st-Der).
derivative (1st-Der).
It can be seen that the predictive effect of SD in cocktail was great (0.9896 < Rc2 < 0.9948, 0.216 <
RMSECTable 3. The PLS modeling
< Rp2 < results
0.9856,based
0.354on
< 500–1700 cm0.434).
−1 spectra under different pretreatments.
< 0.310; 0.9760 RMSEP < Moreover, the modeling effect was
similar after using different pretreatment methods. Among them, the SERS original spectra
Calibration performed
Prediction
Pretreatment Principal Components aRc2 RMSEC Rp2 RMSEP
Original 9 0.9920 0.271 0.9856 0.354
S-G 8 0.9896 0.310 0.9823 0.387
Detrend 8 0.9904 0.310 0.9841 0.372
SNV 10 0.9948 0.216 0.9760 0.400Molecules 2019, 24, 1790 8 of 12
a slightly better modeling effect compared with SNV and 1st-Der. On the one hand, it was shown
that the background noise had little effect on the original spectrum and the PLS model with good
effect could be established through the original spectrum. On the other hand, although the SNV and
1st-Der eliminated the influence of SRES background noise to some extent, it might weaken the spectral
resolution and made it difficult for quantitative analysis.
3. Materials and Methods
3.1. Experimental Instruments and Reagents
In this study, the experimental instruments included: (1) RmTracer-200-HS portable Raman
spectrometer combined with a 785 nm excitation wavelength diode-stabilized stimulator (Opto Trace
Technologies, Inc., Mountain View, CA, USA); (2) The FEI Tecnai G2 F20 S-TWIN transmission electron
microscope (FEI Company, Hillsboro, OR, USA); (3) Vortex-Genie 2/2T vortex mixer (Shanghai Ling early
Environmental Protection Instrument Co., Ltd., Shanghai, China). Moreover, the experimental reagents
included: (1) Sildenafil (99.8% purity, Sigma-Aldrich, Beijing, China); (2) methanol (chromatographically
pure, Amethyst Chemicals, Beijing, China); (3) cocktail (Shanghai Baxter Liquor Co., Ltd., Shanghai,
China). In addition, the OTR 202 nanomaterials and OTR 103 produced by Opto Trace Technologies,
Inc. (SuZhou, China) were also used in this study.
3.2. Sample Preparation
The process of specific sample preparation was as follows. First, the standard of SD was diluted
to 1000 mg/L with methanol. Second, the standard solution of 1000 mg/L was diluted to 0 to 1 mg/L
(0.1 mg/L per gradient, 11 concentrations) and 1.2 to 10 mg/L (0.2 mg/L per gradient, 44 concentrations)
with cocktail. There were 3 samples for each concentration. A total of 155 samples were prepared.
3.3. SERS Measurement
Before Raman spectra acquisition, the instrument should be calibrated using a 785 nm excitation
wavelength. The parameters were set as follows: A power of 200 mw, a scanning range of 200 to
3300 cm−1 , an optical resolution of 2 cm−1 , an integration time of 10 s, and an average spectral value of
3 times. The solid SD RS collection was that SD powder was in quartz plate with glass slides flattened
and the spectra were acquired with matching microscope platform. When collecting the SERS of
samples, 500 µL OTR 202, 100 µL test solution, and 100 µL OTR 103 were added in turn into a 2 mL
quartz bottle, then it was placed at a liquid sample pool.
3.4. Density Functional Theory (DFT)
Density functional theory (DFT), as a tool for calculating molecular energy and analyzing
properties, has been widely used in the field of physics and chemistry. It provides the computational
strategies for obtaining information about the energetics, structure, and properties of atoms and
molecules [29]. The performance of Becke three-parameter Lee–Yang–Parr (B3LYP) functional in
combination with various basis sets has been extensively tested for molecular geometries, vibrational
frequencies, ionization energies and electron affinities, dipole and quadrupole moments, atomic
charges, infrared intensities, and magnetic properties [27]. Among the various functions and basis sets
in DFT, the hybrid functional B3LYP with the 6-31G (d,p) basis set has been commonly used in the
Raman spectroscopic calculation of biological molecules [30]. In this paper, B3LYP/6-31G (d,p) was
used for the theoretical simulation and calculation of SD molecules.
3.5. Spectral Preprocessing Methods
The SERS spectra could be affected by instrument resolution, laser energy, instrument parameters,
environmental factors, scattering light on quartz bottle surface, and optical path change. Thus,
removing background fluorescence from Raman signals is essential for analyzing Raman signalsMolecules 2019, 24, 1790 9 of 12
accurately. Here in the PLS model, each original SERS spectrum was processed by the S-G [31]
5 points smoothing filter, Detrend, SNV, and 1st-Der, respectively. S-G smoothing can reduce the
noise introduced by samples, instrument state, surrounding environment, and human operation.
The principle of SNV [32] algorithm is that the absorbance values of each wavelength point satisfies
a certain distribution in each spectra, and the spectral correction was performed according to this
assumption, which can eliminate the influence of scattering light and path change on SERS spectrum
of quartz bottle surface in liquid detection. The idea of detrend (DT) [33] algorithm is that the spectral
absorbance and wavelength are first fitted into a trend line d according to the polynomial, and then the
trend line d is subtracted from the original spectra x to achieve the effect of the trend. 1st-derivation
(1st-Der) can distinguish overlapping peaks and eliminate interference from other backgrounds, which
improves spectral resolution, sensitivity, and the signal-to-noise ratio of the spectra [34].
3.6. Partial Least Squares Model
PLS is a commonly-used calibration model for spectral data analysis, which reflects the relationship
between spectra and attribution information due to its flexibility and reliability [35,36]. When PLS is
applied to dealing with spectral data, the spectral matrix is decomposed first and the main principal
component variables are obtained, then the contribution of each principal component is calculated.
The flexibility of PLS makes it able to interpret the dependent and independent variables well by
establishing regression models. In this study, the PLS model was established with the SERS spectral
data as X and the content of SD as Y, whose best principal factor was determined by the root mean
square error of cross validation (RMSECV). In addition, all above-mentioned data analysis in this
study were performed on OMNIC v8.2 (Thermo Nicolet Corp., Madison, WI, USA), MATLAB R2014a
(The MathWorks, Inc., Natick, MA, USA), and Gaussian.v09 (Gaussian, Inc., Wallingford, CT, USA).
3.7. Model Evaluation Index
In this experiment, the modeling effect was evaluated by the coefficient of determination (R2 ),
the root mean square error (RMSE), relative standard deviation (RSD), and recovery rate. The coefficient
of determination R2 reflects the level of intimacy between variables and the RMSE reflects the model
accuracy. The lower the RMSE, and the closer the R2 is to 1, the better the performance of the prediction
model. In this study, Rc2 and Rp2 represent the coefficient of the determination of the calibration set
and the prediction set respectively, while RMSEC and RMSEP represent the root mean square error of
the calibration set and the prediction set, respectively [37,38]. In addition, relative standard deviation
(RSD) reflects the degree of discretization between individuals in the reflection group and recovery rate
reflects the degree of coincidence between the results of the reaction and the true value. The recovery
rate ranges closer to 100%, and the lower the RSD, the better the reliability of the model [39].
4. Conclusions
In this paper, we reported the rapid and quantitative determination of SD in cocktail based on
SERS with OTR 202. According to the results, we found that there was a good linear correlation between
Raman peak intensity at 1235, 1401, 1530, and 1584 cm−1 and logarithm of SD concentration in cocktail
with R2 from 0.9822 to 0.9860 in the range of 0.1–10 mg/L and the LOD could reach 0.1 mg/L. Also,
the determination coefficient (Rp2 ) for SD in cocktail in PLS model was great (0.9760 < Rp2 < 0.9856).
It was indicated that the rapid detection of SD by SERS was feasible and reliable. Overall, the SERS
method with OTR 202 enhancement developed through this study provide a novel, rapid, and accurate
approach to quantitatively determine SD in cocktail, which could meet the requirements of analysis
and detection of SD in other alcoholic beverages.
Author Contributions: This work presented here was carried out collaborations among all authors. L.L. and Y.H.
conceived the idea. L.L., F.Q., H.Z., B.C., Y.H., and P.N. worked together on associated data and carried out the
experimental work. L.L. drafted the manuscript. Y.H., P.N., F.Q., B.C., and H.Z. provided their experience and
co-wrote the paper with L.L. All authors contributed, reviewed, and improved the manuscript.Molecules 2019, 24, 1790 10 of 12
Funding: Major science and technology projects in Zhejiang (2015C02007) and National Key R&D program of
China (2018YFD0101002).
Conflicts of Interest: The authors declare no conflict of interest.
References
1. Cheitlin, M.D.; Hutter , A.M., Jr.; Brindis, R.G.; Ganz, P.; Kaul, S.; Russell, R.O., Jr.; Zusman, R.M.; Forrester, J.S.;
Douglas, P.S.; Faxon, D.P. Use of sildenafil (Viagra) in patients with cardiovascular disease. Circulation 1999,
99, 168–177. [CrossRef] [PubMed]
2. Behr-Roussel, D.; Oudot, A.; Caisey, S.; Coz, O.L.E.; Gorny, D.; Bernabé, J.; Wayman, C.; Alexandre, L.;
Giulianoc, F.A. Daily Treatment with Sildenafil Reverses Endothelial Dysfunction and Oxidative Stress in an
Animal Model of Insulin Resistance. Eur. Urol. 2008, 53, 1272–1281. [PubMed]
3. Fleshner, N.; Harvey, M.; Adomat, H.; Wood, C.; Eberding, A.; Hersey, K.; Guns, E. Evidence for contamination
of herbal erectile dysfunction products with phosphodiesterase type 5 Inhibitors. J. Urol. 2005, 174, 636–641.
[CrossRef] [PubMed]
4. Wullt, B.R.; Bergsten, G.R.; Fischer, H. Application of Laboratory Research in UTI. Eau Update 2004, 2, 116–124.
[CrossRef]
5. Dinesh, N.D.; Nagaraja, P.; Made Gowda, N.M.; Rangappa, K.S. Extractive spectrophotometric methods for
the assay of sildenafil citrate (Viagra) in pure form and in pharmaceutical formulations. Talanta 2002, 57,
757–764. [CrossRef]
6. Yaroshenko, D.V.; Grigoriev, A.V.; Sidorova, A.A.; Kartsova, L.A. Chromatographic determination of sildenafil
in blood plasma using spectrophotometric and mass-spectrometric detection. J. Analyt. Chem. 2013, 68,
801–808. [CrossRef]
7. Al-Hroub, H.; Alkhawaja, B.; Alkhawaja, E.; Arafat, T. Sensitive and rapid HPLC-UV method with
back-extraction step for the determination of sildenafil in human plasma. J. Chromatogr. B Analyt. Technol.
Biomed. Life Sci. 2016, 1009–1010, 1–6. [CrossRef] [PubMed]
8. Man, C.N.; Nor, N.M.; Lajis, R.; Harn, G.L. Identification of sildenafil, tadalafil and vardenafil by gas
chromatography–mass spectrometry on short capillary column. J. Chromatogr. A 2009, 1216, 8426–8430.
[CrossRef] [PubMed]
9. Bitsika, V.; Duveau, V.; Simon-Areces, J.; Mullen, W.; Roucard, C.; Makridakis, M.; Mermelekas, G.;
Savvopoulos, P.; Depaulis, A.; Vlahou, A. High-Throughput LC-MS/MS Proteomic Analysis of a Mouse
Model of Mesiotemporal Lobe Epilepsy Predicts Microglial Activation Underlying Disease Development.
J. Proteome Res. 2016, 15, 1546. [CrossRef] [PubMed]
10. Campillo, N.; Marín, J.; Fenoll, J.; Garrido, I.; López-García, I.; Hernández-Córdoba, M.; Viñas, P.
Determination of synthetic phosphodiesterase-5 inhibitors by LC-MS 2 in waters and human urine submitted
to dispersive liquid-liquid microextraction. Talanta 2017, 174, 638–644. [CrossRef]
11. Reddy, T.S.; Reddy, A.S.; Devi, P.S. Quantitative determination of sildenafil citrate in herbal medicinal
formulations by high-performance thin-layer chromatography. Jpc J. Planar Chromatogra. Modern Tlc 2007, 19,
427–431. [CrossRef]
12. Liu, Y.R.; Hai-Sheng, G.E.; Zhao, K.H.; Ling, Y.U.; Zhang, C. Determination of sildenafil citrate added in
traditional Chinese medicines and health care products by thin layer chromatographic surface-enhanced
Raman spectroscopic method. Chin. J. Pharm. Anal. 2014, 34, 1241–1246.
13. Nagdyman, N.; Fleck, T.; Bitterling, B.; Ewert, P.; Abdulkhaliq, H.; Stiller, B.; Hübler, M.; Lange, P.E.; Berger, F.;
Schulzeneick, I. Influence of intravenous sildenafil on cerebral oxygenation measured by near-infrared
spectroscopy in infants after cardiac surgery. Pediatr. Res. 2006, 59, 462–465. [CrossRef]
14. Fleck, T.P.K.; Nagdyman, N.; Schulzeneick, I.; Bitterling, B.; Ewert, P.; Abdulkhaliq, H.; Stiller, B.; Redlin, M.;
Huebler, M.; Lange, P.E. 87 Sildenafil Influence on Cerebral Oxygenation Measured by Near- Infrared
Spectroscopy in Infants After Cardiac Surgery. Pediatr. Res. 2004, 56, 478. [CrossRef]
15. Jiang, X. Simu taneous determination of 7 illegal components illegally added in traditional Chinese medicine
and health food by HPLC. Lishizhen Med. Mater. Med. Res. 2014, 25, 451–453.
16. Chee-Leong, K.; Xiaowei, G.; Min-Yong, L. Application of Orbitrap-mass spectrometry to differentiate
isomeric sildenafil- and thiosildenafil-like analogues used for the adulteration of dietary supplements.
Food Addit. Contam. Part A Chem. Anal. Control Expo. Risk Assess. 2015, 32, 1737–1748.Molecules 2019, 24, 1790 11 of 12
17. Tagami, T.; Takeda, A.; Asada, A.; Aoyama, A.; Doi, T.; Kajimura, K.; Sawabe, Y. Simultaneous identification
of hydroxythiohomosildenafil, aminotadalafil, thiosildenafil, dimethylsildenafil, and thiodimethylsildenafil
in dietary supplements using high-performance liquid chromatography-mass spectrometry. Food Hyg.
Saf. Sci. 2013, 54, 232–236. [CrossRef]
18. Huang, F.; Huiqin, W.U.; Huang, X.; Luo, H.; Zhu, Z.; Lin, X.; Liguo, M.A.; Jiang, Y. Simultaneous
determination of 17 aphrodisiac chemical drugs illegally added in health products and Chinese patent
medicines by high performance liquid chromatography-tandem mass spectrometry. Chin. J. Chromatogr.
2016, 34, 270–278. [CrossRef]
19. Ying, Z.; Zhiqiang, H.; Li, D.; Hongfei, Y.; Meiling, W.; Shaohua, Z. Simultaneous determination of
yohimbine, sildenafil, vardenafil and tadalafil in dietary supplements using high-performance liquid
chromatography-tandem mass spectrometry. J. Sep. Sci. 2015, 33, 2109–2114.
20. Fu, Y.; Kuppe, C.; Valev, V.K.; Fu, H.; Zhang, L.; Chen, J. Surface Enhanced Raman Spectroscopy: A Facile and
Rapid Method for the Chemical Components Study of Individual Atmospheric Aerosol. Environ. Sci. Technol.
2017, 51, 6260–6267. [CrossRef]
21. Huiyuan, G.; Zhiyun, Z.; Baoshan, X.; Arnab, M.; Craig, M.; White, J.C.; Lili, H. Analysis of Silver Nanoparticles
in Antimicrobial Products Using Surface-Enhanced Raman Spectroscopy (SERS). Environ. Sci. Technol. 2015,
49, 4317.
22. Doering, W.E.; Nie, S. Single-Molecule and Single-Nanoparticle SERS: Examining the Roles of Surface Active
Sites and Chemical Enhancement. J. Phys. Chem. B 2002, 106, 311–317. [CrossRef]
23. Hang, Z.; Hasi, W.; Lin, B.; Han, S.; Sha, X.; Jia, S.; Lou, X.; Lin, D.; Lv, Z. Rapid Detection of Sildenafil Drugs
in Liquid Nutraceuticals Based on Surface-Enhanced Raman Spectroscopy Technology. Chin. J. Chem. 2017,
35, 1522–1528.
24. Wang, H.; Lingling, L.I.; Chen, H.; Zeng, Y.; Chen, H.; Chen, Q.; Lin, H.; Tian, Z.; Liu, G. Application of
Surface-enhanced Raman Spectroscopy in the Fast Screening of Phosphodiesterase Type 5 Inhibitors. Chem. J.
Chin. Univ. 2017, 38, 1040–1045.
25. Yu, S.; Liu, Z.; Wang, W.; Jin, L.; Xu, W.; Wu, Y. Disperse magnetic solid phase microextraction and surface
enhanced Raman scattering (Dis-MSPME-SERS) for the rapid detection of trace illegally chemicals. Talanta
2017, 178, 498. [CrossRef]
26. Chermette, H. Chemical reactivity indexes in density functional theory. J. Comput. Chem. 2015, 20, 129–154.
[CrossRef]
27. Matysik, J.; Hildebrandt, P.; Smit, K.; Mark, F.; Gärtner, W.; Braslavsky, S.E.; Schaffner, K.; Schrader, B. Raman
spectroscopic analysis of isomers of biliverdin dimethyl ester. J. Pharm. Biomed. Anal. 1997, 15, 1319–1324.
[CrossRef]
28. Li, M.; Wang, J.; Du, F.; Diallo, B.; Xie, G.H. High-throughput analysis of chemical components and theoretical
ethanol yield of dedicated bioenergy sorghum using dual-optimized partial least squares calibration models.
Biotechnol. Biofuels 2017, 10, 206. [CrossRef]
29. Ipatov, A.; Cordova, F.; Doriol, L.J.; Casida, M.E. Excited-state spin-contamination in time-dependent
density-functional theory for molecules with open-shell ground states. J. Mol. Struct. 2009, 914, 60–73.
[CrossRef]
30. Kang, X.; Huang, J.; Yun, Q.S.; Yan, L. A DWT-DFT composite watermarking scheme robust to both affine
transform and JPEG compression. IEEE Trans. Circuits Syst. Video Technol. 2003, 13, 776–786. [CrossRef]
31. Suman, S.; Jha, R.K. A new technique for image enhancement using digital fractional-order Savitzky–Golay
differentiator. Multdim. Syst. Sign. P. 2017, 28, 1–25. [CrossRef]
32. Fearn, T.; Riccioli, C.; Garrido-Varo, A.; Guerrero-Ginel, J.E. On the geometry of SNV and MSC. Chemom. Intell.
Lab. Syst. 2009, 96, 22–26. [CrossRef]
33. Hsiao-Ping, H.; Kurt, B.; Wolfgang, P. How to define variation of physical properties normal to an undulating
one-dimensional object. Phys. Rev. Lett. 2009, 103, 198301.
34. Zhang, X.; Liu, F.; He, Y.; Li, X. Application of Hyperspectral Imaging and Chemometric Calibrations for
Variety Discrimination of Maize Seeds. Sensors 2012, 12, 17234–17246. [CrossRef]
35. Durán-Merás, I.; Pena, A.; Muńoz De La, A.; Espinosa-Mansilla, A.; Salinas, F. Multicomponent determination
of flavour enhancers in food preparations by partial least squares and principal component regression
modelling of spectrophotometric data. Analyst 1993, 118, 807–813.Molecules 2019, 24, 1790 12 of 12
36. Ali, F.; Rasoolimanesh, S.M.; Sarstedt, M.; Ringle, C.; Ryu, K. An assessment of the use of partial least squares
structural equation modeling (PLS-SEM) in hospitality research. Soc. Sci. Electron. Publ. 2017, 30, 514–538.
[CrossRef]
37. D’Acqui, L.P.; Pucci, A.; Janik, L.J. Soil properties prediction of western Mediterranean islands with similar
climatic environments by means of mid-infrared diffuse reflectance spectroscopy. Eur. J. Soil Sci. 2010, 61,
865–876. [CrossRef]
38. He, Y.; Xiao, S.; Nie, P.; Dong, T.; Qu, F.; Lin, L. Research on the Optimum Water Content of Detecting Soil
Nitrogen Using Near Infrared Sensor. Sensors 2017, 17, 2045. [CrossRef]
39. Parsons, H.M.; Ekman, D.R.; Collette, T.W.; Viant, M.R. Spectral relative standard deviation: A practical
benchmark in metabolomics. Analyst 2009, 134, 478–485. [CrossRef]
Sample Availability: Samples of the compounds are not available from the authors.
© 2019 by the authors. Licensee MDPI, Basel, Switzerland. This article is an open access
article distributed under the terms and conditions of the Creative Commons Attribution
(CC BY) license (http://creativecommons.org/licenses/by/4.0/).You can also read