Detection of Safe Passage for Trains at Rail Level Crossings Using Deep Learning
←
→
Page content transcription
If your browser does not render page correctly, please read the page content below
sensors
Article
Detection of Safe Passage for Trains at Rail Level Crossings
Using Deep Learning
Teresa Pamuła              and Wiesław Pamuła *

                                          Department of Transport Systems, Traffic Engineering and Logistics, Faculty of Transport and Aviation
                                          Engineering, Silesian University of Technology, Krasińskiego 8, 40-019 Katowice, Poland; Teresa.Pamula@polsl.pl
                                          * Correspondence: Wieslaw.Pamula@polsl.pl

                                          Abstract: The detection of obstacles at rail level crossings (RLC) is an important task for ensuring
                                          the safety of train traffic. Traffic control systems require reliable sensors for determining the state of
                                          anRLC. Fusion of information from a number of sensors located at the site increases the capability
                                          for reacting to dangerous situations. One such source is video from monitoring cameras. This paper
                                          presents a method for processing video data, using deep learning, for the determination of the state
                                          of the area (region of interest—ROI) vital for a safe passage of the train. The proposed approach is
                                          validated using video surveillance material from a number of RLC sites in Poland. The films include
                                          24/7 observations in all weather conditions and in all seasons of the year. Results show that the recall
                                          values reach 0.98 using significantly reduced processing resources. The solution can be used as an
                                          auxiliary source of signals for train control systems, together with other sensor data, and the fused
                                          dataset can meet railway safety standards.

                                          Keywords: rail level crossing; convolutional neural network; scene classification; traffic control


Citation: Pamuła, T.; Pamuła, W.
Detection of Safe Passage for Trains at   1. Introduction
Rail Level Crossings Using Deep
Learning. Sensors 2021, 21, 6281.
                                                The safety of rail level crossings is the focus point of many activities of railway agen-
https://doi.org/10.3390/s21186281
                                          cies [1]. Reports show that nearly a third of fatalities that are recorded in the course of
                                          operation of railways occur at RLCs [2]. Activities include changes in the construction of the
Academic Editors: Michal Choras,          sites and the introduction of sensing systems for surveillance of the rail tracks and road lanes.
Rafal Kozik and Marek Pawlicki                  Sensing systems may incorporate monitoring cameras, depth cameras, thermal cam-
                                          eras, radar, ultrasonic and LIDAR (light detection and ranging) sensors [3–6]. The devices
Received: 28 August 2021                  provide a wide spectrum of information about the traffic at the RLC.
Accepted: 10 September 2021                     The problem is to reliably determine the state of the RLC using the least processing
Published: 18 September 2021              resources so as to enable an efficient integration of the solution with existing traffic control
                                          systems. Multiple sensing systems increase the reliability of operation when their outputs are
Publisher’s Note: MDPI stays neutral      combined. It is advantageous to utilize all sources of information for determining the state.
with regard to jurisdictional claims in         Monitoring cameras are an important source of data but are usually used only for
published maps and institutional affil-   recording incidents at RLCs. This gives a reason to work out a solution that uses the video
iations.                                  stream contents as an input for determination of the RLC state.
                                                Safe passage of a train through an RLC is only possible when there are no obstacles on
                                          the tracks orin their vicinity. Atraffic control system requires a signal indicating the state of
                                          the RLC. The goal of processing the video stream is to detect obstacles or to classify the
Copyright: © 2021 by the authors.         rail tracks as free of them. Changing light conditions strongly influence the efficiency of
Licensee MDPI, Basel, Switzerland.        traditional image processing approaches for attaining this goal.
This article is an open access article          Deep-learning-based methods have proven successful for processing images recorded
distributed under the terms and           in highly changing light conditions [7]. This approach is used in this study to determine
conditions of the Creative Commons        the state of the RLC. The goal is set to classify the area of the RLC using an appropriately
Attribution (CC BY) license (https://     tuned and trained CNN.
creativecommons.org/licenses/by/                The main contributions of the authors are:
4.0/).

Sensors 2021, 21, 6281. https://doi.org/10.3390/s21186281                                                      https://www.mdpi.com/journal/sensors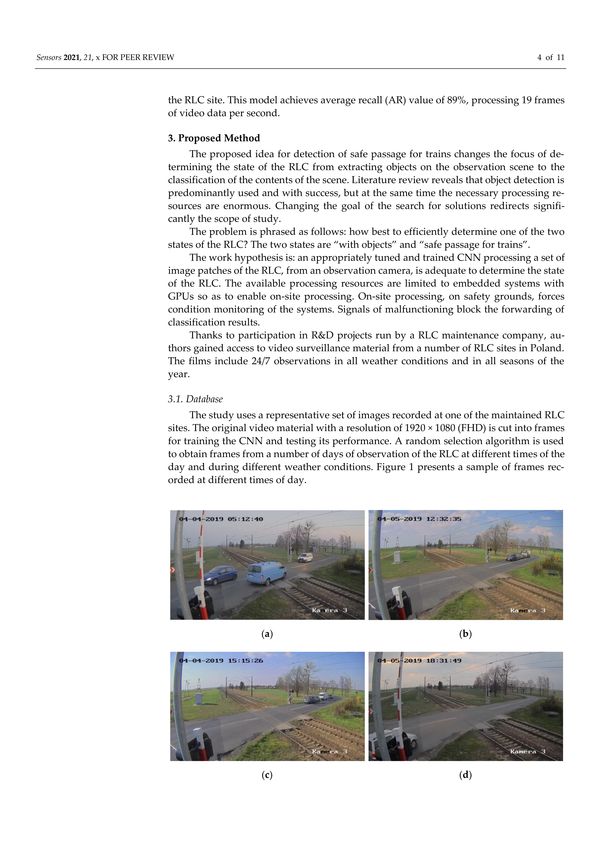
Sensors 2021, 21, 6281                                                                                           2 of 11

                         •    design of a detection method for determining the state of the RLC without detecting
                              obstacles in the area between gates,
                         •    design of CNN for the classification of the content of image patches of the RLC area
                              and thus, the determination of its occupancy instead of detecting obstacles in the area,
                         •    validation of the design using a set of films monitoring the functioning of RLCs at
                              different sites.
                              The reduction of the complexity of processing video data permits a hardware solution
                         thatcan be integrated with camera setups.
                              The rest of this paper is organized as follows. A review of related works is presented
                         in Section 2. The next section introduces the proposed method of determining an empty
                         RLC. Validation course and results are discussed in Section 4, and, lastly, conclusions and
                         provisions for future work are presented

                         2. Related Works
                              Studies related to determining the state of RLC concentrate on the detection of inci-
                         dents or obstacles using different sensor technologies. An incident or an obstacle signifies a
                         busy RLC thatcoincides with the state of there being no way through the RLC for the train.
                              Image-based approaches implement well-investigated image processing methods, such
                         as background subtraction [8]. The crucial step in background subtraction is the design of the
                         background model thatis updated with incoming video data. The complexity of the model
                         determines the required resources for implementing it and its detection performance.
                              Authors in [9] report a five-frame background subtraction model with variance analysis
                         adapted to the specifics of RLC sites. The model is tested using images of hazardous
                         conditions at RLCs such as pedestrian crossing and stopped vehicles. Results show that the
                         introduction of pixel intensity variance analysis makes it more robust to environmental noise.
                              An obstacle-detection system utilizing stereo cameras is presented in [10]. The design
                         of the background model is based on colour independent component (ICA) technique.
                         The idea of ICA is to restore statistically independent source signals, given only observed
                         output signals without knowing the mixing matrix; in this case, these are the pixel values.
                         Extraction of objects using background subtraction is done in the first step, and next, a
                         carefully developed robust stereo-matching algorithm is used for localizing, in 3D, their
                         positions at the RLC.
                              Observation of the RLC using thermal cameras greatly reduces the impact of changing
                         light conditions, especially glare effects. This feature is highly desired but thermal sensors
                         have much lower resolutions than standard camera sensors. The problem of designing
                         a background model disappears as the thermal inertia of the environment is very high.
                         Pavlovic et al. propose [5] a solution in this domain. Obstacleboundaries are obtained
                         using Canny edge detector. The edge image is thresholded and a morphological closing is
                         applied to close the gaps between edge segments. The result is a set of detected obstacles.
                         The positions of these are estimated using the homography matrix of the camera.
                              The problem of reducing the volume of video data for processing is addressed in [11].
                         The authors introduce an algorithm for dynamic multi-scale region processing for detecting
                         intruders at railway surveillance sites. Downsampled images are used for finding candidate
                         regions with intrusion targets, while the image data at full resolution in the candidate
                         regions is used to identify the targets using background subtraction.
                              Background subtraction methods suffer from imperfections of modelling changing
                         light conditions, and the results of determining the state of RLCs exposed to highly un-
                         determined light changes are not always satisfactory. Artificial intelligence (AI) methods
                         bring more robust solutions but at the cost of much higher processing power requirements.
                         The search is for AI solutions optimized to the specifics of the posed problem. In this case,
                         the domain of deep learning methods reasonably limits the scope of AI solutions.
                              Deep learning based methods are used in multiple transportation applications [12,13].
                         Deep learning algorithms use convolutional neural networks designed for processing
                         structured arrays of data, such as images [14]. CNNs are widely adopted in the applications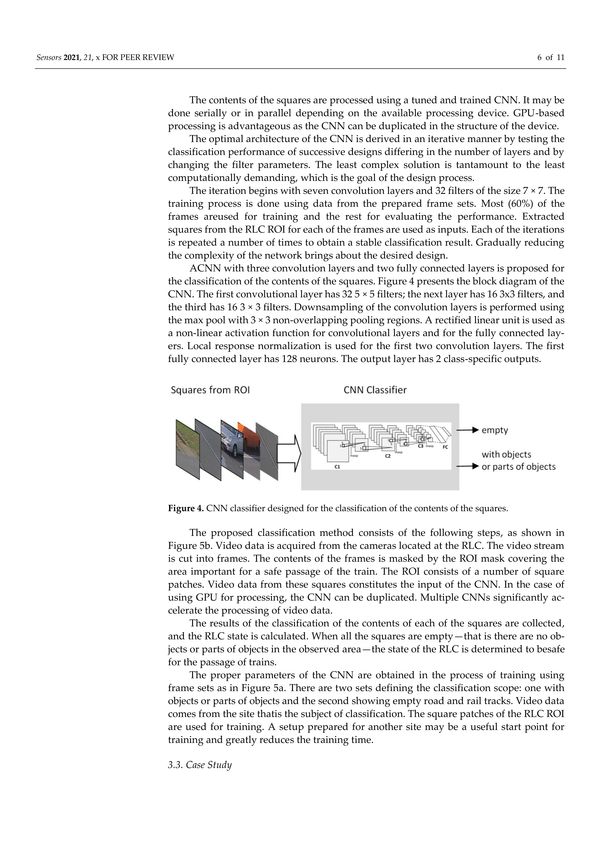
Sensors 2021, 21, 6281                                                                                          3 of 11

                         of video classification. A typical CNN consists of a convolutional layer whose goal is to
                         extract pixel patterns throughout the training instances. It consists of multiple kernel
                         filters that are applied to the contents of the image and transform the pixel values into
                         higher-level descriptions [15–17].
                               The idea of using a CNN for classification exploits the higher=level descriptions
                         for deriving the classification result. This implies that the input—image as a whole, is
                         processed. When the contents of the image include a complex object with many features
                         or a number of objects, a way of localizing the features or these objects is introduced to
                         improve performance.
                               Regions with CNN features (R-CNN) presented in [18] define a set of region proposals
                         selected from the image using a selective search algorithm. Each region constitutes a CNN
                         input. The extracted features are fed into a support vector machine (SVM) to classify the
                         object in the region proposal.
                               The drawback of this approach is a large number of region proposals thatneed to be
                         processed using CNNs so it requires manyresources to reach real-time operation. Proposed
                         modifications Fast-RCNN [19] and Faster-RCNN [20] introduce modifications thatradically
                         reduce the number of processing operations. The Fast-RCNN algorithm performs region
                         selection on the convolutional feature map thatis the result of inputting the whole image
                         to a CNN. The Faster-CNN omits the region selective search step and uses an additional
                         network to predict region proposals.
                               Region-processing-based approaches are hard to optimize because each step of the
                         algorithms is usually tuned and trained separately. J. Redmon et al. proposed a (YOLO)
                         you only look once algorithm [21] based on a single neural network thatpredicts bounding
                         boxes and class probabilities directly from the whole image. The image is split into a grid
                         where a number of bounding boxes is defined. The network outputs class probabilities for
                         the boxes. Class probability above a threshold is selected and used to locate the objects
                         within the image. Modifications of YOLO are being developed.
                               P. Sikora et al. propose YOLOv3 [22] for the classification and detection of the status
                         of equipment mounted at RLC, that is barriers, traffic lights and warning lights. The
                         processing is done using a GPU and reaches an average classification precision of over 96%.
                         The authors test performance using several video recordings at different RLC sites. The
                         solution is capable of working in real-time.
                               A lightweight CNN called BiMobileNet is presented in [23] for the classification of
                         remote sensing images. Abilinear model is implemented, in which two parallel CNNs are
                         used as feature extractors to obtain two deep features of the same image. MobileNetv2
                         is the backbone network for extracting features and provides data to the CNNs. The
                         processing is done using a GPU, and classification accuracy reaches 94%.
                               The practical implementation of obstacle detection solutions at RLC sites needs to
                         employ privacy-by-design and security-by-design best practices in order to secure all
                         communication interfaces. This leads to the tight integration of processing resources with
                         the data sources—cameras or sensors—forcing a search for less demanding processing
                         algorithms. An artificial-intelligence-based surveillance system for railway crossing traffic
                         (AISS4RCT) is a proposed system [24]. The YOLOv3-tiny model constitutes the base of the
                         system and uses GPU acceleration boards placed inside camera modules observing the
                         RLC site. This model achieves average recall (AR) value of 89%, processing 19 frames of
                         video data per second.

                         3. Proposed Method
                              The proposed idea for detection of safe passage for trains changes the focus of de-
                         termining the state of the RLC from extracting objects on the observation scene to the
                         classification of the contents of the scene. Literature review reveals that object detection
                         is predominantly used and with success, but at the same time the necessary processing
                         resources are enormous. Changing the goal of the search for solutions redirects significantly
                         the scope of study.
Sensors 2021, 21, 6281 4 of 11
The problem is phrased as follows: how best to efficiently determine one of the two
states of the RLC? The two states are “with objects” and “safe passage for trains”.
The work hypothesis is: an appropriately tuned and trained CNN processing a set
of image patches of the RLC, from an observation camera, is adequate to determine the
state of the RLC. The available processing resources are limited to embedded systems with
GPUs so as to enable on-site processing. On-site processing, on safety grounds, forces
condition monitoring of the systems. Signals of malfunctioning block the forwarding of
classification results.
Thanks to participation in R&D projects run by a RLC maintenance company, authors
gained access to video surveillance material from a number of RLC sites in Poland. The
films include 24/7 observations in all weather conditions and in all seasons of the year.
3.1. Database
The study uses a representative set of images recorded at one of the maintained RLC
sites. The original video material with a resolution of 1920 × 1080 (FHD) is cut into frames
for training the CNN and testing its performance. A random selection algorithm is used
to obtain frames from a number of days of observation of the RLC at different times of
the day and during different weather conditions. Figure 1 presents a sample of frames
recorded at different times of day.
Figure 1. RLC at different times of day: (a) morning, (b) midday, (c) afternoon, (d) evening.
Two frame sets are prepared: one with objects, cars, passing trains, bicycles and
pedestrians, the other with empty area between the gates of the RLC.
3.2. Determination of the RLC State
Limited processing resources determine the domain of the search for a solution. The
reduction of data for processing is proposed and is performedin two ways. First, a ROI is
defined, which covers only the area between the gates of the RLC. This area must be free
of objects when the train approaches and passes through the RLC, irrespective of the gate
states. Next, a square grid is introduced to reduce the input data for the CNN. The CNN
processes input data from the square patches restricted by the grid.Sensors 2021, 21, 6281 5 of 11
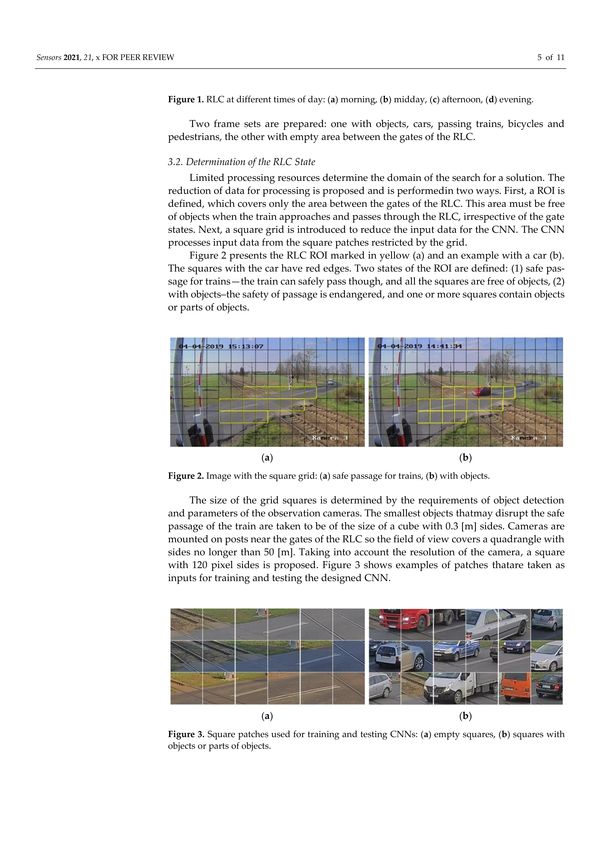
Figure 2 presents the RLC ROI marked in yellow (a) and an example with a car (b).
The squares with the car have red edges. Two states of the ROI are defined: (1) safe passage
for trains—the train can safely pass though, and all the squares are free of objects, (2) with
objects–the safety of passage is endangered, and one or more squares contain objects or
parts of objects.
Figure 2. Image with the square grid: (a) safe passage for trains, (b) with objects.
The size of the grid squares is determined by the requirements of object detection
and parameters of the observation cameras. The smallest objects thatmay disrupt the safe
passage of the train are taken to be of the size of a cube with 0.3 [m] sides. Cameras are
mounted on posts near the gates of the RLC so the field of view covers a quadrangle with
sides no longer than 50 [m]. Taking into account the resolution of the camera, a square with
120 pixel sides is proposed. Figure 3 shows examples of patches thatare taken as inputs for
training and testing the designed CNN.
Figure 3. Square patches used for training and testing CNNs: (a) empty squares, (b) squares with
objects or parts of objects.
The contents of the squares are processed using a tuned and trained CNN. It may
be done serially or in parallel depending on the available processing device. GPU-based
processing is advantageous as the CNN can be duplicated in the structure of the device.
The optimal architecture of the CNN is derived in an iterative manner by testing
the classification performance of successive designs differing in the number of layers and
by changing the filter parameters. The least complex solution is tantamount to the least
computationally demanding, which is the goal of the design process.
The iteration begins with seven convolution layers and 32 filters of the size 7 × 7. The
training process is done using data from the prepared frame sets. Most (60%) of the frames
areused for training and the rest for evaluating the performance. Extracted squares from
the RLC ROI for each of the frames are used as inputs. Each of the iterations is repeated a
number of times to obtain a stable classification result. Gradually reducing the complexity
of the network brings about the desired design.
ACNN with three convolution layers and two fully connected layers is proposed for
the classification of the contents of the squares. Figure 4 presents the block diagram of the
CNN. The first convolutional layer has 32 5 × 5 filters; the next layer has 16 3 × 3 filters,Sensors 2021, 21, 6281 6 of 11
and the third has 16 3 × 3 filters. Downsampling of the convolution layers is performed
using the max pool with 3 × 3 non-overlapping pooling regions. A rectified linear unit is
used as a non-linear activation function for convolutional layers and for the fully connected
layers. Local response normalization is used for the first two convolution layers. The first
fully connected layer has 128 neurons. The output layer has 2 class-specific outputs.
Figure 4. CNN classifier designed for the classification of the contents of the squares.
The proposed classification method consists of the following steps, as shown in
Figure 5b. Video data is acquired from the cameras located at the RLC. The video stream is
cut into frames. The contents of the frames is masked by the ROI mask covering the area
important for a safe passage of the train. The ROI consists of a number of square patches.
Video data from these squares constitutes the input of the CNN. In the case of using GPU
for processing, the CNN can be duplicated. Multiple CNNs significantly accelerate the
processing of video data.
Figure 5. Block diagram of the method for classification of the state of the RLC: (a) preparation of the
CNN, (b) determination of the state of the RLC.Sensors 2021, 21, 6281 7 of 11
The results of the classification of the contents of each of the squares are collected, and
the RLC state is calculated. When all the squares are empty—that is there are no objects or
parts of objects in the observed area—the state of the RLC is determined to besafe for the
passage of trains.
The proper parameters of the CNN are obtained in the process of training using frame
sets as in Figure 5a. There are two sets defining the classification scope: one with objects
or parts of objects and the second showing empty road and rail tracks. Video data comes
from the site thatis the subject of classification. The square patches of the RLC ROI are used
for training. A setup prepared for another site may be a useful start point for training and
greatly reduces the training time.
3.3. Case Study
The validation of the proposed method is done using surveillance data recorded
at one of the maintained RLC sites. The ROI as shown in Figure 2 contains 17 squares.
The database for training and testing the CNN contains 1000 frames randomly extracted
from the surveillance data. The frames are divided into two classes. Each class contains
500 elements. The training sets are prepared by cutting out squares in the defined ROI of
the RLC frames. In all, 17,000 squares are used for training and testing.
4. Results and Discussion
The designed CNN is trained using 60% of the database. A number of training
sessions aredone, and the best performing set of parameters is saved as the basis for the
end construction of the CNN. The tests of the network are carried out using the rest of the
database and the saved set of parameters.
Figure 6 shows examples of RLC classification. Squares with small objects, as well as
with large and multiple objects, are correctly classified. All examples signify that the state
of the RLC does not allow a safe passage for a train.
Figure 6. RLC state (a) “safe passage for trains”, (b) “with objects”. Red edges signify that the square contains objects.
Table 1 presents the RLC states’ determination results. Separate calculations are done
for each of the states in order to determine which output is “safer” for controlling the
rail traffic. Determining the state of RLC is closely related to securing the safety of its
functioning. Monitoring cameras are usually additional sources of data for detection of
risk threats.
precision = TPTP + FN
recall = TPTP + FP (1)
2· precision·recall
F1 = precision+recallSensors 2021, 21, 6281 8 of 11
Table 1. Determination of the RLC states using CNN.
RLC States Precision Recall F1
with objects 0.98 0.94 0.96
safe passage for trains 0.94 0.98 0.96
The results are calculated using Equation (1), where TP is the number of correctly
determined states of the RLC when the RLC is in state X; FP is the number of falsely
detected states of the RLC when the RLC is in state X, and FN is the number of falsely
determined states when the RLC is not in the state X.
Precision is the estimated probability that the RLC is determined as being in state X
when the classifier works. Recall is the estimated probability that the RLC is determined as
being in state X and RLC is in state X.
The determination result “safe passage for trains” has a higher recall value than “with
objects”. This indicates that generating the signal for train control systems based on this
class result is more justified.
The value of F1- balanced F score is equal for both classes, which signifies a balanced
performance of the CNN classifier.
The problem of classification of the squares can be transformed to classification of
compressed representations of the contents of the squares. In the domain of deep learning,
this is done using autoencoder neural networks. An autoencoder attempts to replicate
its input at its output. Reducing the number of neurons in the hidden layer forces the
autoencoder to learn a compressed representation of the input [25–28].
A two-layer autoencoder network is tested as a substitute of the CNN for comparison
of performance. The first autoencoder transforms the vector of square pixels into a set of
detail features. The autoencoder of the second layer reduces these features to a smaller set.
The outputs are processed by a Softmax classification layer.
The autoencoder neural network is trained and tested using the same database as in
the case of the CNN. Several configurations are tested using a different number of neurons
in the first autoencoder. The properties of this autoencoder determine the effectiveness of
the network.
The optimal structure consists of 400 neurons in the first layer and 100 in the second.
The classification performance is presented in Table 2. An important difference must be
noted that is poor precision indetecting “safe passage for trains”. This signifies difficulties
in finding features for the classification of empty squares.
Table 2. Determination of the RLC states using autoencoders.
RLC States Precision Recall F1
with objects 0.99 0.79 0.84
safe passage for trains 0.73 0.99 0.88
The F1- balanced F score is much smaller than for the CNN, and it differs for the two
classes. This performance indicates problems in distinguishing object parts and patches of rail
and road. Such patches have similar features to some objects parts, which may be misleading.
A comparison of the results is done with a classification system using BoF (bag of
features) and SVM (support vector machine), which is an approach prevailing in many
image classification tasks not based on deep learning [29–31].
The image content is represented using SURF (speeded-up robust features) feature
vectors. The feature vectors are clustered using K-means algorithm. The centroids of these
clusters are the elements of BoF. The normalized histogram of the quantized features is the
BoF model representation of the image content. SVM algorithm is used to determine the
decision boundaries between the classes.
The same database is used for testing and assessing the classification performance.
Table 3 presents asummary of the results. The classification performance is not significantlySensors 2021, 21, 6281 9 of 11
worse than in the case of the CNN. The precision of classification of the state “with objects”
is 0.07 worse, whereas the recall value is 0.02 smaller. In the case of the BoF classification
the signal for train control systems needs to be derived from the RLC state “with objects”.
Table 3. Determination of the RLC states using BoF.
RLC States Precision Recall F1
with objects 0.91 0.96 0.93
safe passage for trains 0.96 0.91 0.93
The value of F1 score is equal for both classes, which signifies a balanced performance
of the BoF classifier.
The determination of the state “safe passage for trains” is more sensitive to square
classification errors, as not one out of the tens of squares covering the RLC may be classified
as containing objects or parts.
The course of the validation and comparison with other solutions shows that some
modifications to the determination of the RLC state can be introduced. The use of a fixed
grid of squares leads to the processing of squares, which only in part are important for train
passage. The introduction of overlapping squares, especially at the road edges, can bring
some processing redundancy but will eliminate errors related to the wrong classification of
content irrelevant to the RLC state.
The camera provides a perspective view of the RLC, in which the nearest objects are
mapped by a large number of pixels, whereas at the far end of the RLC, not much detail
is visible. The size of the squares can vary depending on the placement in relation to the
camera. This idea requires a number of CNNs adapted to the set of square sizes.
5. Conclusions
The determination of the state of the area between the gates of the RLC using deep
learning, for signalling a safe passage for trains, proves successful. Determination results
fall in the range of results noted in the literature review. The proposed solution using a
CNN with only three convolution layers is much less complicated, especially in comparison
with YOLO-based solutions thatcontain more than 50 neural network layers.
The proposed solution significantly reduces the required processing resources for
detection of safe passage for trains. The solution can be used as an auxiliary source of
signals for train control systems, together with other sensor data, and the fused dataset can
meet the railway safety standards.
The solution may be useful for monitoring the state of road junctions for signalling
risk situations in ITS systems.
Future work will focus on efficient implementation of the method using GPU-based
embedded processing systems integrated with observation camera modules [32].
Author Contributions: Conceptualization, T.P. and W.P.; methodology, T.P..; software, T.P.; validation,
T.P.; formal analysis, W.P.; investigation, T.P.; resources, W.P.; data curation, W.P.; writing—original
draft preparation, T.P.; writing—review and editing, W.P.; visualization, T.P.; supervision, T.P. All
authors have read and agreed to the published version of the manuscript.
Funding: This research received no external funding.
Institutional Review Board Statement: Not applicable.
Informed Consent Statement: Not applicable.
Data Availability Statement: The data presented in this study are available on request from the
corresponding author. The data are not publicly available due to privacy protection.
Acknowledgments: The authors express thanks to the RLC maintenance company for access to
video surveillance material from a number of RLC sites and would also like to express their sincere
thanks to the editors and the anonymous reviewers for their valuable comments and contributions.Sensors 2021, 21, 6281 10 of 11
Conflicts of Interest: The authors declare no conflict of interest.
References
1. Read, G.J.; Cox, J.A.; Hulme, A.; Naweed, A.; Salmon, P.M. What factors influence risk at rail level crossings? A systematic review
and synthesis of findings using systems thinking. Saf. Sci. 2021, 138, 105207. [CrossRef]
2. European Union Agency for Railways. Safety Overview 2021. Available online: https://www.era.europa.eu/library/corporate-
publications_en (accessed on 10 August 2021).
3. Horne, D.; Findley, D.J.; Coble, D.G.; Rickabaugh, T.J.; Martin, J.B. Evaluation of radar vehicle detection at four quadrant gate rail
crossings. J. Rail Transp. Plan. Manag. 2016, 6, 149–162. [CrossRef]
4. Wisultschew, C.; Mujica, G.; Lanza-Gutierrez, J.M.; Portilla, J. 3D-LIDAR Based Object Detection and Tracking on the Edge of IoT
for Railway Level Crossing. IEEE Access 2021, 9, 35718–35729. [CrossRef]
5. Pavlović, M.G.; Ciric, I.; Ristic-Durrant, D.; Nikolić, V.D.; Simonović, M.B.; Ćirić, M.V.; Banić, M.S. Advanced thermal camera
based system for object detection on rail tracks. Therm. Sci. 2018, 22, 1551–1561. [CrossRef]
6. Cai, H.; Li, F.; Gao, D.; Yang, Y.; Li, S.; Gao, K.; Qin, A.; Hu, C.; Huang, Z. Foreign Objects Intrusion Detection Using Millimeter
Wave Radar on Railway Crossings. In Proceedings of the 2020 IEEE International Conference on Systems, Man, and Cybernetics
(SMC), Toronto, ON, Canada, 11–14 October 2020; pp. 2776–2781.
7. Voulodimos, A.; Doulamis, N.; Doulamis, A.; Protopapadakis, E. Deep Learning for Computer Vision: A Brief Review. Comput.
Intell. Neurosci. 2018, 2018, 7068349. [CrossRef]
8. Garcia-Garcia, B.; Bouwmans, T.; Silva, A.J.R. Background subtraction in real applications: Challenges, current models and future
directions. Comput. Sci. Rev. 2020, 35, 100204. [CrossRef]
9. Gajbhiye, P.; Naveen, C.; Satpute, V.R. VIRTUe: Video surveillance for rail-road traffic safety at unmanned level crossings;
(Incorporating Indian scenario). In Proceedings of the 2017 IEEE Region 10 Symposium (TENSYMP), Cochin, India, 14–16 July
2017; pp. 1–4. [CrossRef]
10. Fakhfakh, N.; Khoudour, L.; El-Koursi, E.; Bruyelle, J.L.; Dufaux, A.; Jacot, J. 3D Objects Localization Using Fuzzy Approach and
Hierarchical Belief Propagation: Application at Level Crossings. EURASIP J. Image Video Process 2011, 2011, 548604. [CrossRef]
11. Li, C.; Xie, Z.; Qin, Y.; Jia, L.; Chen, Q. A multi-scale image and dynamic candidate region-based automatic detection of foreign
targets intruding the railway perimeter. Measurement 2021, 185, 109853. [CrossRef]
12. Wang, Y.; Zhang, D.; Liu, Y.; Dai, B.; Lee, L.H. Enhancing transportation systems via deep learning: A survey. Transp. Res. Part
CEmerg. Technol. 2019, 99, 144–163. [CrossRef]
13. He, D.; Zou, Z.; Chen, Y.; Liu, B.; Yao, X.; Shan, S. Obstacle detection of rail transit based on deep learning. Measurement 2021, 176,
109241. [CrossRef]
14. Aziz, L.; Salam, S.B.H.; Sheikh, U.U.; Ayub, S. Exploring Deep Learning-Based Architecture, Strategies, Applications and Current
Trends in Generic Object Detection: A Comprehensive Review. IEEE Access 2020, 8, 170461–170495. [CrossRef]
15. Maggiori, E.; Tarabalka, Y.; Charpiat, G.; Alliez, P. Convolutional Neural Networks for Large-Scale Remote-Sensing Image
Classification. IEEE Trans. Geosci. Remote. Sens. 2017, 55, 645–657. [CrossRef]
16. Cai, Z.; Fan, Q.; Feris, R.S.; Vasconcelos, N. A unified multi-scale deep convolutional neural network for fast object detection. In
Proceedings of the European Conference on Computer Vision, Amsterdam, The Netherlands, 11–14 October 2016; pp. 354–370.
[CrossRef]
17. Translator, A.; Sutskever, I.; Hinton, G.E. ImageNet classification with deep convolutional neural networks. Commun. ACM 2017,
60, 84–90. [CrossRef]
18. Girshick, R.; Donahue, J.; Darrell, T.; Malik, J. Rich Feature Hierarchies for Accurate Object Detection and Semantic Segmentation.
In Proceedings of the IEEE Conference on Computer Vision and Pattern Recognition, Columbus, OH, USA, 24–27 June 2014;
pp. 580–587. [CrossRef]
19. Girshick, R. Fast R-CNN. In Proceedings of the IEEE International Conference on Computer Vision, Las Condes, Chile, 11–18
December 2015; pp. 1440–1448. [CrossRef]
20. Ren, S.; He, K.; Girshick, R.; Sun, J. Faster R-CNN: Towards Real-Time Object Detection with Region Proposal Networks. IEEE
Trans. Pattern Anal. Mach. Intell. 2017, 39, 1137–1149. [CrossRef]
21. Redmon, J.; Divvala, S.; Girshick, R.; Farhadi, A. You Only Look Once: Unified, Real-Time Object Detection. In Proceedings of the
IEEE Conference on Computer Vision and Pattern Recognition (CVPR), Las Vegas, NV, USA, 26 June–1 July 2016; pp. 779–788.
[CrossRef]
22. Sikora, P.; Kiac, M.; Dutta, M.K. Classification of railway level crossing barrier and light signalling system using YOLOv3.
In Proceedings of the 2020 43rd International Conference on Telecommunications and Signal Processing (TSP), Milan, Italy,
6–8 July 2020; pp. 528–532.
23. Yu, D.; Xu, Q.; Guo, H.; Zhao, C.; Lin, Y.; Li, D. An Efficient and Lightweight Convolutional Neural Network for Remote Sensing
Image Scene Classification. Sensors 2020, 20, 1999. [CrossRef] [PubMed]
24. Sikora, P.; Malina, L.; Kiac, M.; Martinasek, Z.; Riha, K.; Prinosil, J.; Jirik, L.; Srivastava, G. Artificial Intelligence-Based Surveillance
System for Railway Crossing Traffic. IEEE Sensors J. 2021, 21, 15515–15526. [CrossRef]
25. Ohri, K.; Kumar, M. Review on self-supervised image recognition using deep neural networks. Knowl. Based Syst. 2021, 224,
107090. [CrossRef]Sensors 2021, 21, 6281 11 of 11
26. Dairi, A.; Harrou, F.; Senouci, M.; Sun, Y. Unsupervised obstacle detection in driving environments using deep-learning-based
stereovision. Robot. Auton. Syst. 2018, 100, 287–301. [CrossRef]
27. Pamula, T. Impact of Data Loss for Prediction of Traffic Flow on an Urban Road Using Neural Networks. IEEE Trans. Intell.
Transp. Syst. 2018, 20, 1000–1009. [CrossRef]
28. Singh, D.; Mohan, C.K. Deep Spatio-Temporal Representation for Detection of Road Accidents Using Stacked Autoencoder. IEEE
Trans. Intell. Transp. Syst. 2018, 20, 879–887. [CrossRef]
29. Siddiqui, A.J.; Mammeri, A.; Boukerche, A. Real-Time Vehicle Make and Model Recognition Based on a Bag of SURF Features.
IEEE Trans. Intell. Transp. Syst. 2016, 17, 3205–3219. [CrossRef]
30. Varghese, A.; Sreelekha, G. An Efficient Algorithm for Detection of Vacant Spaces in Delimited and Non-Delimited Parking Lots.
IEEE Trans. Intell. Transp. Syst. 2020, 21, 4052–4062. [CrossRef]
31. Qasaimeh, M.; Sagahyroon, A.; Shanableh, T. FPGA-Based Parallel Hardware Architecture for Real-Time Image Classification.
IEEE Trans. Comput. Imaging 2015, 1, 56–70. [CrossRef]
32. Mittal, S. A Survey on optimized implementation of deep learning models on the NVIDIA Jetson platform. J. Syst. Arch. 2019, 97,
428–442. [CrossRef]You can also read