Graph-of-Tweets: A Graph Merging Approach to Sub-event Identification - arXiv
←
→
Page content transcription
If your browser does not render page correctly, please read the page content below
Graph-of-Tweets: A Graph Merging Approach to
                                                       Sub-event Identification
                                                                     Xiaonan Jing                                            Julia Taylor Rayz
                                                        Computer and Information Technology                       Computer and Information Technology
                                                                 Purdue University                                          Purdue University
                                                             West Lafayette, IN, USA                                   West Lafayette, IN, USA
                                                                  jing@purdue.edu                                         jtaylor1@purdue.edu

                                           Abstract—Graph structures are powerful tools for modeling        of linguistic elements. Depending on the needs, ”the graph
arXiv:2101.03208v1 [cs.CL] 8 Jan 2021

                                        the relationships between textual elements. Graph-of-Words          itself can represent different entities, such as a sentence,
                                        (GoW) has been adopted in many Natural Language tasks to            a single document, multiple documents or even the entire
                                        encode the association between terms. However, GoW provides
                                        few document-level relationships in cases when the connections      document collection. Furthermore, the edges on the graphs can
                                        between documents are also essential. For identifying sub-events    be directed or undirected, as well as associated with weights or
                                        on social media like Twitter, features from both word- and          not” [14]. Following this line of reasoning, we utilize a graph
                                        document-level can be useful as they supply different information   structure to combine both token- and tweet-level associations
                                        of the event. We propose a hybrid Graph-of-Tweets (GoT) model       in modeling Twitter events.
                                        which combines the word- and document-level structures for
                                        modeling Tweets. To compress large amount of raw data, we              Graph-of-Words (GoW) is a common method inspired by
                                        propose a graph merging method which utilizes FastText word         the traditional Bag-of-Words (BoW) representation. Typically,
                                        embeddings to reduce the GoW. Furthermore, we present a novel       the vertices in a GoW represent the BoW from a corpus.
                                        method to construct GoT with the reduced GoW and a Mutual           In addition, the edges encode the co-occurrence association
                                        Information (MI) measure. Finally, we identify maximal cliques      (i.e. the co-occurrence frequency) between the words in BoW.
                                        to extract popular sub-events. Our model showed promising
                                        results on condensing lexical-level information and capturing       Although the traditional GoW improved upon BoW to include
                                        keywords of sub-events.                                             word association information, it still fails to incorporate se-
                                           Index Terms—Twitter, event detection, word embedding,            mantic information. One may argue that, as previously men-
                                        graph, mutual information.                                          tioned, using a KG can effectively incorporate both semantic
                                                                                                            information and corpus level associations into the graph.
                                                              I. I NTRODUCTION                              However, any pre-existing KG, such as WordNet [15] and
                                           With Twitter and other types of social networks being the        FreeBase [16], cannot guarantee an up-to-date lexicon/entity
                                        mainstream platform of information sharing, an innumerable          collection. Therefore, we propose a novel vocabulary rich
                                        amount of textual data is generated every day. Social networks      graph structure to cope with the constantly changing real-time
                                        driven communication has made it easier to learn user interests     event modeling.
                                        and discover popular topics. An event on Twitter can be                In this paper, we employ a graph structure to model tokens,
                                        viewed as a collection of sub-events as users update new posts      tweets, and their relationships. To the best of our knowledge,
                                        through time. Trending sub-events can provide information           this is the first work to represent document level graphs
                                        on group interests, which can assist with learning group            with token level graphs in tweet representation. Our main
                                        behaviours. Previously, a Twitter event has been described as       contributions are the developments of 1) a novel GoT; 2) an
                                        a collection of hashtags [1], [2], a (set of) named entity [3],     unsupervised graph merging algorithm to condense token-level
                                        a Knowledge Graph (KG) triplet [4], or a tweet embedding            information; 3) an adjusted mutual information (MI) measure
                                        [5]. While these representations can illustrate the same Twitter    for conceptualized tweet similarities.
                                        event from various aspects, it can be argued that a KG triplet,
                                        which utilizes a graph structure, exhibits richer features than                          II. R ELATED W ORK
                                        the other representations. In other words, the graph structure         Various studies have adopted graph structures to assist with
                                        allows more semantic relationships between entities to be           unsupervised modeling of the diverse entity relationships.
                                        preserved. Besides KG, other NLP tasks such as word disam-             Event Clustering. Jin and Bai [17] utilized a directed GoW
                                        biguation [6], [7], text classification [8], [9], summarization     for long documents clustering. Each document was converted
                                        [10], [11], and event identification [12], [13] have also widely    to a graph with nodes, edges, edge weights representing word
                                        adopted graph structures. A graph G = (V, E) typically              features, co-occurrence, and co-occurrence frequencies respec-
                                        consists of a set of vertices V and a set of edges E which          tively. The similarity between documents was subsequently
                                        describes the relations between the vertices. The main benefit      converted to the similarity between the maximum common
                                        of a graph structure lies in its flexibility to model a variety     sub-graphs. With the graph similarity as a metric, K-means
clustering was applied to maximum common document graphs [17] conducted their clustering on dataset with category labels
to generate the clusters. Jinarat et al. [18] proposed a pretrained which allowed their unsupervised approach to be evaluated
Word2Vec embedding [19] based GoW edge removal approach with precision, recall, and F-scores. Meladianos et al. [20] was
for tweet clustering. They constructed an undirected graph able to generate labels through a sport highlight website ESPN
with nodes being the unique words in all tweets and edges as the sub-events contained in a soccer game exhibit simpler
being the similarity between the words. Token and tweet structure than most real-life events. Fedoryszak et al. [13]
clusters were created by removing edges below a certain created a evaluation subset from scratch with the help of the
similarity value. However, pretrained embeddings can be prone Twitter internal KG and manually examined their clustering
to rare words in tweets, where abbreviations and tags are a results. Both of the event summarization approaches adopted
popular means for delivering information. the classic metric ROUGE [27] score as well as the bench-
Event stream detection. Meladianos et al. [20] presented a marking dataset DUC.
similar graph of words approach in identifying sub-events of
a World Cup match on Twitter. They improved edge weight III. M ETHODOLOGY
metric by incorporating tweet length to global co-occurrence
frequency. The sub-events were generated by selecting tweets We propose the following (1) − (8) steps for sub-event
which contains the top k-degenerate subgraphs. Another effort identification (Figure 1). The dataset used in this paper was
by Fedoryszak et al. [13] considered an event stream as a collected from Twitter for a particular event (Section III-A).
cluster chain consisting of trending Twitter entities in time Step (1) includes tokenization and lemmatization with Stan-
order. The clusters were treated as nodes and the similarities ford CoreNLP and NLTK toolkit 1 , as well as removing
between them were labeled as edge weights. While a common stopwords, punctuations, links, and @ mentions. All processed
issue in entity comparison may be raised for the lack of texts are converted to lowercase. Steps (2) - (3) contribute
coverage limitation [3], Fedoryszak et al. [13] were able to to GoW construction (Section III-B). Step 4 performs our
overcome this issue through the help of an internal Twitter proposed GoW reduction method (Section III-C). Step (5)
KG. However, potential synonyms were not taken into account elaborates on Graph-of-Tweets (GoT) construction using MI
in the weights assignment. (Section III-D). Steps (6) - (8) finalize the subevents extraction
Summarization. Parveen and Strube [21] proposed an from the GoT (Section III-E).
entity and sentence based bipartite graph for multi-document
summarization, which utilized a Hyperlink-Induced Topic
(2) Train (3) Construct (4) Reduce
Search algorithm [22]. However, they only considered nouns (1) Process
FastText
Raw Tweets Token Graph Token Graph
in the graph and ignored other parts-of-speech from the docu- Model
ments. In another attempt, Nayeem and Chali [10] adopted the
TextRank algorithm [23] which employs a graph of sentences
(7) Identify (6) Extract
to rank similar sentence clusters. To improve from the crisp (8) Identify (5) Construct
Maximal Top MI
Sub-events Tweet Graph
token matching metric used by the algorithm, Nayeem and Cliques Subgraph
Chali [10] instead used the pretrained Word2Vec embeddings
[19] for sentence similarities. Fig. 1: 8-Step Framework Used in This Paper
Graph Construction. Glavas et al. [24] built a semantic
relatedness graph for text segmentation where the nodes
and edges denote sentences and relatedness of the sentences A. Dataset
respectively. They showed that extracting maximal cliques
was effective in exploiting structures of semantic relatedness Following a recent trend on social media, we collected data
graphs. In an attempt of automated KG completion, Szubert on ”COVID-19” from Twitter as our dataset. We define tweets
and Steedman [25] proposed a word embedding based graph containing the case-insensitive keywords {”covid”, ”corona”}
merging method in improvements of AskNET [26]. Similar to as information related to the ”COVID-19” event. We fetched
our merging approach, tokens were merged incrementally into 500,000 random tweets containing one of the keywords every
a pre-constructed KG based on word embedding similarities. day in the one month period from Feb 25 to Mar 25 and
The difference is that AskNET used a graph-level global kept only original tweets as our dataset. More specifically,
ranking mechanism while our approach considers a neighbor- retweets and quoted tweets were filtered out during the data
level local ranking for the tokens. Additionally, Szubert and cleaning process. The statistics of the processed dataset used
Steedman limited their scope to only named entity related for FastText model training can be found in Table I. Besides
relations during the graph construction. FastText training, which requires a large corpus to achieve
Evaluations of Event Identification. It should be noted accurate vector representations, we focused on a single day of
that there is no benchmark dataset for event identification data, the Feb 25 subset, for the rest of our experiment in this
evaluation, as many event identification approaches are un- paper.
supervised and that the event dataset varies by the research of
interests. Among the previously mentioned studies, Jin and Bai 1 Stanford CoreNLP ver. 3.9.2; NLTK ver. 3.4.5TABLE I: Statistics of the dataset on COVID-19 from Feb 25
”positive”(a) ”test”(b)
- Mar 25
number of tweets 1,289,004 wco bd wco bc ws bc
number of unique tokens 337,365 ws bd
number of tweets (Feb 25) 38,508 ”corona”(d) ”virus”(c)
number of unique tokens (Feb 25) 29,493
average tokens per tweet 12.85
standard deviation on tokens per tweet 6.89 Fig. 2: An example GoW for the processed tweets {”virus”,
”test”, ”positive”} and {”corona”, ”test”}. Solid and dotted
edges denote Eco and Es respectively.
B. Graph-of-Words Construction
We trained a word embedding model on the large 30- C. Graph-of-Words Reduction
day dataset as our word-level similarity measure in GoW
A raw GoW constructed directly from the dataset often
construction. Pretrained Word2Vec models [19] have been
contains a large number of nodes. Many of these nodes
applied previously to graphs as edge weights [8], [11], [18].
carry repeating information, which increases the difficulties
Trained on Google News corpus, Word2Vec is powerful in
of the subsequent tasks. To condense the amount of nodes,
finding context based word associations. Words appearing in
we propose a two-phase node merging method to reduce the
similar contexts will receive a higher cosine similarity score
proposed GoW:
based on the hypothesis that ”a word is characterized by the
• Phase I: Linear reduction by node merging based on word
company it keeps” [28]. However, the pretrained Word2Vec
model can only handle words within its vocabulary coverage. occurrence frequency.
• Phase II: Semantic reduction by node merging based on
In other words, if any low frequency words are ignored during
the training, they will not be captured in the model. In our token similarity.
case, the Twitter data contain many informal words, spelling Phase I. The goal of this phase is to reduce the number
mistakes, and new COVID-19 related words, which make pre- of nodes in the raw graph in a fast and efficient manner. For
trained model not suitable for our task. On the other hand, tokens that occur in less than 5 tweets, we merge them to its
FastText model [29] uses character n-grams to enrich word top similar token node in the graph. This phase is performed
representations when learning the word embeddings. Informal on nodes in the order of least frequently appearing to most
words such as ”likeee” can be denoted as a combination frequently appearing nodes.
of {”like”, ”ikee”, ”keee”} (4-gram), which its vector rep- Phase II. The goal of this phase is to combine frequent
resentation, after concatenating the subword vectors, will be tokens in the graph. Algorithm 1 describes this process. For
closer to the intended word ”like” given that both words
were used in similar contexts. Thus, we employ the FastText Algorithm 1 Semantic Node Collapse
word embeddings as the word-level similarity measure in for node vi ∈ V P : {v1 , v2 , ..., vm } do
our GoW construction. A skip-gram model with the Gensim m
degree di = 1 wco ij
implementation 2 was trained on the large 30-day dataset. end for
For the basic structure of the GoW, we adopt the approach V = sort asc(V, key = di )
from Meladianos et al. [20] where the vertices V represent the for vi ∈ V do
tokens and the edges Eco represent the co-occurrence of two sim neighbors = list()
tokens in a tweet. For k tweets in the corpus T : {t1 , t2 , ..., tk }, neighbors(vi ) = Bi : {vi1 , ..., viz }
the co-occurrence weight wco between the unique tokens v1 neighbor weights(vi ) = Wi : {wco i1 , ..., wco iz }
and v2 is computed as: Bi = sort asc(Bi , key = wco ij )
for vij ∈ Bi do
k
X 1 sim token = fasttext.most similar(vij , top n)
wco = (1)
ni − 1 if any other neighbor vik ∈ sim token then
i=1
sim neighbors.insert((vik , sim val))
where ni (ni > 1) denotes the number of unique tokens in end if
tweet ti that contains both token v1 and v2 . An edge eco is only parent = max(sim neighbors, key = sim val)
drawn when the token pair co-occur at least once. In addition node merge(src = vij , dst = parent)
to the base graph, we add another set of edges Es denoting the end for
cosine similarity ws between the token embeddings obtained end for
from FastText. Figure 2 illustrates an example GoW for two
processed tweets. a node in the GoW, we merge its lower weighed neighbor
into another neighbor if the top N similar token of the lower
2 Gensim ver. 3.8.1; hyperparameters (that differ from default): size: 300d, weighed neighbor contains another neighbor. It should be
alpha: 0.05, min alpha=0.0005, epoch: 30 addressed that the ordering of the node and the direction ofmerging matters in this process. For token nodes in the GoW, the total number of words in a corpus where word x and y
we perform this phase on nodes in the order of lowest degree co-occur.
to highest degree; and for neighbors of the same node, we p(x, y)
i(x, y) = log (2)
perform the phase on neighbors in the order of lowest weight p(x)p(y)
to highest weight. When the top N similar token contains more
than one other neighbors, we select the node with the highest f (x) f (y) f (x, y)
p(x) = , p(y) = , p(x, y) = (3)
similarity value as the parent node. W W W
The node merging process consists of removing original The drawbacks of PMI are: 1) low frequency word pairs tend
nodes, reconnecting edges between neighbors, and migrating to receive relatively higher scores; 2) PMI suffers from the
co-occurrence weights wco and merged tokens. Essentially, if a absence of boundaries in comparison tasks [31]. In an extreme
target node is merged into a parent node, the target node will case when x and y are perfectly correlated, the marginal
be removed from the graph and the neighbors of the target probabilities p(x) and p(y) will take the same value as the
node will be reconnected to the parent. It should be noted that joint probability p(x, y). In other words, when x and y only
when migrating neighbors and weights, we only consider the occur together, p(x, y) = p(x) = p(y), which will result
co-occurrence edge Es and only increment the weights wco i(x, y) in Equation 2 to take − log p(x, y). Therefore, with
into the edges of the parent node, while ws remains the same W remaining the same, a lower f (x, y) will result in higher
as determined by the leading token of the merged nodes. For PMI value. Additionally, it can be noted that PMI in Equation
a merged node with multiple tokens, we define the leading 2 suffers from the absence of boundaries when applied for
token as a single token that is carried by the original GoW. comparisons between word pairs [31]. To mitigate the scoring
More precisely, suppose the target node ”corona” 3 is to bias and the comparison difficulty, a common solution is to
be merged into the parent node ”virus” in Figure 2. Since normalize the PMI values with − log p(x, y) or a combination
node ”corona” is only neighboring with node ”test”, we add of − log p(x) and − log p(y) to the range [−1, 1] to smooth
the weights together so that the new weight between node the overall distribution.
”test” and ”virus” is wco bc = wco bd + wco bc , and remove Apart from measuring word associations, MI is also widely
node ”corona” from the graph. Furthermore, for the new applied in clustering evaluations. In the case when the ground
node ”virus” containing both tokens ”virus” and ”corona”, truth clusters are known, MI can be used to score the
the leading token is ”virus”, and the weight ws bc remains the ”similarity” between the predicted clusters and the labels. A
same as the cosine similarity between the word vectors ”virus” contingency table (Figure 3) is used to illustrate the number
and ”test”. of overlapping elements between the predicted clusterings A
and ground truth clusterings B. One disadvantage of using
D. Graph-of-Tweets Construction with Normalized Mutual
Information As Graph Edges
Similar to GoW, we introduce a novel GoT which maps
tweets to nodes. In addition, to compare the shared information
between the tweet nodes, we construct the edges with an ad-
justed MI metric. Each tweet is represented as a set of unique
merged nodes obtained from the previous two-phase GoW
reduction, and tweets with identical token node representation
are treated as one node. For instance, after merging token Fig. 3: Contingency Table Between Clusterings A and B [32]
node ”corona” into ”virus” in Figure 2, a processed tweet
{”corona”, ”virus”, ”positive”, ”test”} can be represented as a MI for clustering evaluation is the existence of selection bias,
tweet node t : {”virus”, ”positive”, ”test”} which contains which Romano et al. [33] described as ”the tendency to
the set of unique merged token nodes ”virus”, ”positive”, choose inappropriate clustering solutions with more clusters
and ”test”. or induced with fewer data points.” However, normalization
Originally from Information Theory, MI is used to measure can effectively reduce the bias as well as adding an upper
the information overlap between two random variables X and bound for easier comparison. Romano et al. [33] proposed a
Y . Pointwise MI (PMI) [30] in Equation 2 was introduced to variance and expectation based normalization method. Other
computational linguistics to measure the associations between popular normalization methods include using the joint entropy
bigrams / n-grams. PMI uses unigram frequencies and co- of A and B or some combinations of the entropies of A and
occurrence frequencies to compute the marginal and joint B as the denominator [32].
probabilities respectively (Equation 3), in which W denotes In our GoT case, since tweet nodes are represented by
different sets of token nodes, we can treat the tweet nodes
3 in this paper, we will use the italic ”leading token” to represent a token as clusters which allow repeating elements. Thus, the total
node, and the normal ”text” to represent plain text. number of elements is the number of token nodes obtainedfrom the reduced GoW. Correspondingly, the intersection be- A. Graph-of-Words Reduction
tween two tweet nodes can be represented by the overlapping Phase I reduction merged 19,663 token nodes that appeared
elements (token nodes). Following this line of logic, we define in less than 5 tweets, which is roughly 66.7% of all to-
the normalized MI between two tweets in Algorithm 2. ken nodes contained in the raw GoW. This phase primarily
contributes to reducing uncommon words within the corpus.
Algorithm 2 Normalized MI (NMI) Between Tweet Nodes
It can be argued that rare words may provide non-trivial
Let T : {t1 , t2 , ..., tk } be the set of tweets in the GoT. information. However, because our goal is to identify popular
Let V : {v1 , v2 , ..., vm } be the m token nodes in the reduced sub-events, the information loss brought by rare words does
GoW. For tweets ti : {vi1 , ..., vix } and tj : {vj1 , ..., vjy }, not heavily affect the results. Furthermore, word similarity
the M I is defined as: provided by FastText can effectively map the rare terms to the
p(ti ,tj )
M I(ti , tj ) = log p(ti )p(t j)
, more common words with a similar meaning. For instance,
where p(ti ) and p(tj ) are the probabilities of token nodes in our FastText model, the rare word ”floridah” has its most
containing an individual tweet with respect of total number similar word as the intended word ”florida”. Another fun fact
of token nodes m, with p(ti ) = m x y
and p(tj ) = m . is that the emoji ” ” was merged into the node ”coffee”.
The joint probability p(ti , tj ) represents the intersection There were 5,048 token nodes merged during Phase II
of token nodes between the two tweets, with p(ti , tj ) = reduction. This phase mainly contributes to information com-
count(ti ∩tj )
. pression within common tokens. By merging the neighbors
m
To normalize M I to the range [−1, 1], we use a normaliza- that carry similar information, the same target node can appear
tion denominator: in a less complex network without information loss. Table
norm = max[− log p(ti ), − log p(tj )] , II presents statistics of the resulting GoW. Table III shows
Thus, N M I = norm MI
. some example merged nodes from the reduced GoW 4 . The
Note that when p(ti , tj ) = 0 (indicating no intersection), largest node (248 tokens) is not shown here as it contains many
NMI will take boundary value −1. expletives. The second largest node ”lmaoooo” (221 tokens)
contains mostly informal terms like ”omgggg” and emojis.
It should be noted that as the fetching keywords {”corona”, TABLE II: Reduced GoW Statistics
”covid”} appear in every tweet in the dataset, tokens contain-
single / merged token nodes count 2,119 / 2,663
ing these words are removed when the GoT is constructed. max / min node size 248 / 2
Consequently, two tweet nodes with only ”corona” or ”covid” avg / std node size 10.28 / 16.56
in common will result in an NMI value of -1, while the out- max / min within merged node similarity 0.9672 / 0.1337
comes of sub-event identification are not affected by removing avg / std within merged node similarity 0.4074 / 0.1544
the main event ”COVID-19”.
E. Sub-event Extraction From Graph-of-Tweets TABLE III: Some Example Merged Nodes After Reduction
We hypothesize that popular sub-events are included within leading token merged tokens
airline frontier, iata, swoop, airliner, pilot, delta, piloting
a subgraph of GoT which are fully connected and highly
cdc wcdc, cdcS, cdcwho, cdcas, lrts, rts, lrt, #lrt, cdcgov,
similar in content. Following this assumption, we extract a cdcgovs, #cdcgov, cdcemergencys, mmwr, #mmwr,
GoT subgraph with only the tweet nodes included in the top n nih, cdcnih, #nih, #nihonbuyo, 514v
NMI values. Subsequently, we identify all maximal cliques of expects warns, #warns, expected, expecting, expectin, brace,
expect, therell
size greater than 2 from the subgraph for further analysis. As
cliques obtained this way consist of only nodes with large NMI
We identify roughly three patterns of merge, namely 1)
values, which indicates that the tweet nodes are highly similar,
words with same stem or synonym merge, 2) common bi-gram
the clique can be represented by the token nodes included
or fix-ed expression merge, and 3) words of topical related
in the tweet nodes. Thus, we treat a clique as a set of all
but semantically different merge during Phase II reduction.
token nodes contained in the tweet nodes and that each clique
Table IV illustrates some example merges from source node
represents a popular sub-event.
to destination node, with the green , blue, and red columns
IV. R ESULTS AND D ISCUSSION correspond to type-1, type-2 and type-3 respectively. Among
type-1 merge (green), it can be seen that common abbrevi-
To summarize, the raw GoW consisted of 29,493 unique
ations such as ”btc” as ”bitcoin” are also captured in the
token nodes for tweets from the Feb 25 data division. The
merging process. In type-2 merge (blue), the examples such
two-phase GoW reduction reduced the graph by 83.8%, with
as ”test positive” and ”health department” are frequent bi-
24,711 nodes merged and 4,782 token nodes left in the GoW.
grams in the context of our data; and other examples such
On the other hand, the raw GoT consisted of 31,383 unique
as ”silicon valley” and ”long term” are fixed expressions. One
tweet nodes. The extracted subgraph of the top 1000 MI values
consisted of 1,259 tweet nodes. Finally, 83 maximal cliques 4 The full reduced Graph-of-Words (4,728 token nodes) can be found at:
were identified from the subgraph. https://github.com/lostkuma/GraphOfTweetsTABLE IV: Some example merges in Phase II reduction uncased texts and employ named entity recognition to identify
src node dst node src node dst node src node dst node cases like this to preserve the correct word in future work.
covid19 covid positive test buy sell Subsequently, tweet nodes constituting the top 1000 NMI
covid coronavirus department health always never weights were extracted to construct a new GoT subgraph for
#iphone #apple cruise ship masked unmasked
complains complaint valley silicon men woman further analysis. The 1000 NMI subgraph contained 1,259
btc bitcoin long term latter splatter tweet nodes, which consisted of 1,024 token nodes. The
dead death conspiracy theory undo mundo minimum NMI value within the subgraph was 0.9769. In
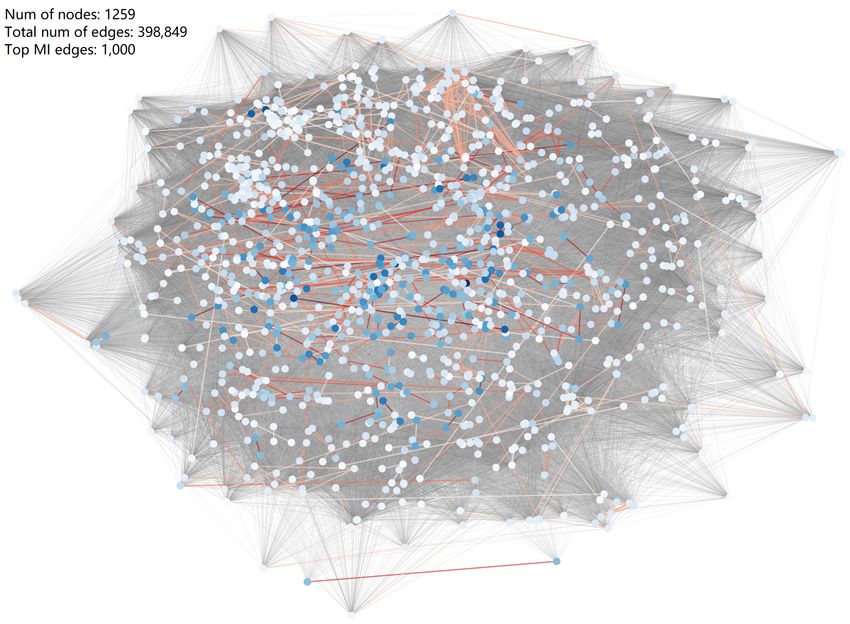
Figure 4, edges are only drawn between node pairs with
intersecting token nodes. The edges with an NMI value of
general drawback of word embedding models is that instead -1 are not shown in the figure. It should be noted that if all
of semantic similarity, words with frequent occurrence will the tweet node pairs extracted from the top 1000 MI edges are
be considered as very similar as noted in the distributional unique, there would be 2,000 nodes in the subgraph.
hypothesis [28]. An improvement can be made by combining
named entities, fixed expressions, and frequent bi-grams in
the data processing stage so that a node can also represents a
concept in the GoW. Finally, type-3 merge (red) is also suffers
from the drawback of word embedding models. Word pairs
like ”buy” and ”sell”, ”always” and ”never”, ”masked” and
”unmasked” are antonyms/reversives in meaning. However,
these word pairs tend to be used in the same context so they are
considered highly similar during the merging process. Word
pairs like ”latter” and ”sp[latter]”, ”undo” and ”m[undo]”
(means ”world” in Spanish) are subwords of each other. Recall
that FastText model uses character n-grams in the training. The
subword mechanism leads the rare words to be considered
as similar to the common words which share a part with
them. It should be noted that in Phase II, the merging is
performed from the lower weighed neighbors to the higher
weighed neighbors and from lower degree nodes to higher
degree nodes. It is plausible that a common word like ”undo” Fig. 4: GoT subgraph for the top 1000 MI edges with 1,259
is a lower weighed neighbor as compared to the uncommon tweet nodes and their edges (top 1000 MI edges and 397,849
word ”mundo” if the target token is also a rare word in Spanish other edges). The red edges represent the top 1000 MI edges
and that ”undo” does not co-occur frequently with the target and the gray edges represent other MI edges. Nodes with
token. higher saturation contains more leading tokens. Similarly,
edges with higher saturation indicate larger MI weights.
B. Graph-of-Tweets and Sub-events Extraction
After examining the tweet nodes with top 10 total de-
Using the reduced GoW, we constructed a GoT, where grees (the sum of all MI weights between the node and
each tweet node was represented as a set of leading tokens its neighbors), we found that some of the nodes are sub-
from the token nodes. Of the original 38,508 tweets, 31,383 sets of each other. For instance, tweet 23146 is represented
tweets were represented as unique tweet nodes. Take the tweet as: {”news”, ”epidemiologist”, ”nation”, ”probably”, ”con-
node tweet 18736, which repeated the most times with a firmed”, ”know”, ”spreading”, ”humping”, ”#mopolitics”,
frequency of 221 times, as an example. The original text of ”center”, ”kudla”, ”called”, ”contagious”, ”#sarscov2”,
tweet 18736 says ”US CDC warns of disruption to everyday ”#health”, ”govt”, ”friday”, ”#prevention”, ”update”, ”ex-
life’ with spread of coronavirus https://t.co/zO2IovjJlq”, which pects”, ”rrb”}, of which two other tweets tweet 20023 and
is an event created by Twitter on Feb 25. After preprocessing, tweet 11475 are subsets with 2 and 1 token node(s) dif-
we obtained {”u”, ”cdc”, ”warns”, ”disruption”, ”everyday”, ferences. Further statistics on the associations between total
”life”, ”spread”, ”coronavirus”}. Finally, the GoW leading to- node degrees, average node degrees, and node size (number
ken represented tweet node became {”probably”, ”cdc”, ”ex- of leading tokens) are shown in Figure 5. It can be seen in
pects”, ”destroy”, ”risking”, ”spreading”, ”coronavirus”}, Figure 5a that total node degree is positively correlated with
with both ”everyday” and ”life” merged to ”risking”. One the number of neighbors. We also examined the correlation
may notice that the word ”US” is converted to ”u” after pre- between total node degree and average neighbor degree (aver-
processing, which consecutively affected the FastText training, age NMI weights of all neighbors), but found no correlation.
the GoW reduction and the GoT representation. This is due On the other hand, in Figure 5b, the average neighbor degree
to a limitation from the WordNet lemmatizer that mapping is negatively correlated with the number of leading tokens
the lower case ”us” to ”u”. We would consider keeping the in a tweet node. This indicates that NMI relatively favorsthis type of clique to be ”strong representative” of the sub-
event. However, not all cliques represented the original tweet
contents well. Another clique in Table V that contained the
tweets regarding ”US HHS says there’s ‘low immediate risk’
of coronavirus for Americans” only suggested the ”likelihood
of” the main ”COVID-19” event. We marked this type of
clique as ”somewhat representative” of the sub-event. Other
types of cliques are marked as ”not representative”. Table
VI shows the content validity evaluation on 83 maximal
cliques. It should be noted that the labels are annotated in
(a) total degrees (top) and num- (b) average neighbor degrees acknowledgement of the meaningful token nodes, which on
ber of neighbors (bottom) of (top) and number of leading to- average takes 64.3% of each clique. We also analyzed the
tweet nodes ordered by total de- kens of tweet nodes ordered by event categories among the generated cliques and manually
grees descendingly. average degrees descendingly.
annotated the clique with type labels. Figure 6 shows the
Fig. 5: Node degree distribution for top 1000 MI subgraph. content validity distribution by different event types. We
can see that our proposed model performed very well on
generating meaningful clique content on the categories ”health
tweets with less elements. Imagine a random case where only department announcement” and ”stock, economy”; and not
independent tokens are present in a tweet node. Larger nodes very well on ”politics related” category. The difference in
(have more tokens) have less chances to share information performance may be due to the variation of the amount of
with other nodes. More precisely, for two pairs of tweets that information contained in the described events.
both share the same intersection size, the size of the tweets
will determine the NMI values. For instance, t1 (5 elements) TABLE VI: Content Validation of 83 Maximal Cliques
and t2 (5 elements) share 3 elements, while t1 and t3 (10 strong somewhat not
elements) also share 3 elements. Assuming there are a total of representative representative representative
m = 100 elements, the NMI values as defined in Algorithm 42 (50.60%) 33 (39.76%) 8 (9.64%)
2 are N M It1 ,t2 = 0.829 and N M It1 ,t3 = 0.598. It should
be noted that different normalization methods can cause the
NMI values to vary. The normalization metric we chose largely
normalizes the upper bound of the MI values. When a different
normalization metric is applied, for example, using the joint
probability, both the upper and lower bounds of the MI values
can be normalized.
Finally, we identified 83 maximal cliques of size greater
than 2 from the top 1000 NMI subgraph. While the largest
clique contained 14 tweet nodes, there were 21 cliques con-
sisting of 4 to 6 tweet nodes, and the rests contained 3 tweet
nodes. We observed that the tweet nodes contained in the same
clique shared highly similar content. Table V illustrates the
shared token nodes in all 14 tweet nodes from the largest
clique. We can derive the information contained in this clique
as ”the stock and/or bitcoin market has a crash/slide”. Further
Fig. 6: Clique validity distribution by manually labeled event
TABLE V: Token Nodes Shared Between Tweet Nodes in the type categories. Deep blue, light blue, and grey correspond to
Extracted Cliques ”strong representative”, ”somewhat representative”, and ”not
representative” categories respectively.
Shared token nodes in all #bitcoinprice, #stockmarket,
14 tweet nodes of a strong best, crashing, gdx, history,
representative clique probably, slide
shared token nodes in all 4 probably, hhs, open, immediate, It should be addressed that the dataset used in this paper was
tweet nodes of a somewhat likelihood, know, american collected directly from Twitter and that the approach proposed
representative clique in this paper was fully automated and unsupervised. As we
mentioned previously there is no bench-marking dataset for
investigation indicated that nodes in this clique are associated event identification, and the absence of gold standard makes
with the same tweet: ”The Dow just logged its worst 2- it difficult to conduct quantitative evaluations on the results.
day point slide in history — here are 5 reasons the stock Our best effort, as presented in Table VI and Figure 6, was
market is tanking, and only one of them is the coronavirus”, to manually analyzed the content of the generated cliques for
which elaborates on the stock market dropping. We marked validation.V. C ONCLUSION AND F UTURE W ORK [12] A. Tonon, P. Cudré-Mauroux, A. Blarer, V. Lenders, and B. Motik,
“Armatweet: detecting events by semantic tweet analysis,” in European
In this paper, we proposed a hybrid graph model which Semantic Web Conference. Springer, 2017, pp. 138–153.
uses conceptualized GoW nodes to represent tweet nodes for [13] M. Fedoryszak, B. Frederick, V. Rajaram, and C. Zhong, “Real-time
event detection on social data streams,” in Proceedings of the 25th ACM
sub-events identification. We developed an incremental graph SIGKDD International Conference on Knowledge Discovery & Data
merging approach to condense raw GoW leveraging word Mining, 2019, pp. 2774–2782.
embeddings. In addition, we outlined how the reduced GoW [14] M. Vazirgiannis, F. D. Malliaros, and G. Nikolentzos., “Graphrep:
boosting text mining, nlp and information retrieval with graphs,” in
is connected to GoT and developed an adjusted NMI metric Proceedings of the 27th ACM International Conference on Information
to measure nodes similarity in GoT. Finally, we utilized the and Knowledge Management, 2018, pp. 2295–2296.
fundamental graph structure, cliques, to assist with identify- [15] G. A. Miller, “Wordnet: a lexical database for english,” Communications
of the ACM, vol. 38, no. 11, pp. 39–41, 1995.
ing sub-events. Our approach showed promising results on [16] K. Bollacker, C. Evans, P. Paritosh, T. Sturge, and J. Taylor, “Free-
identifying popular sub-events in a fully unsupervised manner base: a collaboratively created graph database for structuring human
on real-world data. There remain adjustments that can be knowledge,” in Proceedings of the 2008 ACM SIGMOD international
conference on Management of data, 2008, pp. 1247–1250.
made to the GoT to improve the robustness of the model [17] C.-X. Jin and Q.-C. Bai, “Text clustering algorithm based on the
so more detailed and less noisy events can be captured. In graph structures of semantic word co-occurrence,” in 2016 International
the future, we plan to employ named entity recognition in Conference on Information System and Artificial Intelligence (ISAI).
IEEE, 2016, pp. 497–502.
raw data processing to identify key concepts. Additionally, [18] S. Jinarat, B. Manaskasemsak, and A. Rungsawang, “Short text clus-
frequent bi-grams/n-grams will be examined and combined tering based on word semantic graph with word embedding model.” in
prior to FastText training to improve the similarity metrics 2018 Joint 10th International Conference on Soft Computing and Intel-
ligent Systems (SCIS) and 19th International Symposium on Advanced
from word embeddings. We will also compare different MI Intelligent Systems (ISIS). IEEE, 2018, pp. 1427–1432.
normalization methods to neutralize the bias from sequence [19] T. Mikolov, I. Sutskever, K. Chen, G. S. Corrado, and J. Dean,
length. Finally, we plan to improve the conceptualization “Distributed representations of words and phrases and their composi-
tionality,” in Advances in neural information processing systems, 2013.
method of the token nodes so instead of the leading token, [20] P. Meladianos, G. Nikolentzos, F. Rousseau, Y. Stavrakas, and M. Vazir-
a node can be represented by the concept it is associated to. giannis., “Degeneracy-based real-time sub-event detection in twitter
stream,” in Ninth international AAAI conference on web and social
R EFERENCES media, 2015.
[21] D. Parveen and M. Strube, “Multi-document summarization using bipar-
[1] W. Feng, C. Zhang, W. Zhang, J. Han, J. Wang, C. Aggarwal, and tite graphs,” in Proceedings of TextGraphs-9: the workshop on Graph-
J. Huang, “Streamcube: hierarchical spatio-temporal hashtag clustering based Methods for Natural Language Processing. Doha, Qatar: ACL,
for event exploration over the twitter stream,” in 2015 IEEE 31st 2014, pp. 15–24.
International Conference on Data Engineering. IEEE, 2015, pp. 1561– [22] J. M. Kleinberg, “Authoritative sources in a hyperlinked environment,”
1572. Journal of the ACM (JACM), vol. 46, no. 5, pp. 604–632, 1999.
[2] S.-F. Yang and J. T. Rayz, “An event detection approach based on twitter [23] R. Mihalcea and P. Tarau, “Textrank: Bringing order into text,” in
hashtags,” arXiv preprint arXiv:1804.11243, 2018. Proceedings of the 2004 conference on empirical methods in natural
[3] A. J. McMinn and J. M. Jose, “Real-time entity-based event detection language processing, 2004, pp. 404–411.
for twitter,” in International conference of the cross-language evaluation [24] G. Glavaš, F. Nanni, and S. P. Ponzetto, “Unsupervised text segmentation
forum for european languages. Springer, Cham, 2015, pp. 65–77. using semantic relatedness graphs.” Association for Computational
[4] Y. Qin, Y. Zhang, M. Zhang, and D. Zheng, “Frame-based representation Linguistics, 2016.
for event detection on twitter,” IEICE TRANSACTIONS on Information [25] I. Szubert and M. Steedman, “Node embeddings for graph merging:
and Systems, vol. 101, no. 4, pp. 1180–1188, 2018. Case of knowledge graph construction,” in Proceedings of the Thirteenth
[5] B. Dhingra, Z. Zhou, D. Fitzpatrick, M. Muehl, and W. W. Cohen, Workshop on Graph-Based Methods for Natural Language Processing
“Tweet2vec: Character-based distributed representations for social me- (TextGraphs-13), 2019, pp. 172–176.
dia,” arXiv preprint arXiv:1605.03481, 2016. [26] B. Harrington and S. Clark, “Asknet: Creating and evaluating large
[6] L. N. Pina and R. Johansson, “Embedding senses for efficient graph- scale integrated semantic networks,” International Journal of Semantic
based word sense disambiguation,” in Proceedings of TextGraphs-10: Computing, vol. 2, no. 03, pp. 343–364, 2008.
the workshop on graph-based methods for natural language processing, [27] C.-Y. Lin, “Rouge: A package for automatic evaluation of summaries,”
2016, pp. 1–5. in Text summarization branches out, 2004, pp. 74–81.
[7] M. Bevilacqua and R. Navigli, “Breaking through the 80% glass [28] J. R. Firth, “A synopsis of linguistic theory,” Studies in linguistic
ceiling: Raising the state of the art in word sense disambiguation by analysis., pp. 1930–1955, 1957.
incorporating knowledge graph information,” in Proceedings of the 58th [29] P. Bojanowski, E. Grave, A. Joulin, and T. Mikolov, “Enriching word
Annual Meeting of the Association for Computational Linguistics, 2020, vectors with subword information,” Transactions of the Association for
pp. 2854–2864. Computational Linguistics, vol. 5, pp. 35–146., 2017.
[8] K. Skianis, F. Malliaros, and M. Vazirgiannis, “Fusing document, [30] K. Church and P. Hanks, “Word association norms, mutual information,
collection and label graph-based representations with word embeddings and lexicography,” Computational linguistics, vol. 16, no. 1, pp. 22–29,
for text classification,” in Proceedings of the Twelfth Workshop on 1990.
Graph-Based Methods for Natural Language Processing (TextGraphs- [31] G. Bouma, “Normalized (pointwise) mutual information in collocation
12). ACL, 2018, pp. 49–58. extraction,” in Proceedings of GSCL, 2009, pp. 31–40.
[9] L. Yao, C. Mao, and Y. Luo., “Graph convolutional networks for text [32] A. Amelio and C. Pizzuti, “Correction for closeness: Adjusting normal-
classification,” in Proceedings of the AAAI Conference on Artificial ized mutual information measure for clustering comparison,” Computa-
Intelligence, vol. 33, 2019, pp. 7370–7377. tional Intelligence, vol. 33, no. 3, pp. 579–601, 2017.
[10] M. T. Nayeem and Y. Chali, “Extract with order for coherent multi- [33] S. Romano, J. Bailey, V. Nguyen, and K. Verspoor, “Standardized mutual
document summarization,” in Proceedings of TextGraphs-11: the Work- information for clustering comparisons: one step further in adjustment
shop on Graph-based Methods for Natural Language Processing. Van- for chance.” in International Conference on Machine Learning, 2014,
couver, Canada: ACL, 2017, pp. 51–56. pp. 1143–1151.
[11] M. Yasunaga, R. Zhang, K. Meelu, A. Pareek, K. Srinivasan, and
D. Radev, “Graph-based neural multi-document summarization,” arXiv
preprint arXiv:1706.06681, 2017.You can also read