The Graph of Our Mind - Article - MDPI
←
→
Page content transcription
If your browser does not render page correctly, please read the page content below
brain
              sciences
Article
The Graph of Our Mind
Balázs Szalkai 1 , Bálint Varga 1 and Vince Grolmusz 1,2, *

                                          1   PIT Bioinformatics Group, Eötvös University, H-1117 Budapest, Hungary; szalkai@pitgroup.org (B.S.);
                                              balorkany@pitgroup.org (B.V.)
                                          2   Uratim Ltd., H-1118 Budapest, Hungary
                                          *   Correspondence: grolmusz@pitgroup.org

                                          Abstract: Graph theory in the last two decades penetrated sociology, molecular biology, genetics,
                                          chemistry, computer engineering, and numerous other fields of science. One of the more recent
                                          areas of its applications is the study of the connections of the human brain. By the development of
                                          diffusion magnetic resonance imaging (diffusion MRI), it is possible today to map the connections
                                          between the 1–1.5 cm2 regions of the gray matter of the human brain. These connections can be
                                          viewed as a graph. We have computed 1015-vertex graphs with thousands of edges for hundreds of
                                          human brains from one of the highest quality data sources: the Human Connectome Project. Here
                                          we analyze the male and female braingraphs graph-theoretically and show statistically significant
                                          differences in numerous parameters between the sexes: the female braingraphs are better expanders,
                                          have more edges, larger bipartition widths, and larger vertex cover than the braingraphs of the male
                                          subjects. These parameters are closely related to the quality measures of highly parallel computer
                                          interconnection networks: the better expanding property, the large bipartition width, and the large
                                          vertex cover characterize high-quality interconnection networks. We apply the data of 426 subjects
                                          and demonstrate the statistically significant (corrected) differences in 116 graph parameters between
                                          the sexes.

                                Keywords: connectome; braingraph; sex differences


Citation: Szalkai, B.; Varga, B.;
Grolmusz, V. The Graph of Our
Mind Brain Sci. 2021, 11, 342.            1. Introduction
https://doi.org/10.3390/                       It is an old dream to describe the neuronal-level braingraph (or connectome) of
brainsci11030342
                                          different organisms, where the vertices correspond to the neurons and two neurons are
                                          connected by an edge if there is a connection between them. The connectome of the
Received: 16 January 2021
                                          roundworm Caenorhabditis elegans with 302 neurons was mapped 30 years ago [1], but
Accepted: 2 March 2021
                                          larger braingraphs, especially the complete fruitfly Drosophila melanogaster braingraph (the
Published: 8 March 2021
                                          “flybrain”) with approximately 100,000 neurons remained unmapped in its entirety, despite
                                          using enormous resources and efforts worldwide [2]. Mapping the connections in the
Publisher’s Note: MDPI stays neutral
                                          human brain on the neuronal level is completely hopeless today, mostly because there are,
with regard to jurisdictional claims in
                                          on average, 86 billion neurons in the human brain [3]. Constructing human braingraphs
published maps and institutional affil-
iations.
                                          (or “connectomes”), where the vertices are not single neurons, but much larger areas of
                                          the gray matter of the brain (called Regions of Interest, ROIs), is possible, and it is the
                                          subject of a very intensive research work today. Two vertices corresponding to the ROIs,
                                          are connected by an edge if a diffusion-MRI based workflow finds neuronal connections
                                          between them. In the process of the Human Connectome Project [4], an enormous amount
Copyright: © 2021 by the authors.
                                          of data and numerous tools were created related to the mapping of the human brain, and
Licensee MDPI, Basel, Switzerland.
                                          the resulting data were deposited in publicly available databases of dozens of terabytes.
This article is an open access arti-
                                               Our focus in this work is the graph-theoretical analysis of the connections of the brain;
cle distributed under the terms and
conditions of the Creative Commons
                                          consequently, we just sketch the process of the construction of this graph here.
Attribution (CC BY) license (https://
                                               The human brain tissue, roughly, has two distinct parts: the white matter and the
creativecommons.org/licenses/by/
                                          gray matter. The gray matter, by some simplifications, consists of the cell-bodies (or somas)
4.0/).                                    of the neurons, and the white matter from the fibers of axons (long projections from the

Brain Sci. 2021, 11, 342. https://doi.org/10.3390/brainsci11030342                                          https://www.mdpi.com/journal/brainsci
Brain Sci. 2021, 11, 342 2 of 12
somas), insulated by lipid-like myelin sheaths. The cortex of the brain, and also some
sub-cortical areas, contain gray matter, and most of the inner parts of the brain contain
white matter. Again with some simplifications, the connections between the somas of the
neurons, the axons, run in the white matter, except the very short axons running entirely in
the gray matter.
Diffusion magnetic resonance imaging (MRI) is, again roughly speaking, capable of
measuring the direction of the diffusion of the water molecules in living tissues without
any contrast agent. The gray matter of the brain consists of the cell bodies (somas) of the
neurons; consequently, there is not any distinguished direction of the diffusion of the water
molecules in the somas: in each direction, the molecules can move freely. In the white
matter, however, the neuronal fibers consisted of long axons, so the water molecules move
more easily and more probably in the direction of the axons than perpendicularly, through
the cell membrane bordering the axons. Therefore, in each point of a given axon in the
white matter, the diffusion of the water molecules is larger in directions parallel to the
axons and smaller in other directions.
This way, one can distinguish the white matter and the gray matter of the brain (this
step is called partitioning). Moreover, by following or tracking the directions of the stronger
diffusion, it is possible to map the orbits of the neuronal fibers in the white matter (this
step is called tractography). Certainly, when the fiber tracts are crossed, it is not easy to
follow the correct directions of the axons.
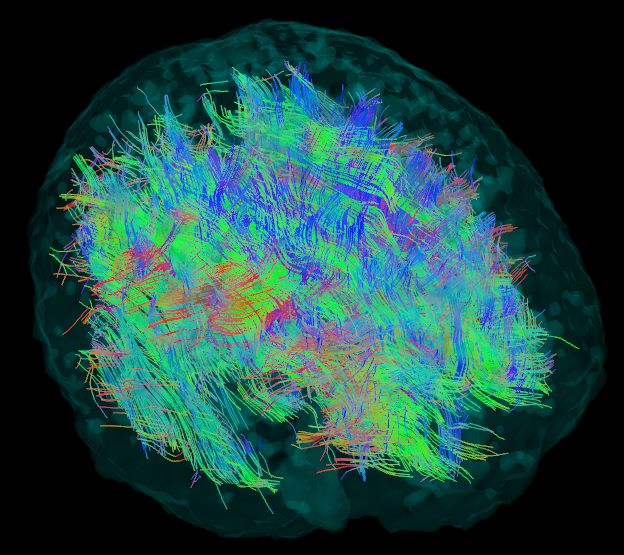
After the tractography is performed, one gets an image, similar to Figure 1. Most of
the Sci.
Version February 27, 2021 submitted to Brain fibers start and end on the surface—the cortex—of the brain.
3 of 13
Figure 1. The result of the tractography phase. Note the fibers starting and ending on the outer
Figure The of
1. cortex
surface, the result of the
the brain, tractography
which phase.TheNote
consists of gray matter. fibers the fibersonly
are tracked starting
in the and ending on the outer
surface,
anisotropicthe cortex
white matter. of the brain, which consists of gray matter. The fibers are tracked only in the
anisotropic white matter.
92 (iii) Based on a feature of the Budapest Reference Connectome Server, we have
93 found a probable connection between the consensus connectomes and the axon–
94
We are interested in the connections between the gray matter areas, mostly of the
development of the human brain [18–21].
95 cortical areas,
(iv) We have and we
described ignore
the most the exact
frequent orbits ofofthe
small subgraphs neuronal
the human fibersinin the white matter. That
braingaph
96 is, it[22].
is not interesting
In [23] for the
we have listed us most
where the “wires”
frequent complete run, just of
subgraphs thethefact of the connections between
human
97 connectome. In [24,25] we have introduced the method of the Frequent Network
98
the separate areas of the gray matter. Naturally, the length or
Neighborhood Mapping, and applied it for the neighbors of the hippocampus, one
the number of neuronal fibers
99 connecting the gray matter ROIs can be included
of the most important small functional entity of the brain. in the graph as different weight functions
100 (v) We have
on the edges. compared women’s and men’s connectomes in 96 subjects in [26], and
101 found that the braingraphs of females have numerous, statistically significant
102 differences in graph-theoretical properties that are characteristic of the higher
103 connectivity in connections. We have found 13 parameters in which the difference
104 remained significant after the very strict Holm-Bonferroni statistical correction [27].
105 In the present work, we have found 116 graph parameters (vs. the 13 parameters in
106 [26]), which differ significantly between the sexes after the Holm-Bonferroni correction.
107 2. Materials and MethodsBrain Sci. 2021, 11, 342 3 of 12
Consequently, we define the graph as follows: the vertices are the small anatomical
areas of the gray matter (ROIs), and two ROIs are connected by an edge if, in the tractogra-
phy phase, at least one fiber is tracked between these two ROIs. We are considering five
different resolutions of ROIs, and also five different weight functions, computed from the
properties of the fibers, connecting the ROIs.
Previous Work
Numerous publications cover the connectome [5,6] of healthy humans [7–10] and
also the connectomes of the healthy and the diseased brain [11–14]. Usually, these works
analyze only 80–100 vertex graphs on the whole brain, and they are using concepts that
originate from the network science, developed for large graphs of millions of vertices,
found, e.g., in the graph of the World Wide Web.
Here we present another approach: We are analyzing larger graphs, up to 1015 vertices,
and our algorithms are originated from graph theory and not from network science. In
other words, we are also computing graph parameters that are quite hopeless to compute
for graphs with millions of vertices.
In our previous work, we have made comparisons between the braingraphs of numer-
ous subjects with several focuses:
(i) We have constructed the Budapest Reference Connectome Server http://connectome.
pitgroup.org (accessed on 7 March 2021), which generates the common edges of up to
477 graphs of 1015 vertices, according to selectable parameters [15,16]. The Budapest
Reference Connectome Server, apart from the common-edge demonstration, is also a
good tool for the instant visualization of the braingraph.
(ii) We have compared the diversity of the edges in distinct cerebral areas in 392 individual
brains in [17];
(iii) Based on a feature of the Budapest Reference Connectome Server, we have found a
probable connection between the consensus connectomes and the axon–development
of the human brain [18–21].
(iv) We have described the most frequent small subgraphs of the human braingaph in [22].
In [23] we have listed the most frequent complete subgraphs of the human connectome.
In [24,25] we have introduced the method of the Frequent Network Neighborhood
Mapping, and applied it for the neighbors of the hippocampus, one of the most
important small functional entity of the brain.
(v) We have compared women’s and men’s connectomes in 96 subjects in [26], and found
that the braingraphs of females have numerous, statistically significant differences in
graph-theoretical properties that are characteristic of the higher connectivity in con-
nections. We have found 13 parameters in which the difference remained significant
after the very strict Holm-Bonferroni statistical correction [27].
In the present work, we have found 116 graph parameters (vs. the 13 parameters
in [26]), which differ significantly between the sexes after the Holm-Bonferroni correction.
2. Materials and Methods
We have used the Connectome Mapper Toolkit [28] http://cmtk.org (accessed on 7
March 2021) for brain tissue segmentation into gray and white matter, partitioning the
brain into anatomical regions, for tractography (tracking the axonal fibers in the white
matter), and for the construction of the graphs from the fibers identified in the tractography
phase of the workflow. The partitioning was based on the FreeSurfer suite of programs [29],
according to the Desikan-Killiany brain anatomy atlas [30]. The tractography used the
MRtrix processing tool [31] with randomized seeding and with the deterministic stream-
line method.
The graphs were constructed using the results of the tractography step: two nodes,
corresponding to ROIs, were connected if there existed at least one fiber connecting them.
Loops were deleted from the graph.Brain Sci. 2021, 11, 342 4 of 12
Graph parameters were computed by the integer programming (IP) solver SCIP
https://scipopt.org (accessed on 7 March 2021), [32,33], and by some in-house scripts.
The unprocessed and pre-processed MRI data is available at the Human Connectome
Project’s website: http://www.humanconnectome.org/documentation/S500 (accessed
on March 7, 2021) [4]. The assembled graphs that we analyzed in the present work can
be downloaded at the site http://braingraph.org/download-pit-group-connectomes/
(accessed on 7 March 2021). The individual graph results are detailed in a large Excel table
at the site http://uratim.com/bigtableB.zip (accessed on 7 March 2021).
2.1. Statistical Analysis
Our statistical null-hypothesis [34] was that the graph parameters do not differ be-
tween males and females. For dealing with both type I and type II statistical errors, we
have partitioned the subjects into classes quasi-randomly: subjects with IDs with even
digit-sums went to group 0, and those with odd digit sums went to group 1 (c.f. the first
column of http://uratim.com/bigtableB.zip (accessed on 7 March 2021)).
We applied group 0 for a base set for making hypotheses, and group 1 for a holdout
set, for testing those hypotheses. The hypotheses on group 0 were filtered by “Analysis of
variance” (ANOVA) [35]: only the hypotheses with a p-value of less than 1% were selected
for the testing in the holdout set. Next, the selected hypotheses were tested on group 1,
with the rather strict Holm-Bonferroni correction method [27]. The significance level in the
Holm-Bonferroni correction was set to 5%.
2.2. Handling Possible Artifacts
While we have applied the same computational workflow for the data of both sexes,
it is still possible that some non-sex-specific artifacts caused significant differences in the
graph parameters between men and women subjects. One possible cause may be the
statistical difference between the size of the brain of the sexes [36]. In the tractography step,
it may happen that the longer neural fibers of the males cannot be tracked so reliably as the
shorter fibers of the females. To close out this possible error, we have selected 36 small-brain
males and 36 large-brain females such that all the females have larger brains than all the
males in the data set [37]. Next, we have computed the graph-theoretical parameters as in
the present work. Two main findings of ours were: (i) the small-brain men did not have
the larger values identified in the set of the women in the present study; (ii) in several
parameters, mostly with the weight function FAMean, women still have the statistically
significant larger values identified in the present study.
We find this result decisive that the graph-theoretical differences in the connectomes
are due to sex differences and not size differences.
3. Results
In the present work, we are considering a 426-subject dataset from the Human Con-
nectome Project public release [4]. For each subject, we compute braingraphs with five
different vertex-numbers: 83, 129, 234, 463, and 1015. The vertices correspond to anatomical
areas of the gray matter in different resolutions.
The goal is to assign the same-named vertex to the same anatomical region, in the case
of all subjects. Naturally, the size and the shape of the brain of all subjects differ; therefore, it
is a non-trivial task to assign the same nodes (or ROIs) to the same anatomical regions for all
subjects. This is called the “registration problem”, and we have applied the solution from
the FreeSurfer suite of programs [29] that mapped the individual brains to the Desikan-
Kiliany brain atlas [30]. Roughly, the registration method applies homeomorphisms in order
to correspond to the major cortical patterns of sulci and gyri between individual cortices.
We were using five different resolutions in 83, 129, 234, 463, and 1015 vertices because
for smaller values, the graph structure is poorer, and for the higher resolutions, there is
a possibility of registration errors due to the potentially too small areas corresponded to
the vertices. Therefore, we have computed and analyzed the graph properties for all ofBrain Sci. 2021, 11, 342 5 of 12
these five resolutions instead of deciding arbitrarily that one of the resolutions is the best
for our goals.
For every graph, we have considered five different edge weights. Four of these
describe some quantities related to the neuronal fibers, defining the edge in question. More
exactly, the weight functions are:
• Unweighted: Each edge has the same weight 1;
• FiberN: The number of fibers discovered in the tractography step between the nodes
corresponded to ROIs;
• FAMean: The average of the fractional anisotropies [38] of the neuronal fibers, connect-
ing the endpoints of the edge;
• FiberLengthMean: The average fiber-lengths between the endpoints of the edge.
• FiberNDivLength: The number of fiber tracts connecting the end-nodes, divided by
the mean length of those fibers.
The last weight function, FiberNDivLength, describes a conductance-like quantity in
a very simple electrical model: the resistances are proportional to the average fiber length
and inversely proportional to the number of wires connecting the endpoints. Similarly, it
is also describing a reliability measure of the edge: longer fibers are less reliable due to
tractography errors, but multiple fibers between the same ROIs are increasing the reliability.
Other authors have considered the number of edges (weighted or unweighted) run-
ning between pre-defined areas of the brain. One of the main focuses of these works was
the ratio between the edges, running between the two hemispheres of the brain divided
by the number of edges running within each hemisphere [39,40]. The authors of [40]
considered 95-node graphs, computed from 949 subjects of a publicly unavailable dataset,
and found that, relatively, males have more intra-hemispheric edges while females have
more inter-hemispheric edges.
We were interested—instead of simple edge-counting between pre-defined vertex-
sets—in computing much more elaborate graph-theoretic parameters of the braingraphs.
More exactly, we have computed the following parameters for each graph, similarly
as in [26,37]:
• Number of edges (Sum). The weighted version of this number is the sum of the weights
of the edges in the graph.
• Normalized largest eigenvalue (AdjLMaxDivD): The largest eigenvalue of the gener-
alized adjacency matrix, divided by the average degree of the graph. The adjacency
matrix of an n-vertex graph is an n × n matrix, where aij is 1 if {vi , v j } is an edge, and
0 otherwise. The generalized adjacency matrix contains the weight of edge {vi , v j } in
aij . The division by the average degree of the vertices is important since the largest
eigenvalue is bounded by the average- and maximum degrees [41], so a dense graph
has a big λmax largest eigenvalue because of the larger average degree. Since the
vertex numbers are fixed, the average degree is already defined by the sum of weights
for each graph.
• Eigengap of the transition matrix (PGEigengap): The transition matrix PG is defined by
dividing the rows of the generalized adjacency matrix by the generalized degree of the
node, where the generalized degree is the sum of the weights of the edges, incident to
the vertex. A random walk on a graph can be characterized by the probabilities, for
each i and j, of moving from vertex vi to vertex v j . These probabilities are the elements
of transition matrix PG , with all the row-sums equal to 1. The eigengap of a matrix
is the difference between the largest and the second largest eigenvalue of PG , and it
is characteristic of the expander property of the graph: the larger the gap, the better
expander is the graph (see [42]).
• Hoffman’s bound (HoffmanBound): If λmax and λmin denote the largest and smallest
eigenvalues of the adjacency matrix, then Hoffman’s bound is defined as
λmax
1+ .
|λmin |Brain Sci. 2021, 11, 342 6 of 12
This quantity is a lower estimation for the chromatic number of the graph.
• Logarithm of the number of the spanning forests (LogAbsSpanningForestN): The
quantity of the spanning trees in a connected graph can be computed from the spec-
trum of its Laplacian [43,44]. Graphs with more edges usually have more spanning
trees since the addition of an edge does not decrease the number of the spanning trees.
For non-connected graphs, the number of spanning forests is the product of the num-
bers of the spanning trees of their components. The quantity LogAbsSpanningForestN
is defined to be the logarithm of the number of spanning forests in the unweighted
case. For other weight functions, if we define the weight of a tree by the product of the
weights of its edges, then LogAbsSpanningForestN equals the sum of the logarithms
of the weights of the spanning trees in the forests.
• Balanced minimum cut, divided by the number of edges (MinCutBalDivSum): If the
nodes of a graph are partitioned into two classes, then a cut is the set of the edges
running between these two classes. When we are looking for a minimum cut in a graph,
most frequently, one of the classes is small (say it contains just one vertex) and the
other all the remaining vertices. Therefore, the most interesting case is when the sizes
of the two classes of the partitions differ by at most one. Finding such a partition
with the smallest cut is the “balanced minimum cut” or the “minimal bisection width”
problem. This quantity, in a certain sense, describes the “bottleneck” of the graph,
and it is an important characteristic of the interconnection networks (like the butterfly,
the cube connected cycles, or the De Bruijn network, [45]) in computer engineering.
For the whole brain graph, one may expect that the minimum cut corresponds to the
partition to the two hemispheres, which was found when we analyzed the results.
Consequently, this quantity is interesting within the hemispheres, when only the
nodes of the right- or the left hemisphere are partitioned into two classes of equal size.
Computing the balanced minimum cut is NP-hard [46], but its computation for the
input-sizes of this study is possible with contemporary integer programming software.
If we double every edge in a graph (allowing two edges between two vertices), then
the minimum balanced cut will also be doubled. So, it is natural to expect that graphs
with more edges may have a larger minimum balanced cut just because more edges
are present. However, if we norm (i.e., divide by) the balanced minimum cut with the
number of the edges in the graph examined, then this effect can be factored out: for
example, in the doubled-edge graph, the balanced minimum cut is also doubled, but
when its size is divided by the doubled edge number, the normed value will be the
same as in the original graph. So, when MinCutBalDivSum is considered, the effects of
the edge-numbers are factored out.
• Minimum cost spanning tree (MinSpanningForest), computed with Kruskal’s algo-
rithm [47].
• Minimum weighted vertex cover (MinVertexCover): We need to assign to each vertex
a non-negative weight satisfying that for each edge, the sum of the weights of its two
endpoints is at least 1. This is the relaxation of the NP-hard vertex-cover problem [48],
since here we allow fractional weights, too. The sum of all vertex-weights with this
constraint can be minimized in polynomial time by linear programming.
• Minimum vertex cover (MinVertexCoverBinary): Same as the quantity above, but
the weights need to be 0 or 1. Alternatively, this number gives the size of the smallest
vertex-set such that each edge is connected to at least one of the vertices in the set.
This graph parameter is NP-hard, and we computed it only for the unweighted case
by an integer programming (IP) solver SCIP https://scipopt.org (accessed on 7 March
2021) [32,33].
• Maximum matching (MaxMatching): A graph matching is a set of edges without
common vertices. A maximum matching contains the largest number of edges. A
maximum matching in a weighted graph is the matching with the maximum sum of
weights taken on its edges.Brain Sci. 2021, 11, 342 7 of 12
• Maximum fractional matching (MaxFracMatching): is the linear-programming relax-
ation of the maximum matching problem. In the unweighted case, non-negative
values x (e) are searched for each edge e in the graph, satisfying that for each vertex v
in the graph, the sum of x (e)-s for the edges that are incident to v is at most 1. The
maximum of the sums of ∑e x (e) is the maximum fractional matching for a graph. For
the weighted version with weight function w, ∑e x (e)w(e) needs to be maximized.
The above parameters were computed for all five resolutions and the left and the
right hemispheres and also for the whole connectome, with all five weight functions (with
the following exceptions: MinVertexCoverBinary was computed only for the unweighted
case, and the MinSpanningTree was not computed for the unweighted case).
The results, for each subject, each resolution, and each weight function are de-
tailed in a large Excel table, downloadable from the site http://uratim.com/bigtableB.zip
(accessed on 7 March 2021).
The Syntactics of the Results
Each parameter-name in Table 1 and at http://uratim.com/bigtableB.zip (accessed on
7 March 2021) and elsewhere in this work contains two separating “_” symbols that define
three parts of the name. The first part describes the hemisphere or the whole connectome
with the words Left, Right or All. The second part describes the parameter computed, and
the third part the weight function used. For example, All_AdjLMaxDivD_FiberNDivLength
means that the normalized largest eigenvalue AdjLMaxDivD was computed for the whole
brain, with the FiberNDivLength weight function (see above).
Table 1 gives the most significant differences between the male and female connec-
tomes. A larger version of Table 1 is available in the supporting material as Table S1.
Table 1. The results and the statistical analysis of the graph-theoretical evaluation of the sex differences of the most
significant sex differences in the 426-subject data set. The whole table can be found in the on-line supplementary Table
S1. The first column gives the resolutions: the number of vertices in the whole graph. The second column describes the
graph parameter computed: its syntactics is as follows: each parameter-name contains two separating “_” symbols that
define three parts of the parameter-name. The first part describes the hemisphere or the whole connectome with the words
Left, Right, or All. The second part describes the parameter computed, and the third part the weight function used. The
third column contains values of the parameters, averaged to the sexes. The fourth column describes the p-values of the first
round, the fifth column the p-values of the second round, and the sixth column the (very strict) Holm-Bonferroni correction
of the p-value. Note that p-values, less than 0.00001 are rounded up to 0.00001 uniformly, since we did not want to use
floating point numbers in the table.
Scale Property Female | Male p (1st) p (2nd) p (Corrected)
129 Left_PGEigengap_FiberNDivLength 0.0948|0.0811 0.00001 0.00001 0.00001
234 Left_PGEigengap_FiberNDivLength 0.0712|0.0606 0.00001 0.00001 0.00001
129 Left_PGEigengap_FiberN 0.1219|0.1007 0.00001 0.00001 0.00001
83 Left_PGEigengap_FiberNDivLength 0.1412|0.1249 0.00001 0.00001 0.00001
234 Left_PGEigengap_FiberN 0.0946|0.0782 0.00001 0.00001 0.00001
83 Left_PGEigengap_FiberN 0.1675|0.1430 0.00001 0.00001 0.00001
234 All_PGEigengap_FiberNDivLength 0.0242|0.0201 0.00001 0.00001 0.00001
83 Left_MinCutBalDivSum_FiberNDivLength 0.1320|0.1186 0.00001 0.00001 0.00001
83 All_LogSpanningForestN_FiberNDivLength 147.7706|142.7239 0.00001 0.00001 0.00001
83 Left_MinCutBalDivSum_FiberN 0.1305|0.1151 0.00001 0.00001 0.00001
129 All_PGEigengap_FiberNDivLength 0.0284|0.0237 0.00001 0.00001 0.00001
83 All_Sum_FiberN 11072.8196|10547.3855 0.00001 0.00001 0.00001
129 Left_MinCutBalDivSum_FiberN 0.1223|0.1052 0.00001 0.00001 0.00001
83 All_PGEigengap_FiberNDivLength 0.0346|0.0291 0.00001 0.00001 0.00001
83 Left_Sum_Unweighted 282.0573|269.7710 0.00001 0.00001 0.00001Brain Sci. 2021, 11, 342 8 of 12
Table 1. Cont.
Scale Property Female | Male p (1st) p (2nd) p (Corrected)
234 Left_MinCutBalDivSum_FiberN 0.0995|0.0864 0.00001 0.00001 0.00002
83 All_Sum_FAMean 218.7173|202.2306 0.00001 0.00001 0.00002
463 Left_MinCutBalDivSum_FiberN 0.0702|0.0608 0.00001 0.00001 0.00002
129 All_Sum_FiberN 12238.966|11779.5060 0.00001 0.00001 0.00003
83 Left_LogSpanningForestN_FiberNDivLength 73.9377|71.1251 0.00001 0.00001 0.00003
234 Left_PGEigengap_Unweighted 0.1282|0.1104 0.00001 0.00001 0.00004
83 All_LogSpanningForestN_FAMean 109.3931|102.6911 0.00001 0.00001 0.00005
83 All_Sum_Unweighted 564.4098|544.3012 0.00001 0.00001 0.00006
83 Left_Sum_FAMean 105.9875|97.2824 0.00001 0.00001 0.00006
129 Left_PGEigengap_Unweighted 0.2047|0.1774 0.00001 0.00001 0.00006
463 Left_MinCutBalDivSum_Unweighted 0.0927|0.0805 0.00001 0.00001 0.00007
234 All_PGEigengap_FiberN 0.0250|0.0212 0.00001 0.00001 0.00007
129 All_LogSpanningForestN_FiberNDivLength 210.3350|204.5640 0.00001 0.00001 0.00007
83 Left_LogSpanningForestN_FAMean 53.1346|49.1865 0.00001 0.00001 0.00008
83 Left_PGEigengap_Unweighted 0.3083|0.2769 0.00001 0.00001 0.00010
83 Left_MinCutBalDivSum_FAMean 0.24907|0.2279 0.00001 0.00001 0.00013
In Table http://uratim.com/bigtableB.zip (accessed on 7 March 2021), the first column,
round-index is used in the statistical analysis. Second column, “id”, is the anonymized
subject ID of the Human Connectome Project’s 500-subject public release. Column 3 gives
the sex of the subject, 0: female, 1: male. Fourth column gives the age-groups 0: 22–25 years;
1: 26–30 years; 2: 31–35 years; 3: 35+ years. Column 5 gives the number of vertices of the
graph analyzed.
4. Discussions and Conclusions
The data that we used from the public release of the Human Connectome Project
contains diffusion MRI recordings from healthy male and female subjects of age 22 through
35. Therefore, if we want to find correlations of the graph-theoretical characteristics of the
connectomes with some biological properties, we may easily use either the sex or the age
of the subjects.
Our main finding now, on a large data set, validates our earlier results that were
made on a much smaller data set in [26]: in numerous graph-theoretical parameters,
women’s connectomes show statistically significant “higher connectivity” against the
men’s respective parameters.
4.1. Interconnection Networks
We would like to clarify what is meant under “higher connectivity” in the previous
sentence in the next section.
A field of computer engineering and theoretical computer science studies the inter-
connection networks [45,49]. Some of these networks, called packet routing or packet
switching networks, should satisfy two contradicting requirements:
(a) The degree of all vertices (i.e., the number of edges that connect to a vertex) should be
low, and
(b) Suppose we have t packets, each to be delivered to a designated graph vertex; no
two packets should go to the same vertex. If we arbitrarily designate t distinct
originating vertices, each containing one packet, and the target vertices are disjoint
from the originating vertices, then the packets can be forwarded along the graph
edges quickly to the respective target nodes, in a way that no two packets may use
the same edge simultaneously.
It is assumed that in one time unit, the packets can travel along one graph edge.
Clearly, if we take n nodes, and connect every two of them by an edge (that is,
a complete graph on n vertices), then for any positive integer t ≤ n/2, task (b) canBrain Sci. 2021, 11, 342 9 of 12
be performed in just one time unit: the packets will travel directly to their respective
destinations. In this network, however, (a) is not satisfied: the degree of each node is n − 1.
However, in the case of very large vertex sets, the direct connections to all the other
vertices are not possible: for example, in our brain, each of the 80 billion neurons may
be connected up to several thousand other neurons directly, but never to several millions
or billions.
Similarly, in massively parallel computers, the computing units (processors) cannot
be connected directly to all the other units because of physical (i.e., electrical current)
and geometrical (i.e., wire width) constraints. Because of this, the (a) requirement is
posted above.
Computer scientists have invented several network designs for accommodating both
the (a) and (b) properties: e.g., the butterfly, the cube-connected cycles, the shuffle-exchange
graph [45,49]. In these graphs, the quality measures correspond to the low number of edges
(which correlates with requirement (a)), the high balanced minimum cut size, the large
eigengap, the large minimum vertex cover. For example, if the balanced cut size between
vertex sets A and B is high, then if the packets start from A and are targeted to B, then no
bottlenecks may delay their moves to their targets.
In what follows, we say that a network has higher connectivity properties if it has
better quality measures, described here.
We note that the tractography phase in the construction of braingraphs has some
chances to introduce artifacts in the graphs (see, e.g., [50–52]). We have given a detailed
analysis of the effects of the possible artifacts in male and female brains in [37], as we
detailed in the “Methods” section.
4.2. Tabular Results
In Table 1 and also in Tables S1–S6 in the supporting material, we are enclosing several
large tables with the results. In Tables 1 and S1, the results of statistical analysis are detailed:
the parameters with the bold last column are all significantly differ between the female
and the male connectomes: the vast majority is “better” for the females. If the last column
is not bold, but the fifth column is typeset in italic, then those parameters, one-by-one,
significantly differ between the sexes, but it is unlikely that all of them differ significantly
(type II statistical errors are possible).
For example, as it is seen in Table 1, differences in the PGEigengap values show the
better expander property in the braingraph of the females, in both hemispheres. The
differences in the Sum quantity show that in both hemispheres, women have more edges
than men, and this statement remains true for weighted edges with most weight functions.
Very strong statistical evidence shows the higher values in women’s data in the edge-
number normalized balanced minimum cut in the left hemisphere. Matching numbers
(both fractional and integer) are also significantly larger in the case of females.
Seemingly, in the left hemisphere, the women’s difference is stronger in several
parameters: the first several rows of Table S1 contain mostly “Left” or “All” prefixes in the
second column.
In very few cases men have parameters, implying higher connectivity: e.g., in res-
olution 83, All_MinSpanningForest_FiberLengthMean is significantly larger for men
than for women. Similarly, another parameter, weighted by FiberLengthMean, the
All_MinSpanningForest_FiberLengthMean in 234-resolution is also larger for males. We
believe that the larger brain size with the FiberLengthMean weighting compensates the
fewer connections of the males in these cases.
Supplementary Materials: The following are available online at https://www.mdpi.com/2076-342
5/11/3/342/s1. In the supporting material, we are also enclosing Tables S2–S6 that give the detailed
averaged results for each resolution for each graph parameter with ANOVA statistical analysis. The
subject-level data are also available at http://uratim.com/bigtableB.zip, accessed on 7 March 2021.Brain Sci. 2021, 11, 342 10 of 12
Author Contributions: Initiated the study: V.G.; contributed analytic tools: B.S., B.V.; analyzed data:
B.S., B.V., V.G.; secured funding & wrote the paper: V.G. All authors have read and agreed to the
published version of the manuscript.
Funding: V.G. and B.V. were partially funded by the VEKOP-2.3.2-16-2017-00014 program, supported
by the European Union and the State of Hungary, co-financed by the European Regional Development
Fund, and by the European Union, co-financed by the European Social Fund (EFOP-3.6.3-VEKOP-
16-2017-00002). V.G. was partially funded by the NKFI-127909 grant of the National Research,
Development and Innovation Office of Hungary.
Institutional Review Board Statement: Not applicable.
Informed Consent Statement: Not applicable.
Data Availability Statement: The unprocessed and pre-processed MRI data is available at the
Human Connectome Project’s website: http://www.humanconnectome.org/documentation/S500
(accessed on 7 March 2021) [4]. The assembled graphs that we analyzed in the present work can
be downloaded at the site http://braingraph.org/download-pit-group-connectomes/ (accessed
on 7 March 2021). The individual graph results are detailed in a large Excel table at the site
http://uratim.com/bigtableB.zip (accessed on 7 March 2021).
Acknowledgments: Data were provided in part by the Human Connectome Project, WU-Minn
Consortium (Principal Investigators: David Van Essen and Kamil Ugurbil; 1U54MH091657) funded
by the 16 NIH Institutes and Centers that support the NIH Blueprint for Neuroscience Research; and
by the McDonnell Center for Systems Neuroscience at Washington University.
Conflicts of Interest: The authors declare no conflict of interest. The funders had no role in the design
of the study; in the collection, analyses, or interpretation of data; in the writing of the manuscript, or
in the decision to publish the results.
References
1. White, J.; Southgate, E.; Thomson, J.; Brenner, S. The structure of the nervous system of the nematode Caenorhabditis elegans:
The mind of a worm. Phil. Trans. R. Soc. Lond. 1986, 314, 1–340.
2. Scheffer, L.; Xu, S.; Januszewski, M.; Lu, Z. A connectome and analysis of the adult Drosophila central brain. eLife 2020, 9, e57443.
[CrossRef]
3. Azevedo, F.A.; Carvalho, L.R.; Grinberg, L.T.; Farfel, J.M.; Ferretti, R.E.; Leite, R.E.; Lent, R.; Herculano-Houzel, S. Equal numbers
of neuronal and nonneuronal cells make the human brain an isometrically scaled-up primate brain. J. Comp. Neurol. 2009,
513, 532–541. [CrossRef] [PubMed]
4. McNab, J.A.; Edlow, B.L.; Witzel, T.; Huang, S.Y.; Bhat, H.; Heberlein, K.; Feiweier, T.; Liu, K.; Keil, B.; Cohen-Adad, J.; et al. The
Human Connectome Project and beyond: initial applications of 300 mT/m gradients. Neuroimage 2013, 80, 234–245. [CrossRef]
5. Hagmann, P.; Grant, P.E.; Fair, D.A. MR connectomics: A conceptual framework for studying the developing brain. Front. Syst.
Neurosci. 2012, 6, 43. [CrossRef]
6. Craddock, R.C.; Milham, M.P.; LaConte, S.M. Predicting intrinsic brain activity. Neuroimage 2013, 82, 127–136. [CrossRef]
[PubMed]
7. Ball, G.; Aljabar, P.; Zebari, S.; Tusor, N.; Arichi, T.; Merchant, N.; Robinson, E.C.; Ogundipe, E.; Rueckert, D.; Edwards, A.D.; et al.
Rich-club organization of the newborn human brain. Proc. Natl. Acad. Sci. USA 2014, 111, 7456–7461. [CrossRef] [PubMed]
8. Ardesch, D.J.; Scholtens, L.H.; van den Heuvel, M.P. The human connectome from an evolutionary perspective. Prog. Brain Res.
2019, 250, 129–151. [CrossRef]
9. Fox, M.D. Mapping Symptoms to Brain Networks with the Human Connectome. N. Engl. J. Med. 2018, 379, 2237–2245. [CrossRef]
[PubMed]
10. Graham, D.J. Routing in the brain. Front. Comput. Neurosci. 2014, 8, 44. [CrossRef] [PubMed]
11. Lazarou, I.; Georgiadis, K.; Nikolopoulos, S.; Oikonomou, V.P.; Tsolaki, A.; Kompatsiaris, I.; Tsolaki, M.; Kugiumtzis, D. A
Novel Connectome-Based Electrophysiological Study of Subjective Cognitive Decline Related to Alzheimer’s Disease by Using
Resting-State High-Density EEG EGI GES 300. Brain Sci. 2020, 10, 392. [CrossRef] [PubMed]
12. Alexander-Bloch, A.F.; Reiss, P.T.; Rapoport, J.; McAdams, H.; Giedd, J.N.; Bullmore, E.T.; Gogtay, N. Abnormal Cortical Growth
in Schizophrenia Targets Normative Modules of Synchronized Development. Biol. Psychiatry 2014. [CrossRef] [PubMed]
13. Chen, V.C.H.; Lin, T.Y.; Yeh, D.C.; Chai, J.W.; Weng, J.C. Functional and Structural Connectome Features for Machine Learning
Chemo-Brain Prediction in Women Treated for Breast Cancer with Chemotherapy. Brain Sci. 2020, 10, 851. [CrossRef] [PubMed]
14. Besson, P.; Dinkelacker, V.; Valabregue, R.; Thivard, L.; Leclerc, X.; Baulac, M.; Sammler, D.; Colliot, O.; Lehéricy, S.;
Samson, S.; et al. Structural connectivity differences in left and right temporal lobe epilepsy. Neuroimage 2014, 100C, 135–144.
[CrossRef] [PubMed]Brain Sci. 2021, 11, 342 11 of 12
15. Szalkai, B.; Kerepesi, C.; Varga, B.; Grolmusz, V. The Budapest Reference Connectome Server v2. 0. Neurosci. Lett. 2015, 595, 60–62.
[CrossRef] [PubMed]
16. Szalkai, B.; Kerepesi, C.; Varga, B.; Grolmusz, V. Parameterizable Consensus Connectomes from the Human Connectome Project:
The Budapest Reference Connectome Server v3.0. Cogn. Neurodyn. 2017, 11, 113–116. [CrossRef] [PubMed]
17. Kerepesi, C.; Szalkai, B.; Varga, B.; Grolmusz, V. Comparative Connectomics: Mapping the Inter-Individual Variability of
Connections within the Regions of the Human Brain. Neurosci. Lett. 2018, 662, 17–21. [CrossRef]
18. Kerepesi, C.; Szalkai, B.; Varga, B.; Grolmusz, V. How to Direct the Edges of the Connectomes: Dynamics of the Consensus
Connectomes and the Development of the Connections in the Human Brain. PLoS ONE 2016, 11, e0158680. [CrossRef]
19. Kerepesi, C.; Varga, B.; Szalkai, B.; Grolmusz, V. The Dorsal Striatum and the Dynamics of the Consensus Connectomes in the
Frontal Lobe of the Human Brain. Neurosci. Lett. 2018, 673, 51–55. [CrossRef] [PubMed]
20. Szalkai, B.; Kerepesi, C.; Varga, B.; Grolmusz, V. High-Resolution Directed Human Connectomes and the Consensus Connectome
Dynamics. PLoS ONE 2019, 14, e0215473. [CrossRef]
21. Szalkai, B.; Varga, B.; Grolmusz, V. The Robustness and the Doubly-Preferential Attachment Simulation of the Consensus
Connectome Dynamics of the Human Brain. Sci. Rep. 2017, 7. [CrossRef]
22. Fellner, M.; Varga, B.; Grolmusz, V. The Frequent Subgraphs of the Connectome of the Human Brain. Cogn. Neurodyn. 2019,
13, 453–460. [CrossRef]
23. Fellner, M.; Varga, B.; Grolmusz, V. The frequent complete subgraphs in the human connectome. PLoS ONE 2020, 15, e0236883.
[CrossRef] [PubMed]
24. Fellner, M.; Varga, B.; Grolmusz, V. The frequent network neighborhood mapping of the human hippocampus shows much more
frequent neighbor sets in males than in females. PLoS ONE 2020, 15, e0227910. [CrossRef]
25. Fellner, M.; Varga, B.; Grolmusz, V. Good Neighbors, Bad Neighbors: The Frequent Network Neighborhood Mapping of the
Hippocampus Enlightens Several Structural Factors of the Human Intelligence on a 414-Subject Cohort. Sci. Rep. 2020, 10, 1–7.
[CrossRef]
26. Szalkai, B.; Varga, B.; Grolmusz, V. Graph Theoretical Analysis Reveals: Women’s Brains Are Better Connected than Men’s. PLoS
ONE 2015, 10, e0130045. [CrossRef] [PubMed]
27. Holm, S. A simple sequentially rejective multiple test procedure. Scand. J. Stat. 1979, 6, 65–70.
28. Daducci, A.; Gerhard, S.; Griffa, A.; Lemkaddem, A.; Cammoun, L.; Gigandet, X.; Meuli, R.; Hagmann, P.; Thiran, J.P. The
connectome mapper: an open-source processing pipeline to map connectomes with MRI. PLoS ONE 2012, 7, e48121. [CrossRef]
29. Fischl, B. FreeSurfer. Neuroimage 2012, 62, 774–781. [CrossRef]
30. Desikan, R.S.; Ségonne, F.; Fischl, B.; Quinn, B.T.; Dickerson, B.C.; Blacker, D.; Buckner, R.L.; Dale, A.M.; Maguire, R.P.;
Hyman, B.T.; et al. An automated labeling system for subdividing the human cerebral cortex on MRI scans into gyral based
regions of interest. Neuroimage 2006, 31, 968–980. [CrossRef]
31. Tournier, J.; Calamante, F.; Connelly, A. MRtrix: Diffusion tractography in crossing fiber regions. Int. J. Imaging Syst. Technol.
2012, 22, 53–66. [CrossRef]
32. Achterberg, T.; Berthold, T.; Koch, T.; Wolter, K. Constraint integer programming: A new approach to integrate CP and MIP. In
Integration of AI and OR Techniques in Constraint Programming for Combinatorial Optimization Problems; Springer: Berlin, Germany,
2008; pp. 6–20.
33. Achterberg, T. SCIP: Solving constraint integer programs. Math. Program. Comput. 2009, 1, 1–41. [CrossRef]
34. Hoel, P.G. Introduction to Mathematical Statistics, 5th ed.; John Wiley & Sons, Inc.: New York, NY, USA, 1984.
35. Wonnacott, T.H.; Wonnacott, R.J. Introductory Statistics; Wiley: New York, NY, USA, 1972; Volume 19690.
36. Witelson, S.F.; Beresh, H.; Kigar, D.L. Intelligence and brain size in 100 postmortem brains: Sex, lateralization and age factors.
Brain 2006, 129, 386–398. [CrossRef] [PubMed]
37. Szalkai, B.; Varga, B.; Grolmusz, V. Brain Size Bias-Compensated Graph-Theoretical Parameters are Also Better in Women’s
Connectomes. Brain Imaging Behav. 2018, 12, 663–673. [CrossRef] [PubMed]
38. Basser, P.J.; Pierpaoli, C. Microstructural and physiological features of tissues elucidated by quantitative-diffusion-tensor MRI.
J. Magn. Reson. 1996, 213, 560–570. [CrossRef]
39. Jahanshad, N.; Aganj, I.; Lenglet, C.; Joshi, A.; Jin, Y.; Barysheva, M.; McMahon, K.L.; De Zubicaray, G.; Martin, N.G.;
Wright, M.J.; et al. Sex differences in the human connectome: 4-Tesla high angular resolution diffusion imaging (HARDI)
tractography in 234 young adult twins. In Proceedings of the 2011 IEEE International Symposium on Biomedical Imaging: From
Nano to Macro, Chicago, IL, USA, 30 March–2 April 2011; pp. 939–943.
40. Ingalhalikar, M.; Smith, A.; Parker, D.; Satterthwaite, T.D.; Elliott, M.A.; Ruparel, K.; Hakonarson, H.; Gur, R.E.; Gur, R.C.; Verma,
R. Sex differences in the structural connectome of the human brain. Proc. Natl. Acad. Sci. USA 2014, 111, 823–828. [CrossRef]
41. Lovasz, L. Eigenvalues of Graphs; Technical report; Department of Computer Science, Eotvos University, Pazmany Peter 1/C,
H-1117: Budapest, Hungary, 2007.
42. Hoory, S.; Linial, N.; Wigderson, A. Expander graphs and their applications. Bull. Am. Math. Soc. 2006, 43, 439–561. [CrossRef]
43. Kirchhoff, G. Über die Auflösung der Gleichungen, auf welche man bei der Untersuchung der linearen Vertheilung galvanischer
Ströme geführt wird. Ann. Phys. Chem. 1847, 72, 497–508. [CrossRef]
44. Chung, F.R. Spectral Graph Theory; American Mathematical Soc.: Providence, RI, USA, 1997; Volume 92.Brain Sci. 2021, 11, 342 12 of 12
45. Tarjan, R.E. Data Structures and Network Algorithms. In CBMS-NSF Regional Conference Series in Applied Mathematics; Society for
Industrial Applied Mathematics: Philadelphia, PA, USA, 1983.
46. Garey, M.R.; Johnson, D.S.; Stockmeyer, L. Some simplified NP-complete graph problems. Theor. Comput. Sci. 1976, 1, 237–267.
[CrossRef]
47. Lawler, E.L. Combinatorial Optimization: Networks and Matroids; Courier Dover Publications: New York, NY, USA, 1976.
48. Hochbaum, D.S. Approximation algorithms for the set covering and vertex cover problems. SIAM J. Comput. 1982, 11, 555–556.
[CrossRef]
49. Dally, W.J.; Towles, B. Principles and Practices of Interconnection Networks; Elsevier: Amsterdam, The Netherlands, 2007.
50. Wright, A.K.; Theilmann, R.J.; Ridgway, S.H.; Scadeng, M. Diffusion tractography reveals pervasive asymmetry of cere-
bral white matter tracts in the bottlenose dolphin (Tursiops truncatus). Brain Struct. Funct. 2018, 223, 1697–1711.
[CrossRef] [PubMed]
51. Charvet, C.J.; Hof, P.R.; Raghanti, M.A.; Kouwe, A.J.V.D.; Sherwood, C.C.; Takahashi, E. Combining diffusion magnetic resonance
tractography with stereology highlights increased cross-cortical integration in primates. J. Comp. Neurol. 2017, 525, 1075–1093.
[CrossRef] [PubMed]
52. Corballis, M.C. Evolution of cerebral asymmetry. Prog. Brain Res. 2019, 250, 153–178. [CrossRef] [PubMed]You can also read