Genome-Wide DNA Methylation and LncRNA-Associated DNA Methylation in Metformin-Treated and -Untreated Diabetes - MDPI
←
→
Page content transcription
If your browser does not render page correctly, please read the page content below
epigenomes
Article
Genome-Wide DNA Methylation and
LncRNA-Associated DNA Methylation in
Metformin-Treated and -Untreated Diabetes
Wendy L. Solomon 1 , Stanton B. E. Hector 1 , Shanel Raghubeer 1 , Rajiv T. Erasmus 2 ,
Andre P. Kengne 3,4 and Tandi E. Matsha 1, *
 1   SAMRC/CPUT/Cardiometabolic Health Research Unit, Department of Biomedical Sciences,
     Faculty of Health and Wellness Science, Cape Peninsula University of Technology, P.O. Box 1906, Bellville,
     Cape Town 7530, South Africa; solomonw@cput.ac.za (W.L.S.); hectors@cput.ac.za (S.B.E.H.);
     shanelraghubeer@gmail.com (S.R.)
 2   Division of Chemical Pathology, Faculty of Health Sciences, National Health Laboratory Service (NHLS) and
     University of Stellenbosch, Cape Town 7505, South Africa; rte@sun.ac.za
 3   Non-Communicable Diseases Research Unit, South African Medical Research Council, Cape Town 7505,
     South Africa; andre.kengne@mrc.ac.za
 4   Department of Medicine, University of Cape Town, Cape Town 7700, South Africa
 *   Correspondence: matshat@cput.ac.za; Tel.: +27-21-959-6366; Fax: +27-21-959-6760

 Received: 8 July 2020; Accepted: 14 August 2020; Published: 1 September 2020

 Abstract: Metformin, which is used as a first line treatment for type 2 diabetes mellitus (T2DM),
 has been shown to affect epigenetic patterns. In this study, we investigated the DNA methylation
 and potential lncRNA modifications in metformin-treated and newly diagnosed adults with T2DM.
 Genome-wide DNA methylation and lncRNA analysis were performed from the peripheral blood
 of 12 screen-detected and 12 metformin-treated T2DM individuals followed by gene ontology
 (GO) and KEGG pathway analysis. Differentially methylated regions (DMRs) observed showed
 22 hypermethylated and 11 hypomethylated DMRs between individuals on metformin compared
 to screen-detected subjects. Amongst the hypomethylated DMR regions were the SLC gene family,
 specifically, SLC25A35 and SLC28A1. Fifty-seven lncRNA-associated DNA methylation regions
 included the mitochondrial ATP synthase-coupling factor 6 (ATP5J). Functional gene mapping and
 pathway analysis identified regions in the axon initial segment (AIS), node of Ranvier, cell periphery,
 cleavage furrow, cell surface furrow, and stress fiber. In conclusion, our study has identified a number
 of DMRs and lncRNA-associated DNA methylation regions in metformin-treated T2DM that are
 potential targets for therapeutic monitoring in patients with diabetes.

 Keywords: metformin; DNA methylation; lncRNA; diabetes mellitus; Africa

1. Introduction
     DNA methylation, the most widely studied epigenetic mechanism, involves the covalent addition
of a methyl group at the 50 position of the cytosine ring within the 50 -CpG-30 dinucleotides to create
a 5-methylcytosine (5-mC). The target of DNA methylation, catalyzed by DNA methyltransferases
(DNMTs) enzymes, are CpG nucleotides, which are usually unmethylated [1]. These CpG nucleotides
occur at high-frequency in the promoter regions of genes and are frequently associated with hyper- or
hypomethylation events [2]. Hypermethylation of promoter CpG islands can result in suppression
of gene expression, whereas hypomethylation is associated with the transcriptional activation of
affected genes [3]. Various studies suggest that these modifications may alter the transcriptional
activity of genes and contribute to pathogenic conditions, such as the type 2 diabetes mellitus (T2DM)

Epigenomes 2020, 4, 19; doi:10.3390/epigenomes4030019                         www.mdpi.com/journal/epigenomes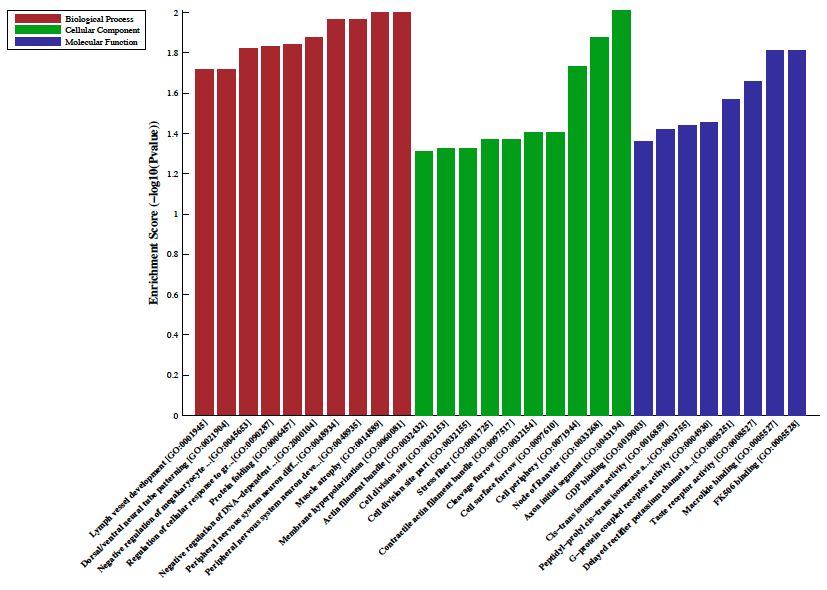
Epigenomes 2020, 4, 19                                                                                2 of 11

phenotype [4,5]. Studies also indicate that response to anti-diabetic agents and occurrence of diabetes
complications can result from the actions of DNA methylation [4,6].
     Although progression of disease cannot solely be attributed to DNA methylation, the impact of
long non-coding RNAs (lncRNAs) on biological and pathologic processes have also been linked to
various conditions including cancers and metabolic diseases [7,8]. LncRNAs are transcription products
greater than 200 nucleotides with limited protein coding function [9]. They have been implicated
in the regulation gene expression at the epigenetic, transcriptional, and post-transcription level [10].
Studies show that lncRNAs may also play a role in the diagnosis and therapeutic management of
diabetes due to their involvement in regulatory processes and complications of T2DM [11,12].
     Metformin, a drug commonly used for the treatment of T2DM, is highly effective with minimal
side effects [13]. It has the ability to promote the phosphorylation and activation of AMP-activated
protein kinase (AMPK), which results in the inhibition of gluconeogenic genes. In addition to glucose
metabolism, the activation of AMPK impacts other pathways, such as lipid metabolism, mitochondrial
biogenesis, autophagy, cell growth, and circadian rhythm [14]. Once activated, AMPK phosphorylates
epigenetic enzymes, such as DNA methyltransferases (DNMTs), resulting in their inhibition [15].
The effects of metformin on DNA methylation include both hypo- and hypermethylation at the
promoters of different genes, which in turn, could act to enhance or suppress gene expression [16–19].
Metformin was shown to affect DNA methylation even in healthy individuals immediately 10 h after
drug administration [19]. These alterations in DNA methylation has also been evident in cancer related
studies, showing that DNA methylation plays a role in the antidiabetic and potential anti-cancer
actions of metformin [15,20–22].
     Despite recent advances in the role of DNA methylation and diabetes, data on its effect in those
under treatment with metformin in Africa are lacking. We, therefore, aimed to characterize the DNA
methylation modifications in newly diagnosed and metformin-treated South Africans with T2DM.
The knowledge gained could be used as a basis for further studies to elucidate the role of DNA
methylation in the monitoring and treatment of T2DM within a South African context.

2. Results

2.1. Clinical Characteristics of the Study Population
     The general clinical characteristics of the study population are summarized in Table 1. The study
sample comprised 24 participants—12 screen-detected and 12 metformin-treated T2DM. There were
no significant differences between the two groups in all the clinical characteristics. The duration of
disease in the metformin-treated T2DM ranged from 0.5 to 17 with an average of 5.2 years.

                             Table 1. Clinical characteristics of the study population.

                                                      Screen-Detected           Known Diabetes
                                                      Diabetes Mellitus            Mellitus
                   Characteristics                         n = 12                   n = 12        p-Value

                                                          Mean ± SD                Mean ± SD
                     Age (years)                           54.8 ± 7.5               53.2 ± 9.6     0.658
             Body mass index (kg/m2 )                      33.5 ± 8.9               29.4 ± 5.0     0.174
             Waist circumference (cm)                     101.3 ± 19.7             91.7 ± 10.5     0.150
              Hip circumference (cm)                      109.4 ± 16.6             103.3 ± 11.9    0.311
                   Waist hip ratio                        0.92 ± 0.07               0.89 ± 0.05    0.195
          Systolic blood pressure (mmHg)                  142.9 ± 32.9             136.3 ± 25.9    0.587
         Diastolic blood pressure (mmHg)                   94.2 ± 22.1              83.8 ± 11.5    0.165
         Fasting plasma glucose (mmol/L)                    9.1 ± 3.6                11.0 ± 5.8    0.352
         Post 2-h plasma glucose (mmol/L)                 16.5 ± 4.71                     -          -
                     HbA1c (%)                             7.97 ± 2.58              9.33 ± 3.04    0.254
           Fasting serum insulin (mIU/L)                   15.3 ± 10.6               11.3 ± 7.6    0.316
Epigenomes 2020, 4, 19 3 of 11
Table 1. Cont.
Screen-Detected Known Diabetes
Diabetes Mellitus Mellitus
Characteristics n = 12 n = 12 p-Value
Mean ± SD Mean ± SD
Triglycerides (mmol/L) 2.18 ± 1.35 2.02 ± 0.96 0.760
Total cholesterol (mmol/L) 6.36 ± 0.85 6.10 ± 1.47 0.607
Low-density lipoprotein-cholesterol (mmol/L) 4.17 ± 0.84 4.08 ± 1.22 0.831
High-density lipoprotein-cholesterol (mmol/L) 1.38 ± 0.58 1.23 ± 0.35 0.448
Ultrasensitive C-reactive protein (mg/L) 11.1 ± 12.3 14.4 ± 12.5 0.531
Serum cotinine (ng/mL) 127.4 ± 149.5 120.7 ± 179.7 0.921
Gamma-glutamyl transferase (IU/L) 64.5 ± 57.4 43.7 ± 27.2 0.287
2.2. Differentially Methylated Regions, LncRNA-Associated DNA Methylation, Gene Ontology (GO) and
Pathway Analysis
A total of 33 differentially methylated regions (DMRs) were observed between individuals
on metformin treatment compared to screen-detected subjects. Of these, 22 were hypermethylated,
whilst another 11 were hypomethylated in participants treated with metformin, and these are
summarized in Table 2. Lnc-associated DNA methylation peaks in the promoter regions are summarized
in Table 3 showing that 36 were hypermethylated, and 21 were hypomethylated in individuals
on metformin. KEGG pathway analysis revealed no enriched pathways. Based on GO analyses,
we retrieved the biological process, cellular process, and molecular function of the DMRs, and these
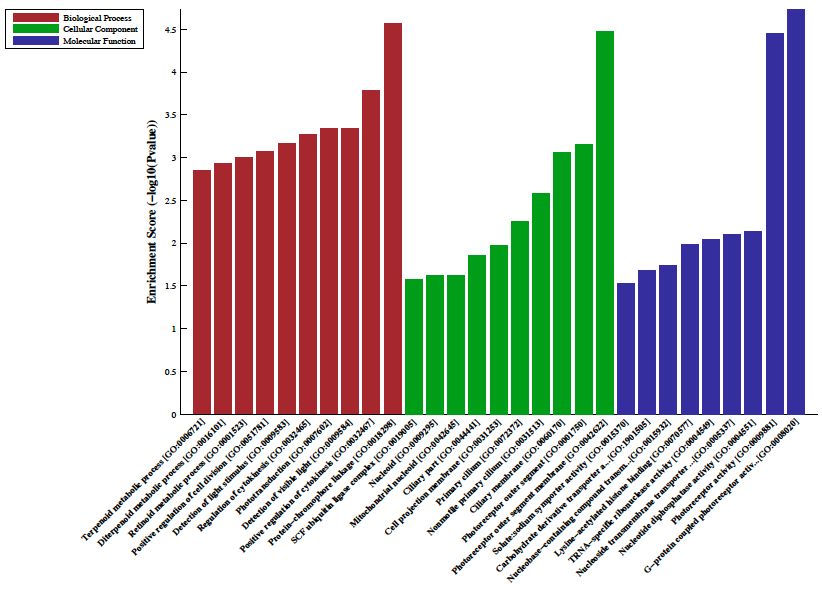
are presented in Figures 1 and 2. The top enrichment scores for cellular processes of hypermethylated
DMRs in subjects on metformin were associated with the axon initial segment, node of Ranvier, cell
periphery, cleavage furrow, cell surface furrow, and stress fiber (Figure 1), whilst the hypomethylated
biological processes were associated with photoreceptor outer segment (Figure 2).
Table 2. Differentially methylated regions (DMRs) in T2DM on metformin versus newly diagnosed cases.
Hypermethylated DMRs
Gene Name Genomic Coordinates DMR Length log2 FC p-Value q-Value
XAGE1E chrX:52260741-52261020 279 1.66Epigenomes 2020, 4, 19 4 of 11
Table 2. Cont.
Hypomethylated DMRs
TPD52L2 chr20:62497561-62497920 359 −1Epigenomes 2020, 4, 19 5 of 11
Table 3. Cont.
Epigenomes 2020, 4, x FOR PEER REVIEW Hypomethylated 5 of 11
SSH1 chr12:109199901-109200160 259 −1.12Epigenomes 2020, 4, 19 6 of 11
Epigenomes 2020, 4, x FOR PEER REVIEW 6 of 11
Figure 2. Gene ontology (GO) enrichment analysis of the differentially hypomethylated genes in
Figure 2. Gene ontology (GO) enrichment analysis of the differentially hypomethylated genes in
metformin-treated diabetes. The bar plot shows the top ten enrichment score values of the significant
metformin-treated diabetes. The bar plot shows the top ten enrichment score values of the significant
enrichment terms. Enriched GO terms were categorized into biological processes, cellular components,
enrichment terms. Enriched GO terms were categorized into biological processes, cellular
and molecular function. Data are presented as enriched scores expressed as −log10 (p value).
components, and molecular function. Data are presented as enriched scores expressed as −log10 (p
value).
3. Discussion
In this study, we measured DNA methylation in diabetic individuals on metformin treatment
3. Discussion
compared to newly diagnosed diabetes cases and found 33 differentially methylated regions (DMRs)
In this
of which study,were
22 (67%) we measured DNA methylation
hypermethylated in diabetesinsubjects
diabeticon individuals
metforminon metformin
therapy. treatment
Furthermore,
compared to newly diagnosed diabetes cases and found 33 differentially
57 lncRNA-associated DNA Methylation regions (36 hypermethylated and 21 hypomethylated) methylated regions (DMRs)
were
of whichof
detected 22which
(67%) were hypermethylated
63% were hypermethylated in diabetes subjects on metformin
in metformin-treated therapy.
subjects. Furthermore,
Functional pathway 57
lncRNA-associated DNA Methylation regions (36 hypermethylated and
analysis of these DMRs revealed that they affect gene expression in the axon initial segment (AIS), 21 hypomethylated) were
detected
node of which
of Ranvier, cell63% were hypermethylated
periphery, cleavage furrow, cell in metformin-treated
surface furrow, andsubjects. Functional pathway
stress fiber.
analysis of these DMRs revealed that they affect gene expression
Amongst the hypomethylated DMRs found in this study were genes in the SLC family, in the axon initial segment (AIS),
specifically
node of Ranvier, cell periphery, cleavage furrow, cell surface furrow,
SLC25A35 and SLC28A1. The SLC family is known for its importance in drug development, and their and stress fiber.
Amongst
proteins includethe hypomethylated
passive transporters,DMRs found and
symporters, in this study were
antiporters and aregenes in the
located SLC family,
in cellular and
specifically SLC25A35 and SLC28A1. The SLC family is known
organelle membranes [23]. Transporters facilitate the movement of a specific substrate across the for its importance in drug
development,
membrane withand their proteins
or against include passive
its concentration gradient transporters,
and sequence symporters,
analysis and antiporters
of SLC25A35 and are
indicates
located
that in cellular
it likely functionsand asorganelle membranes
an oxaloacetate carrier,[23]. Transporters
implying facilitate
mitochondrial the movement
association [24]. Onof the
a specific
other
substrate across the membrane with or against its concentration gradient
hand, SLC28A1, a high-affinity pyrimidine nucleoside transporter, plays a role in renal reabsorption and sequence analysis of
SLC25A35 indicates that it likely functions as an oxaloacetate carrier,
and has been observed to be impaired during diabetes [25]. Metformin treatment has been associated implying mitochondrial
association
with [24]. On the levels
lower methylation other in hand,
SLCSLC28A1,
transporter a high-affinity
genes, as waspyrimidine
shown in nucleoside transporter,
a study conducted on
plays a role in renal reabsorption and has been observed to be impaired
metformin transporter genes in liver tissue [18]. Mitochondrial dysfunction due to diabetes affects during diabetes [25].
Metformin
oxidative treatment has been
phosphorylation associatedATP
and decreases withproduction.
lower methylation
As SLC levels
proteinsin transport
SLC transporter
variousgenes, as
solutes
was shown in a study conducted on metformin transporter genes in
across the mitochondrial membrane in order to partake in a number of metabolic pathways [26,27],liver tissue [18]. Mitochondrial
dysfunction
the decrease in due to diabetes
methylation and affects oxidative
subsequent phosphorylation
increase and decreases
in gene expression ATP production.
of SLC transporters could beAs
SLC proteins
indicative of thetransport various
antidiabetic solutes
effect across the
of metformin mitochondrial
treatment. membrane
It is, therefore, likelyin that
order to partakeinin
metformin itsa
number of metabolic pathways [26,27], the decrease in methylation and subsequent increase in gene
expression of SLC transporters could be indicative of the antidiabetic effect of metformin treatment.Epigenomes 2020, 4, 19 7 of 11
demethylation action of SLC mitochondrial carriers could possibly aid cell repair in these patients,
however, this requires further investigation.
Functional pathway analysis observed in this study is consistent with the basic pathological
abnormalities in Diabetic Peripheral Neuropathy (DPN), such as axonal degeneration and
demyelination, lack of sensation, numbness, paresthesia, and allodynia experienced by diabetic
individuals [28]. Cell death of nerves in DPN results from multifactorial metabolic imbalances
associated with diabetes. The resulting mitochondrial dysfunction through a series of cascade effects
involving AMP-activated protein kinase (AMPK), sirtuin (SIRT), and peroxisome proliferator-activated
receptor-γ coactivator α (PGCα) suppresses mitochondrial oxidative phosphorylation, resulting in
neuronal and axonal degeneration through increased oxidative injury [29,30].
Treatment with metformin was shown to decrease the incidence of DPN as was observed by the
Bypass Angioplasty Revascularization Investigation 2 Diabetes trial [31]. Although metformin cannot
reverse the nerve damage caused by diabetes, it could assist in managing blood glucose levels and
improving the symptoms for patients.
In addition to DMRs, 57 lncRNA-associated DNA Methylation Peaks were detected when
comparing known diabetic individuals to screen detected patients. Most recently the NONCODE
database has updated the numbers of human lncRNAs to 167,150 with numbers still increasing [32].
Recent genome-wide association studies (GWAS) have shown positive correlation of some lncRNAs
and diabetes [33]. In a related study, Sathishkumar et al. (2018) found increased levels of lncRNAs
in T2DM patients, including HOTAIR, MEG3, LET, MALAT1, MIAT, CDKN2BAS1/ANRIL, XIST,
PANDA, GAS5, Linc-p21, ENST00000550337.1, PLUTO, NBR2THRIL, and SALRNA1. The majority
of these lncRNAs were involved in cell cycle regulation and senescence with their expression levels
correlating to poor glycemic control, insulin resistance, and inflammation [11]. Similarly, HECTD4 and
MBTPS1 were identified as the target genes for lncRNAs ENST00000364558 and ENST00000565382,
respectively, with involvement in the development of T2DM by means of the lysosome and phagocytic
signaling pathways [34]. Our findings indicate several novel lncRNA, including a lncRNA associated
with the mitochondrial ATP synthase-coupling factor 6 (ATP5J) enzyme thought to be involved in the
oxidative phosphorylation pathway [35]. Our data suggest higher methylation levels of this lncRNA
in metformin-treated subjects, possibly pointing to suppression of this lncRNA allowing for ATP5J
expression. Although little association was found between metformin and lncRNAs in our study,
the significant novel lncRNA identified warrants further investigation to explore possible roles in
type 2 diabetes.
The limitations of this study include the small sample size and the inclusion of women only;
however, this allowed comparison and limited error that may result in statistical manipulation of a small
sample size by sex. Furthermore, we used peripheral blood DNA to perform the genome-wide DNA
methylation analysis. Epigenetic changes are believed to be organ specific; however, investigations
on peripheral blood DNA have shown consistent methylation patterns with other organs [36,37].
Although the average (5.2 years) duration of disease in metformin-treated subjects was within the four
to six years in which a person may have had the condition before clinical diagnosis [38], these findings
should be interpreted with caution. In conclusion, our study has identified a number of DMRs and
lncRNA-associated DNA methylation regions in metformin-treated T2DM that are potential targets for
therapeutic monitoring in diabetes patients. However, these findings require further longitudinal study
investigations that can clearly ascertain that these observations are not confounded by the duration
and severity of diabetes.
4. Materials and Methods
4.1. Ethical Approval of the Study
This investigation used data from the Cape Town Vascular and Metabolic Health (VMH) study),
which were approved by the Research Ethics Committees of the Cape Peninsula University ofEpigenomes 2020, 4, 19 8 of 11
Technology and Stellenbosch University (resp., NHREC: REC-230 408-014 and N14/01/003; approved
date: 21 May 2018). The Code of Ethics of the World Medical Association (Declaration of Helsinki)
was also applied to the study. Signed written consent was obtained from all participants after all
procedures were explained in the language of their choice.
4.2. Study Procedures
In this case-control study, the participants were females matched for both age and body mass
index. All study participants underwent a standardized interview, blood pressure, and anthropometric
measurements. A 75 g oral glucose tolerance test (OGTT) was performed on participants with no previous
diagnosis of diabetes mellitus. Participants who met the World Health Organisation (WHO) criteria
for diabetes were termed as screen-detected or newly diagnosed diabetes. Biochemical parameters
analyzed at an ISO 15189 accredited pathology practice (PathCare, Reference Laboratory, Cape Town,
South Africa) included the following: plasma glucose, serum insulin, serum creatinine, total cholesterol
(TC), high-density lipoprotein cholesterol (HDL-c), triglycerides (TG), low-density lipoprotein cholesterol
(LDL), C-reactive protein (CRP), γ-glutamyl transferase (GGT), AST, ALT, and glycated hemoglobin
(HbA1c), certified by the National Glycohemoglobin Standardization Program (NGSP). In addition,
a full blood count was also done for all participants, and ethylenediaminetetraacetic acid (EDTA) treated
blood samples were stored at −20 degrees Celsius for DNA extraction and analysis.
4.3. Genome-Wide DNA Methylation Sequencing
Genomic DNA was extracted from peripheral blood using the Wizard Genomic DNA Purification
Kit (Promega, Madison, WI, USA) according to the manufacturer’s instructions. At least 2 µg of DNA
(concentrations ranging between 70 and 130 ng/µL) with A260/A280 and A260/A230 ratios ≥ 1.8 was
shipped frozen on dry ice, as instructed by Arraystar Inc. (Rockville, MD, USA). Methylated DNA
immunoprecipitation (MeDIP) was performed by Arraystar Inc. (Rockville, MD, USA) according
to Down et al. [39], with minor modifications as follows. About 1 µg of fragmented DNA was
prepared for Illumina HiSeq 4000 sequencing as the following steps: (1) end repair of DNA samples
with T4 DNA polymerase, Klenow DNA polymerase, and T4 PNK; (2) a single ‘A’ base was
added to the 3’ ends with Klenow (exo minus) polymerase; (3) Illumina’s genomic adapters were
ligated to DNA fragments; (4) DNA fragments were immunoprecipitated by anti-5-methylcytosine
antibody (Diagenode); (5) immunoprecipitated DNA fragments were amplified by PCR amplification;
(6) ~300–600 bp DNA fragments were extracted by gel purification. The completed libraries were
quantified by Agilent 2100 Bioanalyzer (Agilent Technologies, Santa Clara, CA, USA). The libraries
were denatured with 0.1 M NaOH to generate single-stranded DNA molecules, captured on Illumina
flow cell, amplified in situ. The libraries were then sequenced on the Illumina HiSeq 4000 following
the TruSeq SBS Kit v5 protocol. The enrichment of DNA immunoprecipitation was analyzed by qPCR
using specific methylated sites at H19 locus and non-methylated sites at GAPDH.
4.4. MeDIP-Seq Data Analysis
The enrichment of DNA immunoprecipitation was analyzed by qPCR using specific methylated
sites at H19 locus and non-methylated sites at GAPDH. Image analysis and base calling were performed
using Off-Line Basecaller software (OLB V1.8). After passing a Solexa CHASTITY quality filter, the clean
reads were aligned to the human genome (UCSC HG19) using HISAT2 software (V2.1.0). Briefly,
individual bases generated from original image files have quality scores, which reflect the probability
whether base calling is correct or not. The score is calculated by CHASTITY Formula. The CHASTITY
(C) of each base in the short reads is determined by the intensity of four colors (IA, IC, IG, and IT
here), and the formula means “the ratio of the highest (IC here) of the four (base type) intensities to
the sum of highest two (IC and IG here).” The CHASTITY (C) should be no less than 0.6 in the first
25 bases. Statistically significant MeDIP-enriched regions (peaks) detected by MACS v2 were identified
by comparison to input background, using a q-value threshold of 10−5 . The peaks in samples wereEpigenomes 2020, 4, 19 9 of 11
annotated by the nearest gene using the newest UCSC RefSeq database. Differentially methylated
regions (DMRs) located within gene promoters (TSS − 2000 bp, TSS + 2000 bp) with statistical
significance between the two groups were identified by diffReps (Cut-off: log2FC = 1.0, p-value = 10−4 ).
4.5. Gene Ontology (GO) and KEGG Pathway Analysis
The ontology covers three domains, namely biological process, cellular component, and molecular
function. Fisher’s exact test was used to determine whether there was more overlap between the DE
list and the GO annotation list than would be expected by chance. The p value denotes the significance
of GO terms enrichment in the DE genes. The lower the p value, the more significant the GO term;
a p value ≤ 0.05 was considered significant. Annotation was performed using standard workflow
according to http://geneontology.org/. Pathway analysis was done using the Kyoto Encyclopedia of
Genes and Genomes (KEGG) database. The p value (EASE score, Fisher’s p-value, or hypergeometric
p-value) denotes the significance of the pathway correlated to the conditions. The lower the p value is,
the more significant the pathway is; a p value ≤ 0.05 was considered significant.
Author Contributions: W.L.S.: wrote the first draft, experimental procedures, data analysis, and interpretation.
S.B.E.H.: co-drafted the manuscript, statistical analysis, and interpretation of data. S.R.: interpretation of data,
editing and revising it for intellectual content. R.T.E.: conception, interpretation of the data, revising it for
intellectual content and final approval of the version to be published. A.P.K.: conception, interpretation of the
data, revising it for intellectual content and final approval of the version to be published. T.E.M.: conception and
design of the study, analysis and interpretation of the data, revising it for intellectual content and final approval of
the version to be published. All authors have read and agreed to the published version of the manuscript.
Funding: This research project was supported by a grant from the South African Medical Research Council
(SAMRC), with funds from National Treasury under its Economic Competitiveness and Support Package
(MRC-RFA-UFSP-01-2013/VMH Study), South African National Research Foundation (SANRF) (Grant no. 115450).
Any opinions, findings, conclusions, or recommendations expressed in this article are those of the author(s),
and the SAMRC and/or SANRF do not accept any liability in this regard.
Acknowledgments: We thank the Bellville South community and their community Health Forum for supporting
the study. T.E.M. takes full responsibility for the work as a whole, including the study design, access to data,
and the decision to submit and publish the manuscript.
Conflicts of Interest: The authors declare no conflict of interests.
References
1. Deaton, A.; Bird, A. CpG islands and the regulation of transcription. Genes Dev. 2011, 25, 1010–1022.
[CrossRef] [PubMed]
2. Du, Q.; Luu, P.L.; Stirzaker, C.; Clark, S.J. Methyl-CpG-binding domain proteins: Readers of the epigenome.
Epigenomics 2015, 7, 1051–1073. [CrossRef] [PubMed]
3. Pasquier, J.; Hoarau-Vechot, J.; Fakhro, K.; Rafii, A.; Abi Khalil, C. Epigenetics and Cardiovascular Disease in
Diabetes. Curr. Diab. Rep. 2015, 15, 1–12. [CrossRef] [PubMed]
4. Bansal, A.; Pinney, S.E. DNA methylation and its role in the pathogenesis of diabetes. Pediatr. Diabetes 2017,
18, 167–177. [CrossRef]
5. Muka, T.; Nano, J.; Voortman, T.; Braun, K.V.E.; Ligthart, S.; Stranges, S.; Bramer, W.M.; Troup, J.;
Chowdhury, R.; Dehghan, A.; et al. The role of global and regional DNA methylation and histone
modifications in glycemic traits and type 2 diabetes: A systematic review. Nutr. Metab. Cardiovasc. Dis. 2016,
26, 553–566. [CrossRef]
6. Ronn, T.; Ling, C. DNA methylation as a diagnostic and therapeutic target in the battle against Type 2
diabetes. Epigenomics 2015, 7, 451–460. [CrossRef]
7. Li, Y.; Xu, K.; Xu, K.; Chen, S.; Cao, Y.; Zhan, H. Roles of Identified Long Noncoding RNA in Diabetic
Nephropathy. J. Diabetes Res. 2019, 2019, 1–8. [CrossRef]
8. Zhang, Y.; Jiang, X.; Wu, Z.; Hu, D.; Jia, J.; Guo, J.; Tang, T.; Yao, J.; Liu, H.; Tang, H. Long noncoding RNA
LINC00467 promotes glioma progression through inhibiting p53 expression via binding to DNMT1. J. Cancer
2020, 11, 2935–2944. [CrossRef]Epigenomes 2020, 4, 19 10 of 11
9. Huang, Y.; Li, J.; Chen, S.; Zhao, S.; Huang, J.; Zhou, J.; Xu, Y. Identification of Potential Therapeutic Targets
and Pathways of Liraglutide Against Type 2 Diabetes Mellitus (T2DM) Based on Long Non-Coding RNA
(lncRNA) Sequencing. Med. Sci. Monit. 2020, 26, e922210. [CrossRef]
10. Zhang, W.; Zheng, J.; Hu, X.; Chen, L. Dysregulated expression of long noncoding RNAs serves as diagnostic
biomarkers of type 2 diabetes mellitus. Endocrine 2019, 65, 494–503. [CrossRef]
11. Sathishkumar, C.; Prabu, P.; Mohan, V.; Balasubramanyam, M. Linking a role of lncRNAs (long non-coding
RNAs) with insulin resistance, accelerated senescence, and inflammation in patients with type 2 diabetes.
Hum. Genomics 2018, 12, 1–9. [CrossRef] [PubMed]
12. Leti, F.; DiStefano, J.K. Long noncoding RNAs as diagnostic and therapeutic targets in type 2 diabetes and
related complications. Genes 2017, 8, 207. [CrossRef] [PubMed]
13. Sanchez-Rangel, E.; Inzucchi, S.E. Metformin: Clinical use in type 2 diabetes. Diabetologia 2017, 60, 1586–1593.
[CrossRef] [PubMed]
14. Priya, G.; Kalra, S. Metformin in the management of diabetes during pregnancy and lactation. Drugs Context
2018, 7, 1–21. [CrossRef] [PubMed]
15. Bridgeman, S.C.; Ellison, G.C.; Melton, P.E.; Newsholme, P.; Mamotte, C.D.S. Epigenetic effects of metformin:
From molecular mechanisms to clinical implications. Diabetes Obes. Metab. 2018, 20, 1553–1562. [CrossRef]
[PubMed]
16. Zhong, T.; Men, Y.; Lu, L.; Geng, T.; Zhou, J.; Mitsuhashi, A.; Shozu, M.; Maihle, N.J.; Carmichael, G.G.;
Taylor, H.S.; et al. Metformin alters DNA methylation genome-wide via the H19/SAHH axis. Oncogene 2017,
36, 2345–2354. [CrossRef]
17. Ishikawa, K.; Tsunekawa, S.; Ikeniwa, M.; Izumoto, T.; Iida, A.; Ogata, H.; Uenishi, E.; Seino, Y.; Ozaki, N.;
Sugimura, Y.; et al. Long-term pancreatic beta cell exposure to high levels of glucose but not palmitate
induces DNA methylation within the insulin gene promoter and represses transcriptional activity. PLoS ONE
2015, 10, e0115350. [CrossRef]
18. García-Calzón, S.; Perfilyev, A.; Männistö, V.; de Mello, V.D.; Nilsson, E.; Pihlajamäki, J.; Ling, C.
Diabetes medication associates with DNA methylation of metformin transporter genes in the human
liver. Clin. Epigenetics 2017, 9, 1–9. [CrossRef]
19. Elbere, I.; Silamikelis, I.; Ustinova, M.; Kalnina, I.; Zaharenko, L.; Peculis, R.; Konrade, I.; Ciuculete, D.M.;
Zhukovsky, C.; Gudra, D.; et al. Significantly altered peripheral blood cell DNA methylation profile as a
result of immediate effect of metformin use in healthy individuals. Clin. Epigenetics 2018, 10, 156. [CrossRef]
20. Banerjee, P.; Surendran, H.; Chowdhury, D.R.; Prabhakar, K.; Pal, R. Metformin mediated reversal of epithelial
to mesenchymal transition is triggered by epigenetic changes in E-cadherin promoter. J. Mol. Med. 2016, 94,
1397–1409. [CrossRef]
21. Yu, X.; Mao, W.; Zhai, Y.; Tong, C.; Liu, M.; Ma, L.; Yu, X.; Li, S. Anti-tumor activity of metformin: From
metabolic and epigenetic perspectives. Oncotarget 2017, 8, 5619–5628. [CrossRef] [PubMed]
22. Cuyàs, E.; Fernández-Arroyo, S.; Verdura, S.; García, R.Á.F.; Stursa, J.; Werner, L.; Blanco-González, E.;
Montes-Bayón, M.; Joven, J.; Viollet, B.; et al. Metformin regulates global DNA methylation via mitochondrial
one-carbon metabolism. Oncogene 2018, 37, 963–970. [CrossRef] [PubMed]
23. Zhang, Y.; Zhang, Y.; Sun, K.; Meng, Z.; Chen, L. The SLC transporter in nutrient and metabolic sensing,
regulation, and drug development. J. Mol. Cell Biol. 2018, 11, 1–13. [CrossRef] [PubMed]
24. Haitina, T.; Lindblom, J.; Renström, T.; Fredriksson, R. Fourteen novel human members of mitochondrial
solute carrier family 25 (SLC25) widely expressed in the central nervous system. Genomics 2006, 88, 779–790.
[CrossRef]
25. Rodríguez-Mulero, S.; Errasti-Murugarren, E.; Ballarín, J.; Felipe, A.; Doucet, A.; Casado, F.J.;
Pastor-Anglada, M. Expression of concentrative nucleoside transporters SLC28 (CNT1, CNT2, and CNT3)
along the rat nephron: Effect of diabetes. Kidney Int. 2005, 68, 665–672. [CrossRef]
26. Palmieri, F. The mitochondrial transporter family SLC25: Identification, properties and physiopathology.
Mol. Aspects Med. 2013, 34, 465–484. [CrossRef]
27. Palmieri, F.; Monné, M. Discoveries, metabolic roles and diseases of mitochondrial carriers: A review.
Biochim. Biophys. Acta—Mol. Cell Res. 2016, 1863, 2362–2378. [CrossRef]
28. Guo, K.; Elzinga, S.; Eid, S.; Figueroa-Romero, C.; Hinder, L.M.; Pacut, C.; Feldman, E.L.; Hur, J. Genome-wide
DNA methylation profiling of human diabetic peripheral neuropathy in subjects with type 2 diabetes mellitus.
Epigenetics 2019, 14, 766–779. [CrossRef]Epigenomes 2020, 4, 19 11 of 11
29. Fernyhough, P. Mitochondrial Dysfunction in Diabetic Neuropathy: A Series of Unfortunate Metabolic
Events. Curr. Diab. Rep. 2015, 15, 24–27. [CrossRef]
30. Fujimaki, S.; Kuwabara, T. Diabetes-induced dysfunction of mitochondria and stem cells in skeletal muscle
and the nervous system. Int. J. Mol. Sci. 2017, 18, 2147. [CrossRef]
31. Pop-Busui, R.; Lu, J.; Brooks, M.M.; Albert, S.; Althouse, A.D.; Escobedo, J.; Green, J.; Palumbo, P.; Perkins, B.A.;
Whitehouse, F.; et al. Impact of glycemic control strategies ontheprogressionofdiabeticperipheral neuropathy
in the bypass angioplasty revascularization investigation 2 diabetes (BARI 2D) Cohort. Diabetes Care 2013,
36, 3208–3215. [CrossRef] [PubMed]
32. Zhao, X.Y.; Lin, J.D. Long Noncoding RNAs: A New Regulatory Code in Metabolic Control. Trends Biochem. Sci.
2015, 40, 586–596. [CrossRef] [PubMed]
33. Mirza, A.H.; Kaur, S.; Brorsson, C.A.; Pociot, F. Effects of GWAS-associated genetic variants on lncRNAs
within IBD and T1D candidate loci. PLoS ONE 2014, 9, e105723. [CrossRef] [PubMed]
34. Pengyu, Z.; Yan, Y.; Xiying, F.; Maoguang, Y.; Mo, L.; Yan, C.; Hong, S.; Lijuan, W.; Xiujuan, Z.; Hanqing, C.
The Differential Expression of Long Noncoding RNAs in Type 2 Diabetes Mellitus and Latent Autoimmune
Diabetes in Adults. Int. J. Endocrinol. 2020, 2020, 1–12. [CrossRef] [PubMed]
35. Huang, C.; Kim, Y.; Caramori, M.L.; Moore, J.H.; Rich, S.S.; Mychaleckyj, J.C.; Walker, P.C.; Mauer, M. Diabetic
nephropathy is associated with gene expression levels of oxidative phosphorylation and related pathways.
Diabetes 2006, 55, 1826–1831. [CrossRef] [PubMed]
36. Farré, P.; Jones, M.J.; Meaney, M.J.; Emberly, E.; Turecki, G.; Kobor, M.S. Concordant and discordant DNA
methylation signatures of aging in human blood and brain. Epigenetics Chromatin 2015, 8, 1–17. [CrossRef]
37. Crujeiras, A.B.; Diaz-Lagares, A.; Sandoval, J.; Milagro, F.I.; Navas-Carretero, S.; Carreira, M.C.; Gomez, A.;
Hervas, D.; Monteiro, M.P.; Casanueva, F.F.; et al. DNA methylation map in circulating leukocytes mirrors
subcutaneous adipose tissue methylation pattern: A genome-wide analysis from non-obese and obese
patients. Sci. Rep. 2017, 7, 41903. [CrossRef]
38. Porta, M.; Curletto, G.; Cipullo, D.; De la Longrais, R.R.; Trento, M.; Passera, P.; Taulaigo, A.V.; Di Miceli, S.;
Cenci, A.; Dalmasso, P.; et al. Estimating the Delay Between Onset and Diagnosis of Type 2 Diabetes From
the Time Course of Retinopathy Prevalence. Diabetes Care 2014, 37, 1668–1674. [CrossRef]
39. Down, T.A.; Rakyan, V.K.; Turner, D.J.; Flicek, P.; Li, H.; Kulesha, E.; Gräf, S.; Johnson, N.; Herrero, J.;
Tomazou, E.M.; et al. A Bayesian deconvolution strategy for immunoprecipitation- based DNA methylome
analysis. Nat. Biotechnol. 2008, 26, 779–785. [CrossRef]
© 2020 by the authors. Licensee MDPI, Basel, Switzerland. This article is an open access
article distributed under the terms and conditions of the Creative Commons Attribution
(CC BY) license (http://creativecommons.org/licenses/by/4.0/).You can also read