Supplementary Appendix - World Mosquito Program
←
→
Page content transcription
If your browser does not render page correctly, please read the page content below
Supplementary Appendix

This appendix has been provided by the authors to give readers additional information about their work.

Supplement to: Utarini A, Indriani C, Ahmad RA, et al. Efficacy of wolbachia-infected mosquito deployments for
the control of dengue. N Engl J Med 2021;384:2177-86. DOI: 10.1056/NEJMoa2030243
Efficacy of Wolbachia-infected mosquito deployments
for the control of dengue

Supplementary appendix

Contents

AWED Study committees                                                                             2
AWED Study Group                                                                                  2
Supplementary Methods                                                                             4
  Constrained randomisation procedure                                                             4
  wMel-infected Aedes aegypti mosquito production                                                 8
  Vector competence experiments using wMel-infected Ae. aegypti from Yogyakarta                   8
  wMel-infected Aedes aegypti deployments                                                         9
  Entomological monitoring                                                                        9
  Arbovirus diagnostic investigations                                                            10
  Sample size calculations                                                                       11
  Calculation of Wolbachia Exposure Index for per-protocol analysis                              14
  Per-protocol analysis statistical methods and results                                          15
Supplementary Tables                                                                             16
  Table S1: Baseline characteristics of clusters (sociodemographic, historical disease incidence,
  area and mosquito trapping)                                                                     16
  Table S2: Summary of Wolbachia deployments in 12 intervention clusters                         18
  Table S3: Baseline characteristics of trial participants                                       19
  Table S4: Hospitalisation outcome by treatment arm for all participants in the analysis dataset
                                                                                                 20
  Table S5: Hospitalisation outcome by treatment arm for VCD cases                               20
Supplementary Figures                                                                            21
  Figure S1: Map of study location with satellite overlay.                                       21
  Figure S2. Susceptibility of wild-type [WT] and wMel-infected Ae. aegypti to DENV infection. 22
  Figure S3: Viral load in mosquito abdomen tissue per mosquito by strain (wMel vs wild-type
  [WT]) and serotype.                                                                        23
  Figure S4: Diagnostic algorithm and classification of participants                             24
  Figure S5: Participant enrolment and hospitalisations by primary care clinic and treatment arm.
                                                                                                25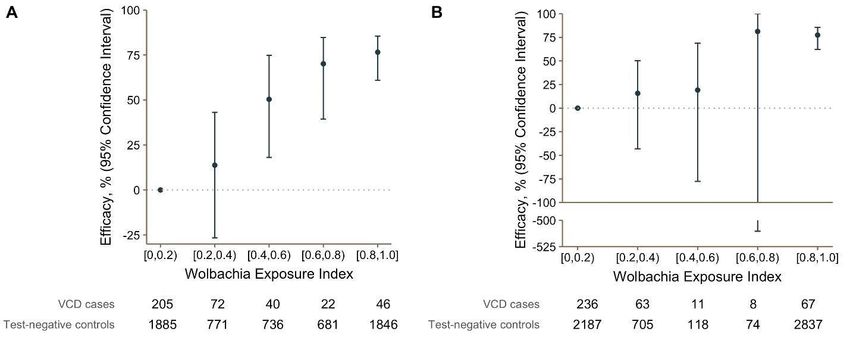
Figure S6: Intervention efficacy over time.                                                    26
  Figure S7: Cluster-level proportions of virologically-confirmed dengue cases and prevalence of
  wMel in local Aedes aegypti mosquito populations over time. Error! Bookmark not defined.
  Figure S8: Cluster-level proportions of serotype-specific virologically-confirmed dengue cases. 30
Figure S9: Efficacy of the Wolbachia intervention against virologically-confirmed dengue according
to Wolbachia exposure index (per-protocol analysis).                                            31

AWED Study committees

Trial Steering Committee members
Siswanto; National Institute of Health Research and Development, Ministry of Health,
Indonesia
Tedjo Sasmono; Eijkman Institute, Jakarta, Indonesia
Pembayun Setyaning Astuti, Yogyakarta Provincial Health Office, Indonesia

Independent Data Monitoring Committee members
Immo Kleinschmidt, London School of Hygiene and Tropical Medicine, UK
Sri Rezeki Syaraswati Hadinegoro, Universitas Indonesia, Indonesia
Ooi Eng Eong, Duke-NUS Medical School, Singapore
In Kyuu Yoon, Coalition for Epidemic Preparedness Innovations (CEPI), USA
Anna P Durbin, Johns Hopkins Bloomberg School of Public Health, USA.

Trial statisticians
Nicholas Jewell, University of California, Berkeley, USA & London School of Hygiene and
Tropical Medicine, UK
Suzanne Dufault, University of California, Berkeley, USA

AWED Study Group
Stakeholder and Community Engagement
Equatori Prabowo, Ranggoaini Jahja, Achmad A. Tamrin, Sylva Haryosaputro, Muhammad Ali
Mahrus, Dedik Helmy Yusdiana, Gito Haryanto, Susi Dewi Nova Riyanti, Didit S. Munandar,
Kiswi Radat, Maria Bernadette Rindiyastami, Uswatun Khasanah, Rini Kurniati, Ismail Hidayat,
Florentinus Dhanu Nugroho, Iyxda Dwi Hartanto, Nur Solikhah, Bekti Andari.

Entomology
Indah Nurhayati, Iva Fitriana,Budi Arianto,Nida Budiwati Pramuko, Sigit Setyawan, Anastasia
Maya Indah Lestari, Wasini, Bambang Hardiko Nugroho, Heru Sulistyo, Kiswanto, Murniwati
Handayani, Rizki Sholeh, Tri Mumpuni, Anis Ariestanto, Yusqi Taufiqur Rohman, Tilka
Hujjatuna, Merry Putri Wijayanti, Resita Octiani, Sri Yuliani Dewi, Desy Liana, Indira Diah
Utami, Anisa Parazulfa, Chandra Paditaningrum, Nur Fauziah, Zahtamal, Endang
Pramesthiningsih Nabhela Ayu Purwaningrum, Hery Agus Susilo, Ita Ayundasari, Puji Rahayu,
Sularto, Trismiyatun, Wahyu Pranoto, Noor Cholivah, Reza Yustian, Defriana Lutfi Chisnaifah,
Rifqi Zahro Janatunaim

Clinical research
Uswatun khasanah, Ragil Eva Agustin, Muhammad Tamaji, Nurina Jihan Yulianti, Nur
Khasanah,Munasdi Victorius, Ktut Rentyasti Palupi, Ardhina Ramania, Maryati, Sulis
Mukaryanah Widarti, Rini Dwi Utami, Siti Rochmatun, Oktalia Nurfita Sari, Mugiyanti Ikawati,
Shofia Eva Sagita, Imam Fungani, Pramidya Ujiana, Siti Nuryanti, Laila Latifah, Eka
Rahayuningsih, Roseta Irawati, Fatika Ikhtariyani, Arief Rachman Hakim, Wahyuningsih, Tri
Kunarsih, Anggun Hatto Hanti, Dwy Desy Rahmawati, Fitri Ramadhan, Fradina Kiki Meilina,
Inayati, Jatu Kartika Akmala, Nunung Hidayati, Yusni Khafiyanti, Rahhmawati Ning Rum, Rudy
Sigit Kurniawan, Ayu Dita Larasati, Indriana Nurhakimah, Diajeng Kenanga Putri Ma’rifat, Eka
Nurul Azizah, Novi Faturohmah, Embun Majiid, Novi Rustiana, Nimas Suri Martiana, Yulita
Endah Mayaningrum, Putri Hardiyanti, Noravita.

Diagnostics
Endah Supriyati, Utari Saraswati, Ayu Rahayu, Anwar Rovik, Dian Aruni Kumalawati, Kunta Adi
Tetuko, Edwin Widyanto Daniwijaya

Data Management
Yeti Meitika, Dwi Satria Wardhana, Ramdhan Hartanto, Sekar Langit Adesya Paramita, Inggrid
Ernesia, Adi Artanto.

Yogyakarta City and Provincial Health Office
Yudiria Amelia, Endang Sri Rahayu, Rubangi, Berti Murtiningsih, Veronika Nur Hardiyati

Trial investigators
Adi Utarini, Citra Indriani, Riris Andono Ahmad, Warsito Tantowijoyo, Eggi Arguni, M.
Ridwan Ansari, Benjamin Green, Lauren Hodgson, Zoe Cutcher, Edwige Rancès, Peter A.
Ryan, Scott L. O'Neill, Suzanne M. Dufault, Stephanie K. Tanamas, Nicholas P. Jewell,
Katherine L. Anders, Cameron P. Simmons
Supplementary Methods

Constrained randomisation procedure
Background

Randomisation is a key step in the design of the AWED cluster randomised trial. Importantly,
it will provide a sense of “fairness” and transparency in allocation of the intervention. It is
also an opportunity to ensure “balance” between intervention and non-intervention arms.
Balance means that, overall, the intervention and non-intervention arms have similar
dengue risk apart from the presence of Wolbachia. Balance aims to minimise the effect of
confounding variables, so that any systematic difference in dengue incidence that occurs
between Wolbachia intervention areas and untreated areas during the trial can clearly be
attributed to the effects of Wolbachia. Ensuring a well-balanced trial will reduce the need
for statistical adjustment during the analysis phase, increasing the “face validity” of the trial.
Balance also improves statistical power and efficiency, reducing the risk of Type II error (i.e.
failure to detect an effect when the effect is, in fact, present).1

Simple randomisation can be relied upon to produce an overall balance between
intervention and non-intervention arms when there is a large number of clusters available
for randomisation. However simple randomisation can’t be relied on to produce balanced
allocations where the sample size is small. For example, in our field efficacy trial involving
just 24 clusters, it is possible simple random allocation may allocate most clusters with a
high dengue risk to the same treatment arm through chance alone.

Covariate constrained (also referred to as “restricted”) randomisation is the best way to
achieve balance when the number of clusters is small.1-3 It ensures balance and minimises
loss of statistical power without the need for large numbers of strata. After deciding on
appropriate balancing criteria, the approach identifies all potential allocations that will
satisfy these criteria, and then randomly selects an allocation pattern from within this
restricted list of possibilities. Covariate-constrained randomisation can be used because in
general, when assessing the comparability of treatment and control arms, balance is
assessed in terms of overall balance between treatment and control arms, rather than
within each matched pair or within each stratum.2 This approach to randomisation does not
generally affect the approach to analysis.2

Constrained randomisation for the AWED trial follows guidelines outlined by Hayes and
Moulton, 2009.2 Balancing variables include those that may be potentially confounding
covariates; may impact sample size; or may be useful for logistical considerations. Note that
balance is necessary at both the cluster and individual levels.1 Sample size is an important
balancing covariate as precision and power is maximised when sample sizes in treatment
arms are similar. This includes both the number of clusters and the total number of sampled
individuals within each treatment arm.1

In Yogyakarta, randomisation was conducted after community-level consent to participate
in the RCT was obtained from local leaders (heads of urban villages). This minimises the
likelihood that a cluster or part of a cluster declines to allow Wolbachia releases after
randomisation has occurred and the intervention clusters are known, which would
introduce a risk of the study arms becoming unbalanced not only in size but also in other
important covariates. Wolbachia releases were successfully conducted in all clusters
randomised to receive the intervention.

Constraining variables

 Category            Constraining variable        Data source       Balancing criteria

 Potential           Incidence of notified DHF,   Yogyakarta        Incidence in each arm deviates
 confounding         per 1000 population          District Health   from overall incidence by +/-
Population at risk    Population (2015)          Yogyakarta          Population in each study arm is
                                                  Statistics Office   within 45-55% of the study area
                                                  (BPS)               total

                       Number of clusters per     N/A                 Fixed at 12 clusters per arm
                       treatment arm

 Logistical            Cluster area (km2)         WMP                 Total area in each study arm is
 considerations                                   Yogyakarta          within 45-55% of the study area
                                                                      total

                       Cluster non-release area   WMP                 Non-release area in each study
                       (km2)*                     Yogyakarta          arm is within 45-55% of the study
                                                                      area total

                       Spatial strata             N/A                 Each of 4 quadrants of the city
                                                                      will include 6 clusters, 3
                                                                      intervention and 3 untreated

* to ensure the intervention arm cannot end up with an excess of “non-release” areas

Constrained randomisation method:

   1.    Calculated values for each balancing covariate for each of the 24 clusters and
   across the study area as a whole. Cluster values are summarised in Table S1.

   2.    Generated a large number of potential random allocations (n=100,000)

   3.    For each allocation, calculated the value of each balancing criterion in each study
   arm

   4.    Rejected any random allocations where any one or more of the balancing criteria
   described in Table 1 were not met.

   5.    Note that for the potential confounding covariates the comparisons between study
   arm values and overall values were calculated in two ways, and both were applied as
   constraints as described above in 4:

            a.     Individual-level: the aggregate rate or proportion calculated across the
                  study arm was compared with the aggregate rate or proportion calculated
                  across the whole population
b. Group-level: the mean of 12 cluster-level rates or proportions in the study
arm was compared with the mean of all 24 cluster-level rates or proportions.
6. Assessed validity of the scheme:
a. Reviewed restricted number of potential allocations, ensuring the number
was not too small relative to the overall number of possible allocations (as
above). A minimum threshold of least 100 potential allocations was required.
b. Ensured that, within each stratum, no clusters are NEVER or ALWAYS
allocated together, as this would result in an invalid randomisation scheme.
c. Examined dengue incidence correlation over time within clusters frequently
randomised together, and compared against correlation within all pairwise
combinations. Verified that dengue incidence in clusters frequently
randomised together was not highly correlated
7. A total of 244 allocations met the balancing criteria (thus 488 possible distinct
randomisations of intervention allocation). A random subset of 100 balanced allocations
was selected, as the sampling frame for the final public randomisation event.
8. From this list a single allocation pattern was randomly selected, using numbered
balls, at a public participatory event of community and government leaders in
Yogyakarta in January 2017.wMel-infected Aedes aegypti mosquito production An existing colony of local Ae. aegypti containing the wMel Wolbachia strain, created for the 2016-2017 quasi-experimental study releases in Yogyakarta City,5 was used as the founder colony for the releases described here. It was backcrossed for three generations with wild- type males collected from the study intervention area to generate the release colony, which was then maintained as described previously.5 The insecticide resistance profile of the wMel-infected Ae. aegypti release material was matched to the local wild-type population as described previously.5 Vector competence experiments using wMel-infected Ae. aegypti from Yogyakarta We membrane blood-fed Yogyakarta wild-type (WT) and wMel-infected Ae. aegypti at the Oxford University Clinical Research Unit (Vietnam) using viremic blood collected from nine acute dengue inpatients at the Hospital for Tropical Diseases, Ho Chi Minh City, Vietnam using previously published protocols. 6 We measured virological differences between each mosquito line, in abdomen and saliva, at predefined times (10-21 days) after blood feeding. The work was performed under human research ethics approvals from the Hospital for Tropical Diseases, H (HTD CS/ND/12/09 and HTD CS/ND/12/16) and University of Oxford (26DX: OxTREC 68-11 and 30DX: OxTREC 30-12). The virological outcomes (infected/uninfected) are shown in Figure S1. Logistic regression was used to model the probability of successful human-mosquito transmission of DENV in the abdomen and saliva, with mosquito strain (wMel vs wild-type) as the main covariate. Additional analysis adjusted for serotype, donor log viremia, and day of mosquito harvesting. Robust standard errors were used to account for simultaneous exposure of donors to multiple wMel and wild-type Ae. aegypti. The difference in DENV copy number between the abdomens of wMel-infected and wild-type Ae. aegypti was determined using the Kruskal-Wallis test with Dunn’s multiple comparison correction. After viremic blood-feeding, wMel-infected mosquitoes with this Indonesian genetic background had a slightly reduced probability of having infected abdomens’ compared to wild-type Ae. aegypti: 57% wMel-infected mosquitoes with abdominal infection vs 70% wild-
type [crude OR=0.57, 95% CI 0.26, 1.26; adjusted for serotype, viremia and day mosquitoes
were harvested: OR = 0.27, 95% CI 0.08, 0.92]. Among those mosquitoes with abdomen
infections, the DENV viral load in wMel-infected mosquitoes was significantly lower than in
wild-type Ae. aegypti for each of the three serotypes tested (Figure S2).

As expected, wMel-infected mosquitoes were significantly less likely to have saliva
containing infectious virus than their wild-type counterparts: 8% wMel-infected mosquitoes
with saliva infection vs 38% wild-type [crude OR=0.14, 95% CI 0.06, 0.34; adjusted for
serotype, viremia and day mosquitoes were harvested: OR = 0.07, 95% CI 0.02, 0.33] (Figure
S1).

These results are consistent with a large body of work, on a variety of different genetic
backgrounds, demonstrating that wMel-infected Ae. aegypti have reduced transmission
potential for DENV.

wMel-infected Aedes aegypti deployments
Wolbachia-carrying mosquitoes were released as eggs using mosquito release containers
(MRCs). These were 2-litre plastic buckets each containing one oviposition strip with 100–
150 eggs, Tetra Pleco Wafers fish food (Tetra GmbH, Germany), and 1 litre of water. MRCs
were covered and placed outside houses, protected from direct sun and rain. Holes drilled
near the top of the bucket walls allowed adult mosquitoes to escape. Releases occurred
between March and December 2017, with 9–14 rounds of releases in each intervention
cluster. Releases stopped in each cluster when the prevalence of Wolbachia in field-caught
mosquitoes was >60% for three consecutive weeks releases. MRCs were reset every two
weeks. An MRC was placed in 1–2 randomly selected locations within each 50x50 m grid
square across the intervention area. Permission was obtained from property owners to
place MRCs on private property.

Entomological monitoring
Prevalence of Wolbachia in the local Ae. aegypti population was monitored by weekly
collection of adult mosquitoes via a network of 348 BG Sentinel traps (Biogents, Germany).
Written consent was obtained from heads of households hosting BG traps. The median
(range) trap density was 16.0 (13.2–18.1) BG/km2 in the intervention clusters and 14.9
(10.3–16.8) BG/km2 in the untreated clusters (Table S1). Mosquitoes were demobilised at -
20°C for ≥1 hour, then identified by morphological features. The number of mosquitoes
caught in each BG trap was recorded by species, sex, and in total. Ae. aegypti were stored at
-20°C in 80% ethanol until testing for wMel infection.

Field-caught Ae. aegypti were screened for wMel Wolbachia by qualitative PCR Taqman
assay on a Roche LightCycler 480. The qPCR conditions consisted of a denaturation step at
95°C for 5 minutes followed by 45 cycles of PCR (denaturation at 95 °C for 10 seconds,
annealing at 60 °C for 15 seconds, and extension at 72 °C for 1 second with the single
acquisition) followed by a cooling down step at 40°C for 10 seconds. Specific primers
targeting the gene encoding Ae aegypti Rps17 and wMel WD0513 were used as previously
described,7 but with replacement of the Cy5-BHQ3 fluorophore-quencher pair in the wMel
probe with the fluorophore-quencher LC640-IowaBlack (Integrated DNA technologies).8
Testing was at weekly intervals when Wolbachia prevalence was
CHIK and ZIKV) and negative controls. The DENV serotype specific PCR was performed using
a commercial assay (Dengue Simplexa kit (DiaSorin Molecular) on the Liaison MDX
thermocycler according to the manufacturer’s instructions. The Bio-rad Platelia Dengue NS1
Ag test (BioRad Cat. No. 72830), a one step sandwich format microplate enzyme
immunoassay for the detection of DENV NS1 antigen, was performed according to the
manufacturer’s instructions. The Panbio Dengue IgM Capture Elisa (Abbot Cat. No. 01PE20)
and the Panbio Dengue IgG Capture Elisa (Abbot Cat. No. 01PE10) were used to detect IgM
and IgG antibodies to dengue antigen in plasma and were used according to the
manufacturer’s instructions.

Sample size calculations
There are no published formulae to estimate sample size for the proposed study design, ie.
a cluster randomised trial with a test-negative design (TND), where the intervention effect is
estimated from outcome-based sampling of test-positive and test-negative patients and
ascertainment of their exposure status. Randomisation provides a basis of inference in
comparing intervention clusters with control clusters as, under the null hypothesis, there
should be no difference with regard to the relative appearance of test-positives and
negatives in clusters, on average, across the two arms. Thus we proposed as the primary
analytical approach a comparison of the exposure odds among test-positive cases versus
test-negative controls (for data aggregated across all clusters), with the null hypothesis that
the odds of residence in a Wolbachia-treated cluster is the same among test-positive cases
as test-negative controls. The resulting odds ratio thus provides an estimation of the
intervention effect and, as demonstrated previously, provides an unbiased estimate of the
relative risk providing that the key assumptions underlying the TND are upheld.

A secondary approach employs as a summary measure for a group-level analysis the
proportion of test-positive cases amongst all tested participants in each cluster, with a
comparison of the average of these proportions in the intervention arm versus the
untreated arm forming the basis of hypothesis testing for intervention effect. The null
hypothesis is that the average proportion of total enrolled participants that are cases is the
same in treated and untreated study arms. The alternative hypothesis is that the proportion
of enrolled participants that are cases is lower in the Wolbachia treated arm than the
untreated arm.

Sample size estimations prior to trial commencement

Simulations were used to estimate the power to detect a range of intervention effect sizes
using the two methods above, assuming 12 clusters per arm, a fixed total of 1000 true
dengue cases enrolled and 4000 non-dengue controls. Empirical data on population,
historical dengue incidence and incidence of other febrile illness in the 24 study clusters
were used to define the baseline characteristics for the simulated scenarios. Nine
overlapping two-year windows of dengue data (2003-2014) were sourced from the
Yogyakarta surveillance system. Data for other febrile illness during 2014-2015 were
sourced from individual Puskesmas using ICD10 codes for non-localising fever (fever of
unknown origin R50; Typhus A75.9; and acute infection due to bacteria at an unspecified
site A49). We randomly allocated half the clusters to receive the intervention; this random
allocation was repeated one million times, and only those allocations were kept in which the
balancing criteria specified in the constrained randomization methods were met (n=244
balanced allocations, and thus 488 possible distinct randomizations of intervention
allocation). Dengue case numbers per cluster were either kept at baseline values (for the
simulation at the null; ie RR=1) or reduced proportionately (for simulations of intervention
effects of RR=0.6, 0.5, 0.4, 0.3). For each of these five ‘true’ effect sizes, applied to each of
the 244 balanced allocations, the ‘observed’ effect size was calculated from the simulated
data by the two methods outlined above; i) aggregated odds ratio for residence in a treated
cluster among cases versus controls, and ii) t-test for comparison of the average cluster
summary proportions (cases/cases+controls) between study arms. Statistical inference,
from the t-test directly, or, for the odds ratios using permutation distribution
approximations with standard errors adjusted to account appropriately for the clustered
nature of the data, respectively, was used to calculate the proportion of constrained
random allocations that yielded a significant result. This provided an estimate of Type I error
at the null, and power away from the null (Table). Both of these approaches thus are using
approximations to the exact permutation distribution.4 In practice, the appropriate
reference distribution for inference will be based on the set of 244 potential balanced
allocations.
These simulations estimated that approximately 1000 cases plus four times as many
controls will be sufficient to detect a 50% reduction in dengue incidence with 80% power.

Percent of random allocations that yield significant results on simulated data

    Risk Ratio                     T-test                            Odds Ratio test

                     Constrained            Random         Constrained            Random

        1                0.13                 5                 1                      7

       0.6               48                   49               61                      57

       0.5               81                   75               89                      82

       0.4               97                   93               99                      96

       0.3               100                  95               100                     100

The results show that constrained randomization is somewhat conservative at the null but
generally increases power moderately. The odds ratio test is more powerful than the t-test
approach, and will thus be used as the primary analysis with the additional attraction of
being standard for the traditional test-negative design.

Sample size re-estimation after one year of participant recruitment

A re-estimation of sample size requirements was conducted in January 2019 after one year
of recruitment. The initial power calculation used 1000 dengue cases and 4000 non-dengue
controls allocated to each cluster based on historical proportions of dengue cases and other
febrile illnesses, assuming no variation in the proportion of cases by cluster. This method
was found to overestimate power for small samples by not taking into account randomness
in the sampling. The sample size re-estimation included power estimates for 200, 400, 600,
800 and 1000 dengue cases with 4 times as many controls. Cases and controls were
allocated among clusters by sampling from multinomial distributions, which incorporated
added randomness by allowing the proportion allocated to each cluster to vary across simulations. The re-estimation found that 400 dengue cases plus four times as many controls would be sufficient to detect a 50% reduction in dengue incidence with 80% power. Power re-estimation for Wolbachia contamination scenarios. Additional simulations were conducted in September 2019 to assess the potential impact on power if a number of untreated clusters were ‘lost’ to Wolbachia contamination. For the target minimum observed effect size of 50% (RR=0.5) and 400 enrolled dengue cases, contamination of 3 untreated clusters (assuming that contaminated clusters experience the full intervention effect for 1 out of the 3 years of trial recruitment) is expected to result in a ~7% loss of power, and contamination of 6 clusters to result in a ~14% loss of power. Calculation of Wolbachia Exposure Index for per-protocol analysis Participants were asked about their mobility during the period 3 – 10 days prior to illness onset using a structured interview administered at enrolment. This records the duration of time spent at home, work or school, and other locations visited during daylight hours (5am – 9pm) in the 8-day period. The geographic coordinates of those locations were derived by geo-locating them on a digital map, with the assistance of the respondent. A weighted ‘Wolbachia exposure index’ (WEI) was defined for each participant as WEI = ∑(tj*wj), where tj is the participant’s time spent at location j as a proportion of their total observed time, and wj is the measured cluster-level Wolbachia frequency at location j in the calendar month of participant enrolment, resulting in a WEI value on a continuous scale from 0 to 1. Aggregate Wolbachia prevalence for each cluster was calculated each month from all Ae. aegypti trapped in that cluster. For any calendar month where mosquito collection was not done, the average of the cluster-level Wolbachia prevalence in the one previous and one subsequent month was used. For visited locations within the quasi-experimental study area, which comprises seven urban villages located adjacent to the northwestern border of the trial study site,5 the measured village-level Wolbachia prevalence from the screening event closest in time to the participant’s enrolment was used. Visited locations outside of both the AWED study area and the quasi-experimental study area were assumed to have a
Wolbachia prevalence of zero. The process of calculating WEI was conducted blinded to
participants’ case/control status, by partitioning the travel history data from the laboratory
diagnostic data, to remove any possibility of observer bias.

An additional per-protocol analysis calculated WEI using only the cluster-level Wolbachia
prevalence in the participant’s cluster of residence (in the calendar month of participant
enrolment), ignoring the participant’s recent travel history. This recognises that dengue
exposure risk may be higher at home versus other locations, rather than assuming an even
distribution of exposure risk across daytime hours and locations visited.

Per-protocol analysis statistical methods and results
Cases and controls were classified by strata of their WEI: 0-
Supplementary Tables
Table S1: Baseline characteristics of clusters (sociodemographic, historical disease incidence, area and mosquito trapping)
                                Population                                              Other febrile illness                                           BG trap density per km2
                   Population                  Completed      Notified DHF incidence                            Total cluster   Residential (release)
                                aged
Cluster 8 16,026 21 76 16.9 241.7 1.12 1.08 14.8 Cluster 11 14,983 21 79 19.6 120.9 0.86 0.8 12.5 Cluster 13 28,541 21 80 13.5 158.0 1.64 1.54 15.6 Cluster 15 8,976 22 82 17.9 182.9 0.95 0.87 10.3 Cluster 17 4,031 23 90 19.5 390.9 0.73 0.63 15.9 Cluster 18 21,185 21 76 17.3 113.3 1.6 1.43 16.8 Cluster 20 10,780 22 91 28.0 100.7 1.03 1.01 15.8 Cluster 22 9,971 23 69 23.9 416.3 1.33 1.16 12.9 Cluster 23 6,677 24 63 19.0 148.5 1.07 0.9 13.3
Table S2: Summary of Wolbachia deployments in 12 intervention clusters

Cluster   Total area   Release start and end   # release   Mean release       Mean estimated
          (km2)        date                     rounds     points per round   mosquitoes released
                                                           (min, max)         per round (st dev)

1         0.94         6 Mar – 18 Sept 2017       12       342 (267, 382)     22,180 (2959)

2         0.69         13 Mar – 10 Oct 2017       13       280 (268, 313)     18,192 (3512)

6         0.94         17 Apr – 16 Nov 2017       13       426 (382, 518)     28,192 (3996)

7         1.11         17 May – 14 Nov 2017       11       509 (456, 653)     31,319 (4595)

9         1.14         1 May – 13 Nov 2017        12       453 (414, 542)     30,217 (4311)

10        1.17         15 Apr – 26 Sep 2017       9        408 (390, 449)     27,825 (3953)

12        1.13         11 May – 6 Dec 2017        13       484 (441, 586)     33,966 (4557)

14        1.27         10 Apr – 21 Nov 2017       14       515 (478, 616)     34,055 (2519)

16        0.89         29 Mar – 7 Nov 2017        14       408 (374, 505)     26,004 (3751)

19        0.83         20 Mar – 17 Oct 2017       13       349 (326, 393)     22,971 (2968)

21        1.04         6 Apr – 3 Oct 2017         11       409 (400, 425)     26,705 (2577)

24        1.09         25 May – 5 Dec 2017        12       365 (323, 447)     23,328 (3066)

                                                                                        18
Table S3: Baseline characteristics of trial participants
N Age, median (IQR) Female sex, n (%)
Total enrolled participants 8144 11.6 (6.7, 20.9) 3973 (48.8)
By inclusion in analysis dataset
Included in analysis 6306 12.0 (7.0, 21.1) 3073 (48.7)
Excluded from analysis 1838 10.5 (6.1, 19.4) 900 (49.0)
By treatment allocation*
Intervention arm 2905 12.0 (6.9, 21.1) 1430 (49.2)
Untreated arm 3401 12.0 (7.0, 21.2) 1643 (48.3)
By diagnostic outcome**
VCD cases 385 11.0 (7.2, 18.1) 189 (49.1)
VCC cases 4 28.5 (16.0, 42.3) 1 (25.0)
Test-negative controls 5921 12.1 (7.0, 21.4) 2884 (48.7)
By follow-up status*
Not hospitalized 5567 12.1 (7.1, 21.2) 2707 (48.6)
Hospitalised 295 11.9 (6.9, 20.5) 138 (46.8)
Died - -
Lost to follow-up 444 10.8 (6.4, 20.8) 22 (51.4)
Age is in years. IQR: interquartile range, VCD: virologically-confirmed dengue, VCC: virologically-confirmed
chikungunya. *Participants in analysis dataset only. **Participants in analysis dataset plus 4 chikungunya
cases.Table S4: Hospitalisation outcome by treatment arm for all participants in the analysis
dataset
Intervention arm Untreated arm OR (95% CI)
N % N %
All participants
Not hospitalized 2602 89.6 2965 87.2 Ref
Hospitalised 81 2.8 214 6.3 0.43 (0.32, 0.58)
Lost to follow-up 222 7.6 222 6.5 -
Table S5: Hospitalisation outcome by treatment arm for VCD cases
Intervention arm Untreated arm
N % N %
VCD
Not hospitalised 52 77.6 197 61.9
Hospitalised 13 19.4 102 32.1
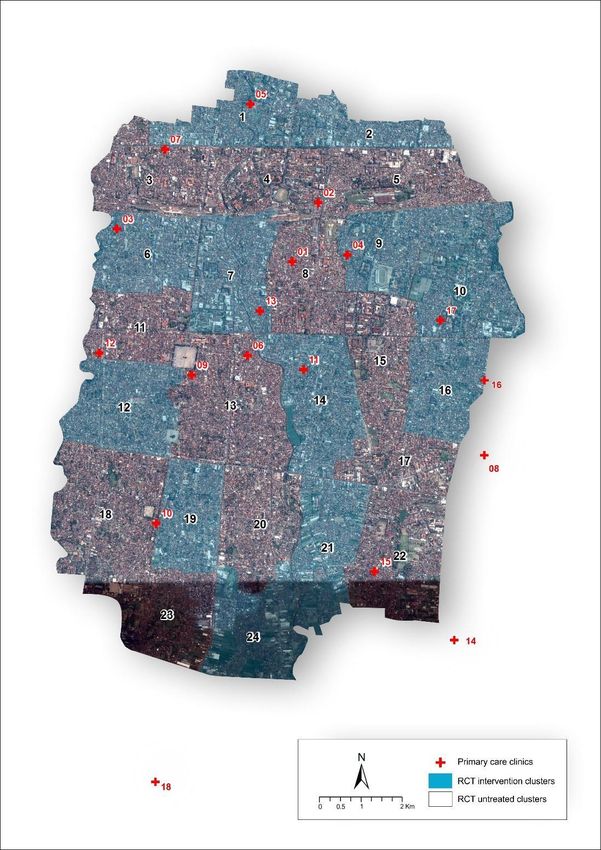
Lost to follow-up 2 3.0 19 6.0Supplementary Figures Figure S1: Map of study location with satellite overlay. The map of Yogyakarta City (plus a small region of neighbouring Bantul District) is shown with wMel intervention clusters (shaded blue) and untreated clusters (no shading) indicated. The locations of primary care clinics (red crosses) where enrolment occurred are also shown, and are numbered to correspond with the clinical-level data in Figure S5.
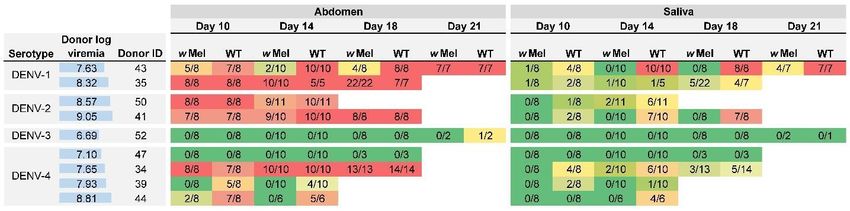
Figure S2. Susceptibility of wild-type [WT] and wMel-infected Ae. aegypti to DENV infection. Each row represents the results of feeding
cohorts of WT and wMel-infected mosquitoes on viremic blood collected from human dengue cases. The infecting DENV serotype and log10
viral titre (RNA copies/ml) of the donor blood is shown (also indicated by the horizontal blue bars). Results indicate the numbers of mosquitoes
with detectable DENV infection in the abdomen and saliva over the total number of mosquitoes fed on blood from that donor and harvested at
four time points after feeding (days 10, 14, 18 and 21). Background colour of table cells indicates the proportion of mosquitoes with detectable
infection (0%: dark green to 100%: dark red).

                                                                                                                                             22
Figure S3: Viral load in mosquito abdomen tissue per mosquito by strain (wMel vs wild- type [WT]) and serotype. DENV-3 was excluded as only one mosquito tested positive for DENV in the abdomen. Boxes are median and interquartile range for DENV copies per mosquito. Whiskers indicate the range, and circles indicate outliers. *p
Figure S4: Diagnostic algorithm and classification of participants
Among 8,144 total participants enrolled, 7,539 were enrolled after Wolbachia establishment
(8 Jan 2018) and with a blood sample successfully collected, excluding 186 test-negative
controls (95 in the intervention arm and 91 in the untreated arm) who were enrolled in a
month with no test-positive dengue cases (September 2018). Four virologically-confirmed
chikungunya (VCC) and 318 virologically-confirmed dengue (VCD) cases were identified by
multiplex RT-PCR. Another 67 VCD cases were negative in RT-PCR but positive in dengue
NS1 antigen enzyme-linked ELISA. 1,229 participants were classified as neither test-positive
cases nor test-negative controls due to a positive or equivocal result for dengue IgM and/or
IgG antibody, or due to insufficient sample volume for complete diagnostics or an
inconclusive diagnostic result. 5921 participants with negative results in all diagnostic tests
were classified as test-negative controls.
DENV: dengue virus; CHIK: chikungunya virus; Zika: Zika virus; PCR: polymerase chain
reaction; VCC: virologically-confirmed chikungunya; VCD: virologically-confirmed dengue;
NS1: dengue non-structural protein 1; ELISA: enzyme-linked immunosorbent assay; IgM:
immunoglobulin M; IgG: immunoglobulin G.
Figure S5: Participant enrolment and hospitalisations by primary care clinic and treatment
arm.

Bars show the number of participants in the analysis dataset by clinic of enrolment (clinics
numbered 1 - 18). Each clinic enrolled participants from both untreated (dark blue; yellow)
and Wolbachia-treated (light blue; orange) clusters. The proportion of participants who
were hospitalised varied between clinics, and was higher among participants from
untreated (yellow) than Wolbachia-treated (orange) clusters.
Figure S6: Intervention efficacy over time.
Efficacy is calculated as 100*(1-aggregate odds ratio) among participants enrolled within the
first 12 months after wMel establishment, within the first 24 months, and within the full 27
month trial period.
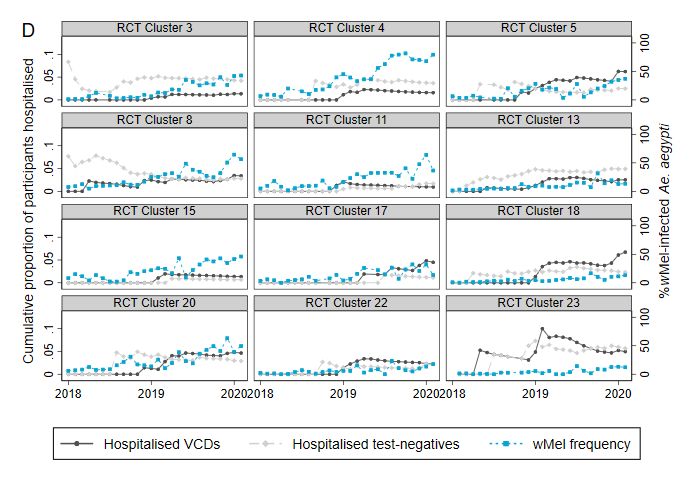
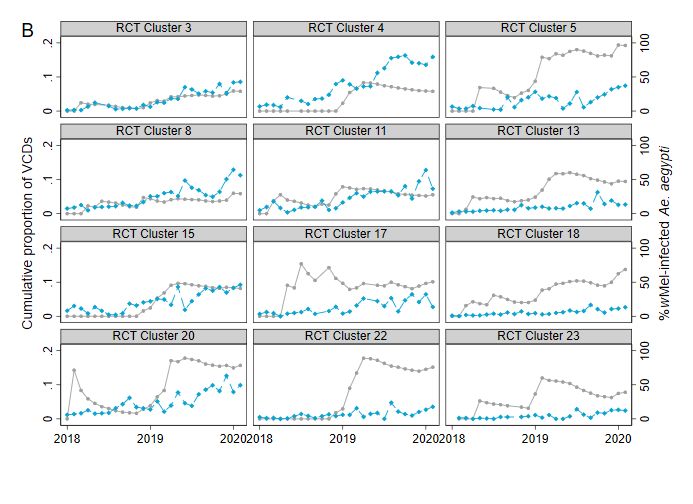
Figure S7: Cluster-level proportions of virologically-confirmed dengue cases (A and B),
proportions of participants hospitalised (C and D), and prevalence of wMel in local Aedes
aegypti mosquito populations over time. For each of 12 intervention clusters (A and C) and
12 untreated clusters (B and D), the grey markers show VCD cases as a proportion of all
participants or participants hospitalised as a proportion of all participants (cumulative to
each month January 2018 - March 2020). Panel C excludes one observation from cluster 21
(February 2018) where the proportion of hospitalised test-negative participants was 0.2.
The blue markers show the percentage of Ae. aegypti collected in each cluster in each
month that were wMel infected.
Figure S8: Cluster-level proportions of serotype-specific virologically-confirmed dengue
cases.
Serotype-specific VCD cases as a proportion of all participants in Wolbachia-treated (closed
circles) and untreated (open circles) clusters. Horizontal bars show the mean serotype-
specific VCD proportion in intervention and untreated clusters; the relative risk and
confidence intervals are derived from a comparison of these mean proportions (see
Methods). Confidence intervals have not been adjusted for multiple comparisons. *When
the number of serotype-specific VCD cases is small while the number of test-negative
controls remains large, the test-positive fraction method is not sufficiently precise to
distinguish between very low values of the relative risk that are close to zero; in this case
the method yields a lower confidence interval of 0 as reported here.
Figure S9: Efficacy of the Wolbachia intervention against virologically-confirmed dengue according to Wolbachia exposure index (per-
protocol analysis).
Markers show stratum-specific efficacy (and 95% confidence intervals) against VCD by quintile of Wolbachia exposure index, with WEI based
on A) duration-weighted wMel frequencies in the cluster of residence and other visited locations, or B) wMel frequency in cluster of residence
only. The number of VCD cases and test-negative controls with WEI values in each quintile is shown beneath the plots.

                                                                                                                                            31
References
1. Ivers NM, Halperin IJ, Barnsley J, et al. Allocation techniques for balance at baseline in
cluster randomized trials: a methodological review. Trials 2012;13:120.
2. Hayes RJ, Moulton LH. Cluster randomized trials. London: Chapman & Hall/CRC Press;
2009.
3. Smith PG, Morrow RH, Ross DA, eds. Field trials of health interventions: a toolbox (3rd
ed.): Oxford University Press; 2015.
4. Jewell NP, Dufault S, Cutcher Z, Simmons CP, Anders KL. Analysis of cluster-
randomized test-negative designs: cluster-level methods. Biostatistics 2019;20:332-46.
5. Indriani C, Tantowijoyo W, Rances E, et al. Reduced dengue incidence following
deployments of Wolbachia-infected Aedes aegypti in Yogyakarta, Indonesia: a quasi-
experimental trial using controlled interrupted time series analysis. Gates Open Res
2020;4:50.
6. Carrington LB, Tran BCN, Le NTH, et al. Field- and clinically derived estimates of
Wolbachia-mediated blocking of dengue virus transmission potential in Aedes aegypti
mosquitoes. Proc Natl Acad Sci U S A 2018;115:361-6.
7. Yeap HL, Axford JK, Popovici J, et al. Assessing quality of life-shortening Wolbachia-
infected Aedes aegypti mosquitoes in the field based on capture rates and
morphometric assessments. Parasit Vectors 2014;7:58.
8. Dar M, Giesler T, Richardson R, et al. Development of a novel ozone- and photo-stable
HyPer5 red fluorescent dye for array CGH and microarray gene expression analysis
with consistent performance irrespective of environmental conditions. BMC Biotechnol
2008;8:86.
9. Faye O, Faye O, Diallo D, Diallo M, Weidmann M, Sall AA. Quantitative real-time PCR
detection of Zika virus and evaluation with field-caught mosquitoes. Virol J 2013;10:311.
10. Pastorino B, Bessaud M, Grandadam M, Murri S, Tolou HJ, Peyrefitte CN. Development
of a TaqMan RT-PCR assay without RNA extraction step for the detection and
quantification of African Chikungunya viruses. J Virol Methods 2005;124:65-71.
3211. Rances E, Ye YH, Woolfit M, McGraw EA, O'Neill SL. The relative importance of innate
immune priming in Wolbachia-mediated dengue interference. PLoS Pathog
2012;8:e1002548.
12. Hue KD, Tuan TV, Thi HT, et al. Validation of an internally controlled one-step real-time
multiplex RT-PCR assay for the detection and quantitation of dengue virus RNA in
plasma. J Virol Methods 2011;177:168-73.
13. Deen M, de Rooij M. ClusterBootstrap: An R package for the analysis of hierarchical
data using generalized linear models with the cluster bootstrap. Behav Res Methods
2020;52:572-90You can also read