The HERMES GALAH survey: overview
←
→
Page content transcription
If your browser does not render page correctly, please read the page content below
The HERMES GALAH survey: overview

                                KCF, JBH, SMG, GALAH team

                                                Abstract
          The goal of Galactic archaeology is to unravel the history of assembly of the Milky Way, us-
      ing fossil remnants of ancient star formation events which have disrupted and are now dispersed
      around the Galaxy. Recent studies of chemical abundances of stars in individual (undispersed)
      open clusters show that their abundance distributions are homogeneous to the level at which
      they can be measured, and their abundances are di↵erent from cluster to cluster. This enables
      the technique of chemical tagging to identify the fossil remnants of old dispersed clusters from
      their element abundance patterns over many chemical elements. With this goal, we plan to use
      the new HERMES multi-object high-resolution spectrometer on the Anglo Australian Telescope
      to measure abundances for up to 30 elements in about a million stars. This program is called
      GALAH (Galactic archaeology with HERMES) and we hope to begin the pilot study in late
      2013. This paper provides an overview of the proposed GALAH survey and discusses its goals,
      opportunities, execution and potential problem issues. The selection criteria for the survey
      stars are outlined. Chemical tagging of disrupted clusters provides a key science opportunity,
      to evaluate observationally the significance of radial mixing for the evolution of the Galactic
      disk.

1    Introduction

About half of the stars in the Milky Way formed before a redshift z ⇠ 1. We see ancient stars
around us in the old thin disk, the thick disk, the stellar halo, the inner bulge, and in satellite dwarf
galaxies. We are coming into a new era of Galactic investigation, in which one can study the fossil
remnants of the early days of the Galaxy, not only in the halo but throughout the major luminous
components of the Galaxy. The goal of these studies in Galactic archaeology is to reconstruct as
much as possible of the early Galactic history by using the stellar relics of ancient star formation
events and accretion events. After their birth-clusters or birth-galaxies disperse, these relic stars
may lose much of their dynamical information, such as the integrals of motion, because of heating
and radial migration. We know however that almost all surviving open star clusters are chemically
homogeneous for heavier elements above Al and often also for the lighter elements. The detailed
chemical composition over many elements of the dispersed stars of such star forming events is likely
to be conserved, and the relic stars from a particular star forming event are likely to have the same
detailed distribution of element abundances. Using the abundance distribution of stars to recognise
relic stars from old long-dispersed star formation sites is called chemical tagging. The numbers, ages
and chemical properties of these fossil relics contain much of the information needed to understand
the build-up and chemical evolution of the Milky Way since galaxy formation began.
Our focus here is mainly on the build-up of the disk and bulge, which contain almost all of the
stellar mass of the Milky Way. The metal-poor stellar halo is a minor component, but most studies
of the early Galaxy have used stars of the metal-poor stellar halo because they are known to be very
old. The halo is dynamically very di↵erent from the rest of the (stellar) Galaxy. It is spatially very
extended and slowly rotating. The dynamical timescales are long and dynamical interactions less
severe than in the disk. Halo stars can therefore preserve their integrals of the motion more readily
and their dynamics are more likely to contain useful information about the assembly of the halo.
We believe now that a fraction of the halo stars and globular clusters are remnants of early satellite
galaxies which experienced independent chemical evolution before being accreted by the Galaxy.

                                                     1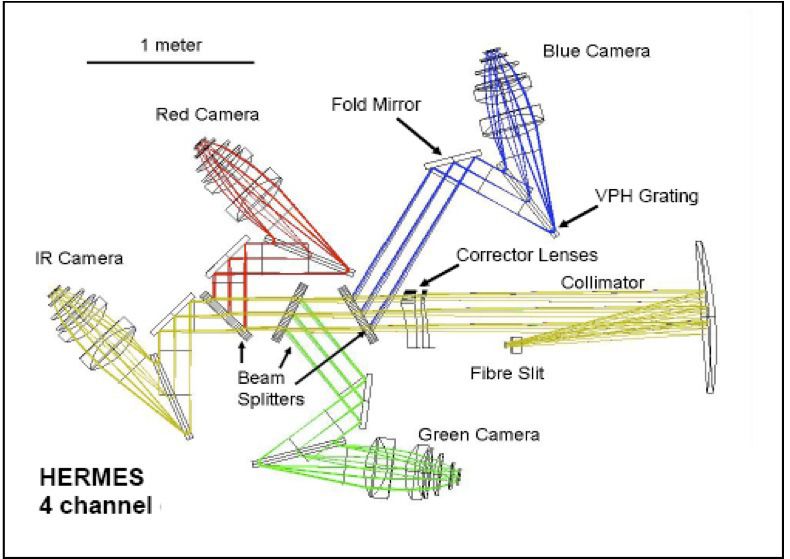
These ideas go back to Searle & Zinn (1978); for a recent account of the state of the Galactic halo
in this context, see Carollo et al. (2010).
The influence of infall of small evolved satellite system is not confined however to the stellar halo:
it may also a↵ect the build-up of the disk and bulge. Such infall is prominent in CDM simulations
of galaxy formation (see for example Abadi et al. 2003), and we need to consider the detection of
the debris of such systems in the context of the archaeology of the Galaxy’s major components.
This paper provides an overview of the proposed HERMES GALAH1 survey. The goal of the survey
is to acquire high resolution spectra of about a million stars for chemical tagging, in order to build
up the history of assembly of the Galaxy. The paper starts with some general points about the
main components of the Galaxy. In sections 3 and 4, we discuss some specific issues in Galactic
archaeology and chemical tagging. Section 5 presents a brief overview of the HERMES instrument
and section 6 describes the proposed GALAH survey.

2     Galactic Components

In addition to their defining thin disks, almost all spirals appear to have a thick disk component.
For large spirals like the Milky Way, the thick disk mass is typically about 10% of the thin disk,
and its vertical scale height is about 1000 pc; the scale height of the thin disk is typically about
300 pc. Near the sun, the thick disk is more metal poor, although the abundance ranges of the
thick and thin disk stars overlap. The thin disk stars have [Fe/H] in the range 0.7 to +0.5,
while most of the thick disk stars have [Fe/H] between about 1 and 0.3, with tails extending
to 2 and 0.1. The similarity of the abundance spread of the thick disk stars near the sun to
the globular clusters is remarkable. The stars of the thin and thick disks have di↵erent motions,
di↵erent density distributions and di↵erent distributions in the [↵/Fe]–[Fe/H] plane, where [↵/Fe]
is the mean abundance of the ↵-elements Mg, Si, Ca and Ti relative to Fe. In the [Fe/H] interval
over which the two disk components overlap (about 0.7 to 0.1), the thick disk stars are distinctly
more ↵-enhanced, indicating that their chemical evolution occurred more rapidly. Near the sun,
the stars of the thick disk appear to be old, with ages in excess of about 10 Gyr.
We know that the Galactic thin disk shows a mean radial abundance gradient of about 0.07 dex
kpc 1 . Near the sun, the thin disk stars cover a wide range in age, with the oldest stars having
ages up to about 10 Gyr. Their age-metallicity relation (Figure 1) shows that stars of almost all
ages up to about 10 Gyr cover a broad abundance range, with [Fe/H] values between about 0.7
to +0.5 and only a weak trend of increasing abundance with decreasing age. The current belief is
that the most metal-rich thin disk stars near the sun did not form near the sun but rather formed
in the more metal-rich inner Galaxy and migrated radially out to the solar neighborhood. Radial
migration is a big issue in Galactic archaeology right now. It is believed to be driven by the torques
of the Galactic bar and spiral arms, which can move stars radially inwards and outwards from one
near-circular orbit to another (Sellwood & Binney 2002), without significantly heating the disk. We
do not know how important radial mixing has been in determining the current state of the Galactic
disk. This question can be answered using the techniques of Galactic archaeology: see section 6.7.
Measuring stellar ages is a vital part of Galactic archaeology. When fossil relic stars of dispersed
star forming events are identified, we will need to estimate their ages in order to build up a picture of
the assembly of the Milky Way. Gaia will be a vital part of such work. It will give us accurate stellar
distances: having measured the metallicities and temperatures spectroscopically, we can hope to
measure the ages of the relics from their colour-magnitude diagrams. In the pre-Gaia era, measuring
accurate ages for individual stars is still difficult. Near the sun we can use subgiants and stars near
the main sequence turno↵, for which ages can be estimated from isochrones in the log g–Teff plane.
These stars are too faint to study at larger distances, and we therefore know relatively little about
the age-metallicity distribution of the disk away from the solar neighbourhood. We can use giant
    1 www.aao.gov.au/HERMES/GALAH

                                                   2
Figure 1: The age-metallicity relation for subgiants near the sun (Wylie de Boer & Freeman,
unpublished). The estimated random errors in [M/H] are shown by the error bar. The random
errors in age are believed to be about 30%.

stars to study the chemical properties of the disk at larger distances from the sun, but we cannot
measure isochrone ages for giants. The problem of measuring ages for giants is partly alleviated by
asteroseismology ages which are becoming available from the CoRoT and Kepler missions.
The bulge of our Galaxy is archaeologically interesting. Small boxy bulges like the bulge of the
Milky Way are now not regarded as the products of mergers. They are believed to have formed
about 8 Gyr ago via bar-forming and bar-buckling instabilities of the early disk. The disk forms an
elongated bar structure at its center, which then buckles vertically and settles into the long-lived
boxy shape. These instabilities of the disk redistribute the disk stars into the bulge. The di↵erent
components of the early inner disk (thick disk, old thin disk, younger thin disk) end up trapped
dynamically within the bulge structure (Ness et al. 2013). Their distribution within the bulge
depends on their initial phase space distribution before the instability. We can see the relics of
these Galactic components now in the metallicity distribution function of the bulge stars (Figure
2). The same three metallicity components are seen all over the bulge, but their relative weights
change with position in the bulge. In this way, we see a fossil image of the early inner Galaxy,
mapped into the bulge.

3    Galactic archaeology of disk substructure

The Galactic disk near the sun shows some kinematical clumping or substructure (Figure 3). These
clumps represent stars that have some degree of common motion, and they are usually called stellar
moving groups. The stars of the moving groups are all around us: they are seen as concentrations
in velocity but not in position.
Some of these groups are the debris of old disrupted star clusters in the disk. Examples include the
HR 1614 and Wolf 630 moving groups (De Silva et al 2007, Bubar & King 2010). These groups are
now dispersed into extended regions of the Galaxy, and their stars are chemically homogenous and
have common ages. These particular groups are about 2 Gyr old but still retain some kinematical
identity. We can expect to find many older groups of this kind which have lost their kinematical
identity but still preserve their chemical identity. These are the relics of the star formation history
of the Galaxy, and are of great interest for Galactic archaeology.
Other moving groups represent dynamical resonances associated with the pattern speed of the

                                                  3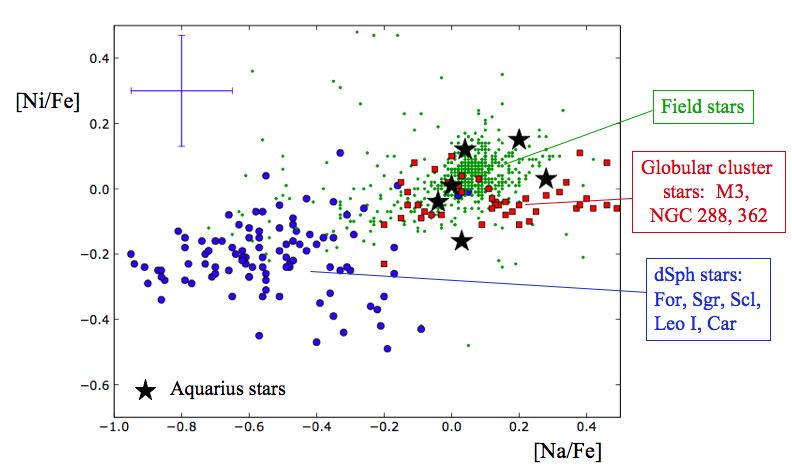
Figure 2: The mean metallicity distribution function for the Galactic bulge at latitude b = 5 .
Ness et al (2013) propose that component C comes from the stars of the early inner thick disk, B
from the inner thin disk and A from the cold metal rich part of the thin disk which is dynamically
very responsive. Two more metal-poor components D and E are also present: they are believed to
come from the metal-poor thick disk (D) and the inner halo (E).

Figure 3: The density distribution of stellar kinematics of stars near the sun (adapted from Dehnen
1999). U and V are the stellar velocity components in the radial and azimuthal directions respec-
tively, relative to the Local Standard of Rest. The irregular substructure near (0,0) is dominated
by relatively young stars. The Hercules feature and the HR 1614 moving group are labelled: see
text.

                                                4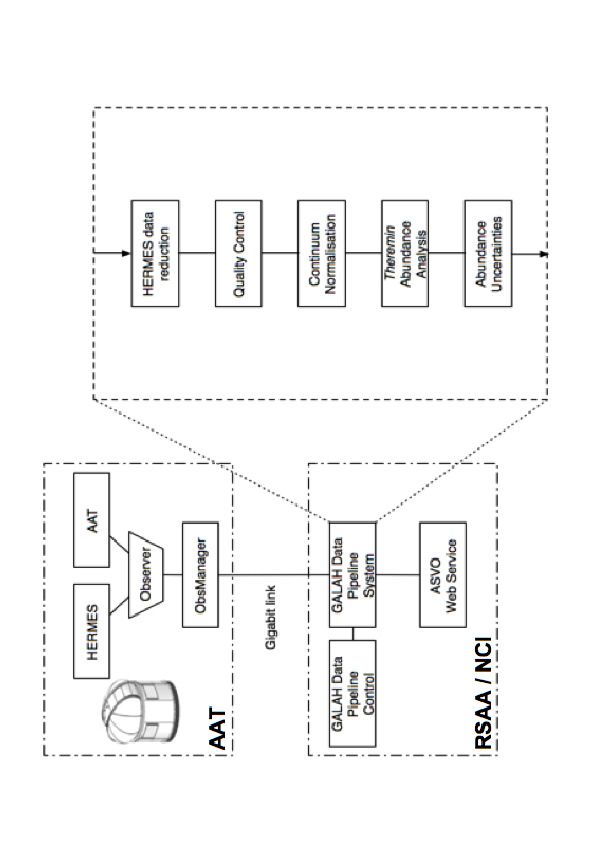
Galactic bar or spiral structure. The Hercules group seen in Figure 3 is an example. Its stars are
chemically a typical sample of the nearby disk, with a wide range of chemical abundances. These
resonance groups are dynamically interesting but are of limited interest for Galactic archaeology.
Some moving groups may be the debris of infalling dwarf galaxies which were accreted by the Milky
Way and were then tidally disrupted. The disrupting Sgr dwarf galaxy is a familiar example. Such
events are commonly seen in CDM simulations of galaxy formation. Part of our goal is to identify
such debris using chemical techniques, even if the debris has lost its kinematical identity, because
this provides a way to make a direct estimate of the accretion history of the Milky Way.
In summary, although the disk does show some surviving kinematic substructure in the form of
moving stellar groups, we can expect that a lot of dynamical information was lost in the the
subsequent heating and radial mixing by spiral arms and giant molecular clouds. Groups like the
HR 1614 group are rare examples of dispersed clusters which cannot be identified spatially but
are still identifiable both chemically and kinematically. Most older dispersed aggregates would not
now be recognisable dynamically, and chemical techniques provide the only way to identify their
debris. Using stellar element abundance distributions to identify stars with common birth sites is
called chemical tagging. The technique has not yet been widely used, but the following paragraph
describes a recent example in which chemical techniques are used to help identify stars which appear
to have been born together, and to work out what kind of parent object they came from.
Wylie de Boer et al (2012) used chemical tagging techniques to identify the nature of the Aquarius
stream (Williams et al 2011). This is a stream of halo stars identified from the RAVE survey. The
stream stars appear to be coming directly towards the sun from near l = 50 , b = 60 , and the
stream extends along the line of sight from 200 pc to 10 kpc. The question is whether the stream
is the debris of a disrupted globular cluster or a dwarf galaxy. From its chemical properties, the
stream appears to be the debris of a globular cluster. Its stars are homogeneous in heavy elements,
with a dispersion in [Fe/H] of 0.09 dex, and they show the Na-O anticorrelation that is seen in
almost all globular clusters. The distribution of the stream stars in the Ni-Na plane (Figure 4) is
di↵erent for globular clusters and dwarf spheroidal galaxies (this is believed to come from the slower
star formation rate in dSph galaxies than globular clusters). The Aquarius stream stars appear to
be more consistent with globular cluster debris than with the dSph galaxies.

4    Chemical Tagging

The idea of chemical tagging is to use the detailed chemical abundances of stars to tag or asso-
ciate them to common ancient star-forming aggregates whose stars have similar abundance patters
(Freeman & Bland-Hawthorn 2002). The stellar abundance pattern over many elements reflects the
chemical state of the gas from which the aggregate formed, and is like a stellar DNA profile. In this
way, chemical studies of the stars in the Galactic disk can help to identify stars that are part of the
debris of common dispersed star-forming aggregates, and also those which came in from outside in
disrupting satellites.
A vital part of the chemical tagging process is that star clusters are known to be chemically homoge-
neous in the heavier elements, to the level of precision with which it is presently possible to measure
them (e.g. De Silva 2009, Pancino et al 2010), and their abundance distributions di↵er from cluster
to cluster. The element abundances within individual clusters have observed dispersions that are
significantly less than 0.1 dex.
The abundance distributions are more complex for dwarf galaxies. As a guide to what to expect
for disrupted dwarf galaxies, we can look at the element abundances in surviving dwarf spheroidal
galaxies (e.g. Venn et al. 2008). The accreted dwarf galaxies underwent a period of chemical
evolution before they were captured and disrupted by the Galaxy. Each dwarf appears to have had
a di↵erent star formation history. The [Fe/H] abundance range of the stars is di↵erent from galaxy
to galaxy, with a mean [Fe/H] value consistent with the usual mass-metallicity relation for dwarf

                                                  5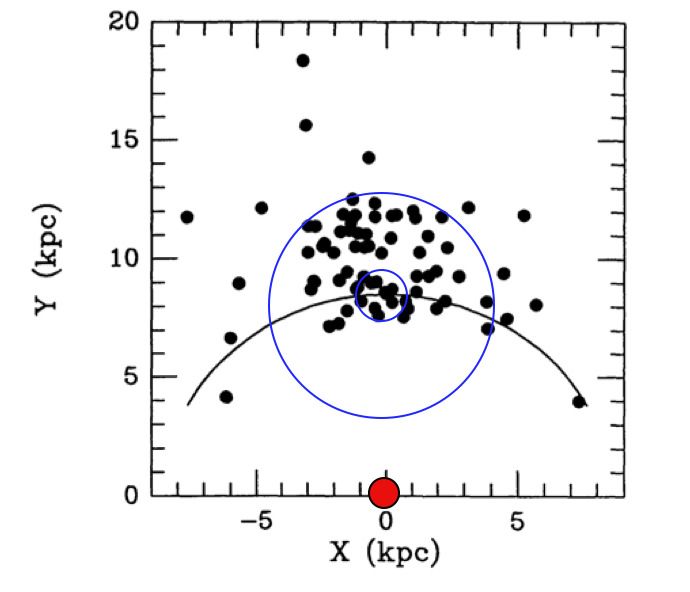
Figure 4: The Na-Ni distribution for globular cluster stars, dwarf spheroidal galaxy stars, field halo
stars and stars of the Aquarius stream (black star symbols) (Wylie de Boer et al. 2012). The stars
of the Aquarius stream are in the same part of the distribution as the globular cluster stars.

galaxies. The distribution of their stars in the [X/Fe]–[Fe/H] plane is well defined for an individual
galaxy but di↵ers in structure from galaxy to galaxy, depending on their star formation history.
(Here [X/Fe] is the abundance of some element relative to Fe.)
We can think of a chemical space (C-space) of abundances of elements: e.g. Na, Mg, Al, Ca, Mn, Fe,
Cu, Zr, Ba, Eu . . . . With the HERMES instrument, abundances for up to about 30 elements will
be measurable. Not all of these elements vary independently from star to star; many vary together
in near-lockstep. The dimensionality or number of independent dimensions of this chemical space
is 8 to 9 (Ting et al. 2012).
Most disk stars inhabit a sub-region of this space. Stars that came from chemically homogeneous
aggregates like dispersed clusters will lie in tight clumps in C-space, with dispersions in each coor-
dinate that are less than 0.1 dex. Stars which came in from satellites will lie on tracks in C-space
which are di↵erent from each other and may be di↵erent enough to stand out from the stars of the
Galactic thin and thick disks.
With this chemical tagging approach, we expect that it will be possible to reconstruct old dispersed
star-forming aggregates in the Galactic disk. An important goal is to identify how significant
mergers and accretion events were in building up the Galactic disk and bulge. Cold Dark Matter
simulations predict a high level of merger activity, which conflicts with some observed properties of
disk galaxies. and it may be possible to put observational limits on the satellite accretion history
of the Galaxy using chemical techniques. This kind of chemical tagging experiment needs a high
resolution spectroscopic survey of about a million stars (see section 6), homogeneously observed
and analysed. This is the prime science driver for the HERMES instrument.
In summary, the observational goal of the chemical tagging survey is to find the debris of groups
of stars, now dispersed, that were associated at birth, either because they were born together in a
single Galactic star-forming event, or because they came from a common accreted galaxy.

                                                  6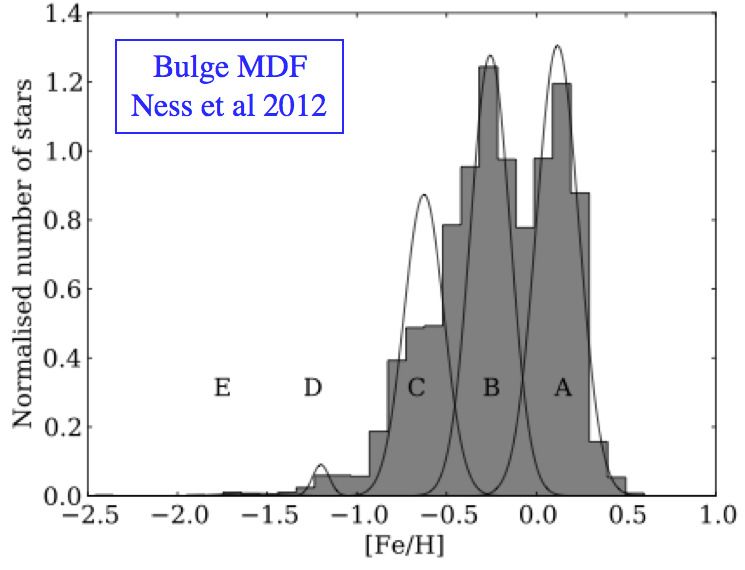
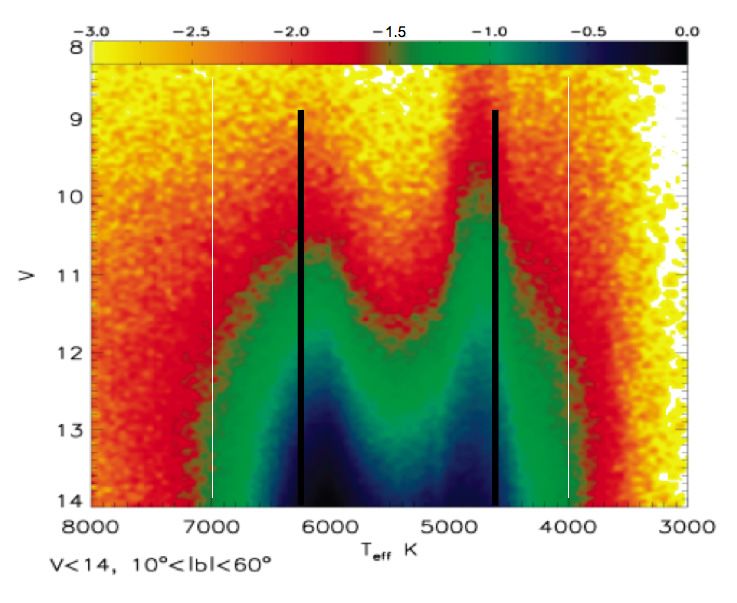
Figure 5: Optical design of the HERMES four-band high-resolution spectrograph

                                      Band     min(Å)    max(Å)
                                      Blue     4718       4903
                                      Green    5649       5873
                                      Red      6481       6739
                                      IR       7590       7890

                        Table 1: Wavelength intervals for the four HERMES bands

5      HERMES

HERMES is a new high resolution fibre-fed multi-object spectrometer on the AAT. It has two
resolution modes (resolving power 28,000 and 45,000), and four non-contiguous spectral bands
covering a total of about 1000 Å between 4718 and 7890 Å. The bands were carefully chosen to permit
the measurement of abundances of as many elements as possible from the major element groups
and nucleosynthetic processes. The fibre positioner is the existing 2-degree Field (2dF) positioner,
with about 390 fibres over ⇡ square degrees. The fibre diameter is about 2.1 arcsec. First light
at the telescope is expected in late 2013. The optical layout of the spectrograph, which is located
in a stable temperature-controlled room at floor level, is shown schematically in Figure 5. The
instrument has a single collimator and four VPH gratings and cameras, with the bands separated
by dichroic beam splitters. Each camera has a 4 ⇥ 4K E2V CCD detector. The wavelengths of the
individual bands are given in Table 1. See Barden et al. (2010) and Heijmans et al. (2012) for
more details2 .

6      Galactic archaeology with HERMES

We are planning a stellar survey (the GALAH survey) of about a million stars, using the HERMES
instrument. The faint limit for the survey is V = 14, chosen to match the typical stellar density
    2 Also   http://www.aao.gov.au/HERMES

                                                     7
Dwarf Giant
Thin disk 0.58 0.19
Thick disk 0.11 0.07
Halo 0.02 0.03
Table 2: Fractional contribution to the GALAH sample from Galactic components
to the fibre density. The survey will cover about half of the accessible sky with galactic latitude
|b| greater than about 10 . The instrument specifications are to give spectra with SNR = 100 per
resolution element (R = 28,000) at V = 14 in a one-hour exposure.
6.1 Stellar selection criteria
We wish to keep the selection criteria for the GALAH survey as simple as possible. The baseline
selection criteria are for a magnitude-limited sample of stars selected from the 2MASS catalogue,
corresponding to a V magnitude of 14, with |b| > 10 and declination < +10 . We are likely to
use about 25 sky fibres in each field, and the density of stars needs to be high enough to ensure
that the remaining fibres (nominally about 365) can be allocated to stars. In practice, this requires
about 450 stars over the ⇡ square degree field. 2MASS flags are set to reduce contamination from
nearby stars. 2MASS astrometry will used: because the epoch of 2MASS is now some years ago,
the astrometry will be corrected as needed using proper motions from PPMXL and UCAC4.
We plan to use the 2MASS JHK photometry, and the APASS optical photometry as available, to
estimate the stellar magnitudes in the BGRI HERMES bands. These magnitudes will be used after
correction for interstellar and atmospheric extinction to ensure adequate SN in all four bands. The
stars in such a magnitude-limited survey will have a double-peaked temperature distribution, with
one peak dominated by stars near the main sequence turno↵ and the other by clump giants (Figure
6). Table 2 shows an estimate of the expected fractional contribution from the giants and dwarfs
from each of the main Galactic components. The old disk dwarfs are seen out to distances of about
1 kpc, the clump giants to about 5 kpc, and the brightest halo giants to about 15 kpc. The Galaxia
tool (Sharma et al. 2011) has been invaluable for guiding the selection process.
The details of the actual survey, like the adopted resolution, the exposure times, and the Galactic
fields, depend on how well the instrument works, which we will not know until it is on the telescope.
The primary motivation for the survey is the chemical tagging experiment described above. We
can be sure, however, that a sample of a million stars, with high resolution spectra, uniformly
reduced and analysed, and with accurate radial velocities from HERMES and accurate parallaxes
and proper motions from Gaia, will be an invaluable long term resource for a huge range of Galactic
and stellar science, much of which has not yet been thought of.
Several issues for the GALAH survey are still under evaluation and will not be finally decided until
we know more about the instrument performance at the telescope. They include:
• The adopted resolving power for the survey (28,000 or 45,000). The higher resolution mode
uses a slit mask and is expected to involve a light loss of about 0.5 mag.
• The SNR required in each band to achieve adequate abundance accuracy for each of the
elements in the HERMES element list (see below). The target for abundance accuracy is 0.05
dex di↵erentially, and the notional goal for SNR is 100 per resolution element for resolving
power 28,000.
• Whether to impose a colour cut on the sample. We are considering excluding stars with
temperatures outside the range 4000 < Teff < 7000 for which it will be more difficult to
8Figure 6: Histogram of Teff for stars with 10 < |b| < 60 and V < 14 from GALAXIA tool (Sharma
et al. 2011). The two peaks in the distribution are for stars near the main sequence turno↵ and
for clump giants. The white vertical lines show possible high and low-Teff cuto↵s for the sample.
measure abundances. Although the fraction of stars outside this temperature range is only a
few percent of the sample (see Figure 6), it corresponds to several ⇥104 stars.
• Whether to use a fixed limit on galactic latitude as above, with |b| > 10 , or to use a limit on
the (Schlegel) reddening, say E(B V ) < 0.2. Excluding the more highly reddened stars may
be useful for deriving more accurate photometric temperatures (if we choose to use them in
the analysis), for estimating accurate stellar ages from the Gaia parallaxes (see below), and
for more accurate Galactic modelling. A simple cut on galactic latitude has some advantages
in modelling.
• Whether to use a fixed or dynamic tiling strategy.
For wide-field multi-object surveys with small fibres covering a significant wavelength range (about
320 nm for the GALAH survey), various chromatic e↵ects are a concern. At the prime focus of the
AAT, a two-prism atmospheric dispersion corrector reduces the e↵ects of atmospheric dispersion.
The impact of di↵erential atmospheric refraction across the two-degree field is minimised by the
fibre configuration software, but integrations near the meridian lasting not more than about one
hour are more efficient. Finally, the two-degree field corrector has significant chromatic distortions
over the field, with which we have to live (Cannon 2000, 2008).
6.2 External calibration
We need to observe a number of calibration objects to ensure that we can transform the system
of the GALAH data products to the systems of other observers. Experience from previous surveys
has shown how important it is to cover the parameter space of the stars as completely as possible.
For radial velocity calibration, we plan to observe a wide selection of stars from the Gaia radial ve-
locity standards list. For stellar parameter calibration, including individual element abundances, we
will use a set of well observed open and globular clusters. Our relatively bright limiting magnitude
prevents us from using globular clusters for calibration of the fainter, higher-gravity, metal-poor
stars. For those, we will have to observe a grid of well measured individual stars covering the whole
range of temperature, gravity and metallicity.
9Figure 7: Data Flow for the GALAH survey data
For cross calibration with other major surveys, such as APOGEE and ESO-Gaia, we will observe a
number of fields observed by these surveys, constrained again by our limiting magnitude.
6.3 Program operations and data flow
At the telescope the observer will supply fibre configuration files (FLDs) for fields to transit at
approximately mid-exposure. The exposure times will be about 60 min (seeing dependent). The
FLDs are generated by the ObsManager task. Targets will be drawn from the input catalogue
described above. Objects included in each FLD will be marked as pending observation in the input
catalogue database table. If an exposure is aborted, ObsManager will reset the observation status
of the a↵ected stars so that they are available for reobservation.
The fibre spectra from each of the four bands are imaged on to a 4K⇥4K CCD. For each fibre
configuration, flat field exposures and ThXe wavelength calibration spectra are acquired. The
2dfdr reduction pipeline at the telescope performs a preliminary reduction of the data for observer
quality control. This task subtracts scattered light, extracts and wavelength calibrates the spectra,
and subtracts the sky using the sky spectra from the sky fibres. Issues for the basic reduction that
are still under investigation include
• The strategy for handling scattered light optimally, including evaluation of the maximum
feasible magnitude di↵erence between stars in adjacent fibres on the fibre slit and the overall
maximum acceptable range in stellar magnitude within an individual fibre configuration.
• The strategy for sky subtraction. While the sky is only a small contributor to the spectrum
for stars with V = 14 on clear bright nights, it will be more significant on nights with thin
cloud. The sky will contribute a fraction of solar spectrum at near-zero velocity which must
10be subtracted before the element abundance analysis can be done.
The raw data are transferred to the Research School of Astronomy & Astrophysics (RSAA) com-
puter facility in Canberra. Here, data reduction is managed by the GALAH Analysis Pipeline
(GAP). GAP is a bespoke pipeline for the GALAH survey. The main stages of GAP are outlined
in Figure 7. The system consists of a series of modules that perform the required data reduction,
quality control, continuum normalization, chemical abundance determination, and data delivery via
the Internet.
Pipeline modules are implemented in C and Fortran (the Theremin code base) for numerically
intensive processes, with Python scripting to facilitate process control. Pipeline progress is tracked,
and results recorded in a postgresql database. Modules act on the smallest data entities possible
(each star in the case of Theremin, each field in the case of 2dfdr, for example). This enables us to
take advantage of the multi-core environment to initiate parallel analysis.
The first GAP stage is a standardised rereduction of the raw data using a fixed version of the 2dfdr
task to avoid inconsistencies in reduction parameters. A sanity check is applied to the zeropoints
derived in each wavelength region. If passed, a fit is made to the continuum for the spectra of each
star targeted in the field.
Rapidly rotating stars and unusual stars like various kinds of spectroscopic binaries and chromo-
spherically active stars are identified using the local linear embedding technique of Matijevic et
al (2012) and set aside. For normal stars, the spectra from the four wavelength bands are then
analysed by the Theremin module which estimates spectroscopic Teff and log g values and detailed
abundances for up to about 30 elements (see below). This automatic pipeline is based on MOOG
(Sneden 1973). The data products are then entered into the GALAH database at the National
Computational Infrastructure (NCI) facility on the ANU campus.
We note here the complementarity of Gaia and GALAH. Gaia data for the GALAH stars will be part
of the data base as it becomes available. From about 2016, Gaia will provide precision astrometry
for the GALAH stars. At the bright magnitudes of the GALAH sample, Gaia will be at its best,
with parallax and proper motion uncertainties of about 10 µas and 10 µas yr 1 respectively at the
end of the Gaia survey. These correspond to 1% distance errors at a distance of 1 kpc and 0.7 km
s 1 errors in transverse velocity at 15 kpc. The GALAH radial velocity errors are expected to be
less than 0.5 km s 1 . The outcome will be very accurate absolute magnitudes and 3D velocities for
the whole GALAH sample, and the ability to construct accurate colour-magnitude diagrams for all
relic systems that are recovered by chemical tagging. This will be very valuable for estimating ages
and as an independent check that the stars of recovered chemically homogeneous groups do have
common ages.
The end goal of the GALAH survey is to use the abundance data, complemented by phase space
information from Gaia and GALAH, and age data from Gaia, to implement the recovery of relic
systems via chemical tagging. Work on this phase is in progress: see Mitschang et al. (2013) for a
recent overview.
6.4 Survey management
The GALAH survey team has eight working groups with particular tasks: abundance analysis
pipeline, chemodynamics and chemical tagging, stellar physics, stellar reddening and binarity,
GALAH survey strategy, input catalogue and observations, data storage and release, and com-
missioning projects. The basic 2dfdr reduction pipeline is a HERMES project under the care of
the Australian Astronomical Observatory software team. The GALAH survey is managed by the
survey management team which comprises a small executive (the two survey leaders and the HER-
MES instrument scientist), the working group convenors and the two project managers who will
oversee the day to day operation of the survey, one for the operations at the telescope and the other
for the data management. The observations a the telescope, supervision of the chemical pipeline
11and scientific exploitation will be done by the GALAH team whose current membership is listed as
authors of this paper.
HERMES commissioning and science verification is likely to take place in late 2013. The notional
schedule is for a pilot survey late in semester 2013B and then to start the main GALAH survey in
semester 2014A.
6.5 Scope of the GALAH survey
Our goal is to identify debris of disrupted clusters and dwarf galaxies. Assume that these objects
disrupted long enough ago so that their debris is now azimuthally mixed right around the galaxy.
The GALAH survey has a horizon which depends on the type of star. About 9% of the thick
disk stars and about 14% of the thin disk stars pass through our 1 kpc dwarf horizon, and we are
assuming that all of the disrupted objects whose orbits pass through a ±1 kpc-wide annulus around
the Galaxy at the solar circle are represented within our horizon.
Simulations (Bland-Hawthorn & Freeman 2004, Bland-Hawthorn et al. 2010) show that a random
sample of a million stars with V < 14 will allow detection of about 20 thick disk dwarfs from
each of about 3000 star formation sites, and about 10 thin disk dwarfs from each of about 30,000
star formation sites. These numbers are indicative only and depend on the upper and lower mass
limits for the mass spectrum of the disrupted objects. See Bland-Hawthorn et al. (2010) for more
discussion. A smaller survey would mean less stars from a similar number of star formation sites.
A survey of a million stars would require high quality observations of about 3000 fibre fields. These
would also provide for repeat observations of about 5% of the stars to estimate binarity and internal
survey errors. Depending on the adopted tiling strategy. this would take about 400 clear bright
nights with seeing no worse than about 2 arcsec.
Is it possible to detect the debris of about 30,000 di↵erent star formation sites, using chemical
tagging techniques ? Are there enough independent cells in C-space to make this possible ? The
answer appears to be yes. We would need about 7 independent chemical element groups, each with
about 5 measurable abundance levels, to get enough independent cells (i.e. 57 : 48 would also be
sufficient). The abundance spread in each of the thin and thick disks is at least 0.5 dex, and we
expect to be able to measure the element abundances with di↵erential random errors of about 0.05
dex, giving more than 10 measurable abundance levels. The dimensionality of chemical space is
now known to be 8 to 9, so it is possible that we could have about 108 independent cells in the
GALAH C-space. We discuss this further in the next section.
6.6 The dimensionality of the GALAH chemical space
We expect to be able to measure abundances for at least 25 elements (Li, C, O, Na, Al, K; Mg, Si,
Ca, Ti; Sc, V, Cr, Mn, Fe, Co, Ni, Cu, Zn; Y, Zr, Ba, La, Nd, Eu), with a few more elements in
some stars. The HERMES spectral bands (BGRI) were carefully chosen to ensure measurable lines
of these elements, which represent most of the major element groups and nucleosynthesis processes.
The bands also include the H↵ and H lines.
The variation of these elements from star to star is highly correlated, and the number of independent
dimensions of this C-space is much less than 25. Ting et al. (2012) made a principal component
analysis (PCA) of element abundances from catalogues of metal-poor stars, metal-rich stars, open
clusters and also of stars in the Fornax dSph galaxy. The PCA included detailed simulation of
the e↵ects of observational errors on the apparent dimensionality of the C-space. The outcome is
that the HERMES C-space has dimensionality of 8 to 9 for all these samples, but the principal
components change from sample to sample.
The principal components are vectors in the C-space of the element abundances [X/Fe], and these
12Figure 8: The location of old open clusters projected on to the Galactic plane. The red circle shows
the Galactic center. The sun is at the center of the blue circles. The smaller blue circle shows the
horizon for HERMES old turno↵ stars, and the larger circle shows the horizon for clump giants.
Most of the older clusters in the inner disk have been disrupted. The sample of HERMES clump
giants in the inner disk is expected to include the debris of many disrupted clusters. Adapted from
Friel (1995).
vectors are identifiable with nucleosynthetic processes. The principal components are eigenvectors
of the correlation matrix, and are all orthogonal in the C-space: therefore the higher components
are projections on hyperplanes normal to the more prominent components.
The number of significant principal components is similar for metal-rich and metal-poor stars,
but the actual components are di↵erent. The structure of the principal components reflects the
dominant nucleosynthetic processes for each sample (see Ting et al. 2012 for a detailed discussion).
The interpretation of the first principal component (the component with the largest eigenvector) is
usually clear, but it is not so obvious for the others because of the projection.
For example, for the sample of low-metallicity stars with 3.5 < [Fe/H] < 2 (excluding the carbon-
enhanced metal-poor stars), the first principal component includes all of the n-capture elements and
the alpha-elements. It is probably related to core-collapse SN producing alpha-elements plus the
r-process contribution to n-capture elements. The second component shows an anticorrelation of
alpha-elements with Fe-peak and n-capture elements, and may be related to “normal” core-collapse
SN which do not contribute to the r-process.
Ting et al. also compared the C-space for open clusters, which have Galactocentric radii from 6 to
20 kpc, with the C-space for metal-rich stars in the solar neighborhood. The C-space for the clusters
has about one more dimension than the stars near the sun. We may find for the GALAH sample
that the C-space for the more widely distributed giants (see Figure 8) has more dimensions than
the C-space for the dwarfs, which cover a smaller area of the Galaxy, similar to the area covered by
the Ting metal-rich sample.
The PCA components are based on samples of a few hundred stars which had not always been
homogeneously analysed. The homogeneously observed and analysed GALAH sample of about a
13million stars will help to delineate the nature of the principal components more clearly, and promises
a new level of insight into the nucleosynthesis processes that lie behind the chemical evolution of
the Galaxy. Using PCA techniques on such a large sample of stars, it will be possible to learn a lot
about the contributions of the various nucleosynthetic processes in each Galactic component, as a
function of position and velocity, or as a function of the orbital integrals.
6.7 Chemical tagging in the inner Galactic disk
Although young open clusters are present in the inner Galaxy, the old (> 1 Gyr) surviving open
clusters lie mostly in the outer Galaxy, beyond a radius of about 8 kpc (Figure 8). The absence
of old open clusters in the inner Galaxy is usually attributed to the stronger disruptive influence
of the Galactic tidal field and interactions with giant molecular clouds in the inner Galaxy. This
suggests that we may expect to find the relics of many disrupted open (and globular) clusters in
the inner disk. The inner disk may then be a good place to apply chemical tagging techniques
to recover cluster debris, using GALAH giants in the inner disk. It seems likely that the inner
Galaxy also contains the debris of disrupted globular clusters. The Na/O anticorrelation is unique
to and ubiquitous in globular clusters, and will help to identify the debris that comes from globular
clusters. We expect about 200,000 survey giants to lie in the inner regions of the Galaxy.
Disrupted clusters will provide a strong test of the importance of radial mixing for the evolution of
the disk. Open clusters are on near-circular orbits when they are young. In the absence of radial
mixing e↵ects, their dispersed debris would still be on near-circular orbits and be confined to a
fairly narrow annulus around the Galaxy. On the other hand, the influence of radial mixing would
be to spread the phase-mixed azimuthally dispersed debris of individual clusters over several kpc
in radius (see Roskar et al. 2008). In this way, the radial extent of the chemically tagged debris
of disrupted clusters of various ages will give a direct measure of how important radial mixing has
actually been to the evolution of the Galaxy over cosmic time.
In this environment of disrupted clusters, we may find chemical streams delineated by the debris of
globular clusters that were in relatively eccentric orbits, or by the debris of open clusters that has
been strongly a↵ected by radial migration. It may be possible to expose such chemical streams by
using smooth chemical evolution models (e.g. Chiappini, Matteucci & Romana 2001) to subtract
o↵ the background abundance gradient in di↵erent elements within the framework of the Galaxia
tool.
References
Abadi, M., Navarro, J.F., Steinmetz, M., Eke, V.R. 2003. ApJ, 591, 499
Barden, S., Jones, D., Barnes, S. et al. 2010. SPIE, 7735, 773509-19
Bland-Hawthorn, J. & Freeman, K.C. 2004. PASA, 21, 110
Bland-Hawthorn, J., Krumholz, M., Freeman, K.C. 2010. ApJ, 713, 166
Bubar, E, & King, J. 2010. AJ, 140, 293
Cannon, R.D. 2000. AAO Newsletter, No. 92, p 14
Cannon, R.D. 2008. AAO Newsletter, No. 113, p 26
Carollo, D., Beers, T.C., Chiba, M. et al. 2010. ApJ, 712, 692
Chiappini, C., Matteucci, F., Romano, D. 2001. ApJ, 554, 1044
De Silva, G., Freeman, K.C., Bland-Hawthorn, J. et al. 2007. AJ, 133, 694
De Silva, G., Freeman, K.C, Bland-Hawthorn, J. 2009. PASA, 26, 11
Dehnen, W. 1999. ApJ, 524, L35
Freeman, K.C. & Bland-Hawthorn, J. 2002. ARAA, 40, 487
Friel, E. 1995. ARAA, 33, 381
Heijmans, J., Asplund, M., Barden, S. et al. 2012. SPIE, 84460W-17
Matijevic, G., Zwitter, T., Bienaymeé, O, et al. 2012. ApJS, 200, 14
Mitschang, A., de Silva, G., Sharma, S., Zucker, D. 2013. MNRAS, 428, 2321
14Ness, M.K., Freeman, K.C., Athanassoula, E., Wylie-de-Boer, E. et al. 2013. MNRAS, 430, 836
Pancino, E., Carrera, R., Rossetti, E., Gallart, C. 2010. A&A, 511, 56
Roskar, R., Debattista, V., Stinson, G., Quinn, T. et al. 2008. ApJ 675, L65
Sellwood, J. & Binney, J. 2002. MNRAS, 336, 785
Sharma, S. , Bland-Hawthorn, J., Johnston, K.V., Binney, J. 2011. ApJ, 730, 3
Sneden, C. 1973. PhD thesis, The University of Texas at Austin
Ting, Y-S., Freeman, K.C., Kobayashi, C., de Silva, G. et al. 2012. MNRAS, 421, 1231
Venn, K. & Hill, V. 2008. ESO Messenger, 134, 23
Williams, M., Steinmetz, M., Sharma, S. Bland-Hawthorn, J. et al. 2011. ApJ, 728, 102
Wylie de Boer, E., Freeman, K.C., Williams, M., Steinmetz, M. et al. 2012. ApJ, 755, 35
15You can also read