Thinning effects on biomass and element concentrations of roots in adjacent hornbeam and oak stands in Istanbul, Turkey
←
→
Page content transcription
If your browser does not render page correctly, please read the page content below
Akburak and Makineci Forest Ecosystems (2021) 8:1
https://doi.org/10.1186/s40663-020-00279-4
RESEARCH Open Access
Thinning effects on biomass and element
concentrations of roots in adjacent
hornbeam and oak stands in Istanbul,
Turkey
Serdar Akburak* and Ender Makineci
Abstract
Background: Thinning is a commonly used treatment in forest management which affects the tree root systems.
The effects of thinning on element concentrations and seasonal change of roots were evaluated in adjacent oak
(Quercus frainetto Ten.) and hornbeam (Carpinus betulus L.) stands according to the different root diameter classes.
Method: Two replicated control and thinning plots (50 m × 50 m) were set for each species (hornbeam and oak).
Thinning treatments (November 2010) reduced 50% of the basal area in both oak and hornbeam stands. Roots
were assessed by seasonal collection over 2 years (from October 2010 to October 2012). The roots were then sorted
into diameter classes of 0–2 mm (fine roots), 2–5 mm (small roots) and > 5 mm (coarse roots). C, N, P, K, Ca, Na, Mg,
S, Mn, Fe, Al, Zn, Pb, Ni, Cu and Cd were analyzed.
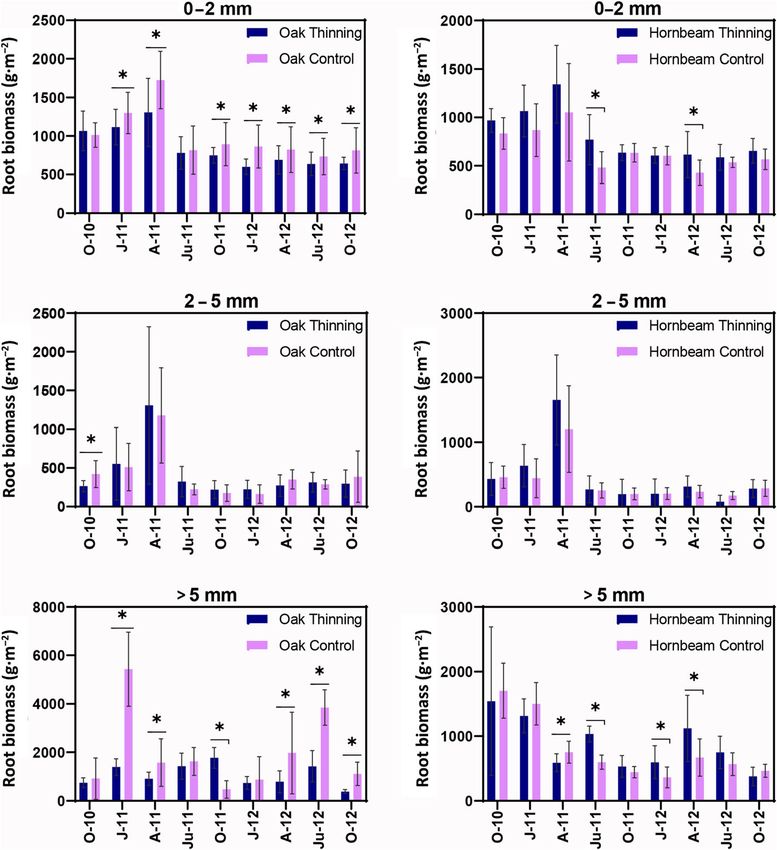
Results: Except coarse roots, the highest root biomasses were determined in April-2011 in all plots. Fine-root
biomass in oak was found significantly higher in control plots. In contrast to the oak, the fine-root biomass in the
thinned hornbeam plots was higher than in the controls. The small-root biomass did not significantly differ
between the thinned and the control plots in both oak and hornbeam stands. However, the coarse-root biomass
showed significant differences between the control (1989 g∙m− 2) and thinned plots (1060 g∙m− 2) in oak, while no
difference was detected in hornbeam. The concentrations of C, Al, Pb, Cd, Ni, Zn, Mn, Na, K, Mg and P in the fine
roots of oak were significantly higher in the thinned plots. However, the concentration of Pb, Cd and Fe in the fine
roots was significantly higher in the thinned plots of hornbeam. Significant differences were observed between the
species for all elements in the fine roots except for C, N and P. In particular, elements in the fine roots tended to
increase in July in the oak. In the hornbeam, all element concentrations in the fine roots (except C, N, and S) in the
thinned plots showed a tendency to increase in April. The concentrations of Pb, Ni, Al, Fe, Cu, Ca, Na, K, Mg and P
in the hornbeam control plots increased during the April 2011 period.
Conclusion: The results indicated that thinning effects on temporal changes and concentrations of elements in the
roots could be attributed to species-specific characteristics.
Keywords: Carpinus, Coarse root, Fine root, Quercus, Small root
* Correspondence: sakburak@istanbul.edu.tr
Faculty of Forestry, Soil Science and Ecology Department, Istanbul
University-Cerrahpasa, 34473 Bahcekoy, Sariyer, Istanbul, Turkey
© The Author(s). 2021 Open Access This article is licensed under a Creative Commons Attribution 4.0 International License,
which permits use, sharing, adaptation, distribution and reproduction in any medium or format, as long as you give
appropriate credit to the original author(s) and the source, provide a link to the Creative Commons licence, and indicate if
changes were made. The images or other third party material in this article are included in the article's Creative Commons
licence, unless indicated otherwise in a credit line to the material. If material is not included in the article's Creative Commons
licence and your intended use is not permitted by statutory regulation or exceeds the permitted use, you will need to obtain
permission directly from the copyright holder. To view a copy of this licence, visit http://creativecommons.org/licenses/by/4.0/.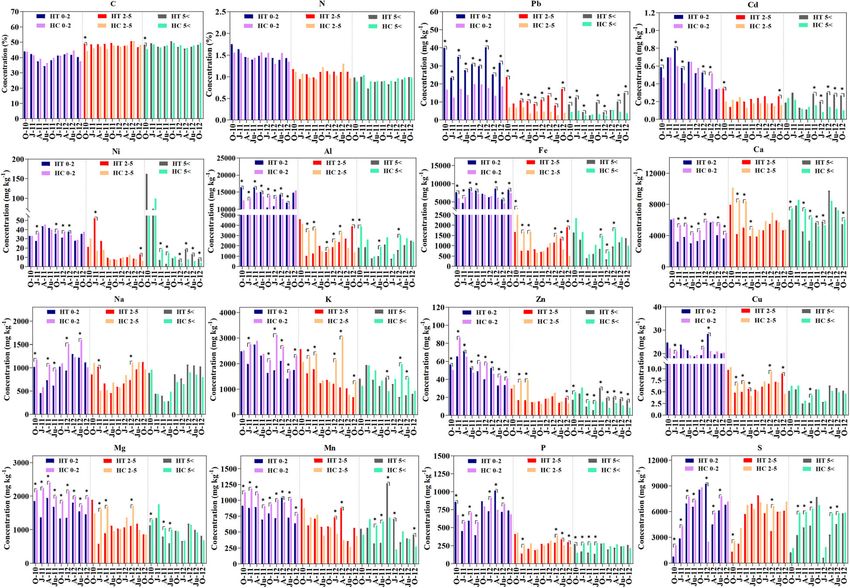
Akburak and Makineci Forest Ecosystems   (2021) 8:1                                                          Page 2 of 10

Background                                                    thinning plots was lower than in the control. When
Tree root systems play a vital role in forest ecosystem       small roots (2–5 mm) were assessed, it showed a change
functions (durability, uptake of water and nutrients, syn-    similar to the temporal change in the fine roots, but in
thesis of various key components including growth regu-       general, a greater change was exhibited in thinning plots.
lators, improvement of soil and water infiltration, root        Roots may also reflect the response to any anthropo-
canal aeration and prevention of soil erosion) (John et al.   genic stress that directly impacts both the physical and
2001; Jose et al. 2004; Thevathasan and Gordon 2004;          chemical characteristics of the soil. Additional informa-
Jose 2009; Ramachandran Nair et al. 2009). Since a sig-       tion is also needed on the key physiological and bio-
nificant proportion of the total biomass in the ecosystem     chemical processes that underpin the cycle of elements
is composed of belowground plant parts, the contribu-         in forests and on how forests are affected by manage-
tion of the roots in the introduction of nutrients and or-    ment practices (Saunders et al. 2012). Correspondingly,
ganic matter into the soil is important for the continuity    trace element (e.g., A1, Pb, Zn, Mn, etc.) accumulation
of the carbon budget and soil fertility (Lehmann and          occurs typically at the root level, even though some
Zech 1998). More than 20% of total tree biomass is be-        plant species do transport these elements to leaves
lowground. Tree roots are important in serving all bio-       (Kabata-Pendias 2010). Many studies have reported on
mass components in many ecosystems (Brunner and               the temporal element changes and biomass of fine roots
Godbold 2007).                                                (Bakker 1999; Soethe et al. 2007; Yuan and Chen 2010;
   Terrestrial ecosystems have been the priority of the       Kim 2012). Comparatively little, however, has been re-
scientific world monitoring the response of global            ported on element stocks and changes in the different
change (Yang et al. 2010). However, the accuracy of the       root diameter classes. Thinning alters the environmental
nutrient and energy budget for forest ecosystems is lim-      characteristics of forest ecosystem (Akburak and Maki-
ited by the difficulty of obtaining reliable estimates of     neci 2015; Akburak and Makineci 2016). Plant root sys-
root production (Eissenstat and Yanai 1997; Vogt et al.       tems have important roles in nutrient and water
1998). In particular, researches on root dynamics and         acquisition, element concentrations, plant success and in
production play an important role in the impact of en-        all ecosystem services and processes. Also, these root
vironmental degradation on ecosystem processes and in         functions importantly differ in different root diameters.
the assessment of net primary production of terrestrial       However, our understanding of these root functions,
ecosystems (Yang et al. 2010).                                how they are influenced by environmental changes and
   Root systems have been divided into a variety of diam-     how they vary among species is still limited (Freschet
eter classes (Finér et al. 2011). Generally, roots smaller    and Roumet 2017). The present study aimed to evaluate
than 2 mm are classified as fine roots, those 2–5 mm as       the effects of thinning treatments on the element con-
small roots, and larger than 5 mm as coarse roots (Finér      centrations and seasonal change of roots according to
et al. 2011). Fine roots (< 2 mm) are the most active and     the different root classes in oak (Quercus frainetto Ten.)
dynamic part of root systems in terms of carbon storage       and hornbeam (Carpinus betulus L.) forest stands. The
and absorption of water and nutrients (Akburak et al.         following hypothesis was tested; thinning would have no
2013).                                                        effect on temporal variations of element concentrations
   Roots systems of managed forests may be more sus-          according to different root diameters in oak and horn-
ceptible to environmental stresses. Therefore, assess-        beam species.
ments of roots are needed to evaluate management
options while considering sustainability of the ecosystem     Materials and methods
structure and function (Law and Waring 2015). Forestry        Study area
treatments such as pruning, prescribed burning, thinning      The study was conducted in stands of pure hornbeam
and clear cutting not only affect the amount and quality      (Carpinus betulus L.) and oak (Quercus frainetto Ten.),
of element inputs into the soil, but also affect the root     coppice originated, adjacent and under similar site con-
systems by breaking the cover and removing biomass,           ditions, in the Education and Research Forest of the Fac-
which then changes the microclimatic properties of the        ulty of Forestry at Istanbul University-Cerrahpasa,
soil (Tang et al. 2005; Masyagina et al. 2010). Thinning      located in Istanbul Province, Turkey (41°09′15″–41°11′
is a common forestry treatment used around the world          01″ N; 28°59′17″–29°32′25″ E). The research site is at
to remove suppressed trees and sustain forest stand           an altitude of 90 m a.s.l., with a slope of 3%–5%, and a
structure (Kim et al. 2019). Since thinning causes to die     west-northwest aspect. Long-term data (1980–2009) in-
of the root systems, the evaluation of root biomass is ne-    dicate a maritime climate with a moderate water deficit
cessary to accurately estimate the carbon accumulation        in summer. The average annual precipitation is 1111.4
of the trees (Le Goff and Ottorini 2001). Ryu et al.          mm and the mean annual temperature is 12.7 °C. The
(2009) found that the amount of fine roots in the             soil group is Luvisol (IUSS Working Group WRB 2006)
Akburak and Makineci Forest Ecosystems     (2021) 8:1                                                      Page 3 of 10

and loamy clay is the general texture type of the soils       Sub-samples (0.5 g) were taken from the roots samples
(Akburak 2013).                                             and placed in Teflon tubes after which 4 mL concen-
                                                            trated HNO3 (nitric acid) and 2 mL H2O2 (hydrogen
Thinning treatment, root biomass sampling                   peroxide) were added and the samples were converted
For each species (hornbeam and oak) two replicated          into solutions in a microwave digestion system (Berghof
control and thinning plots (50 m × 50 m) were set up,       Speed Wave) (Çakır and Akburak 2017). The solutions
and thus, eight sample plots in total were chosen. We       were then prepared with ultra-pure water until the final
determined the stand characteristics including density,     volume reached 50 mL and these were stored at 4 °C
mean tree diameter and tree height of the sample plots      until analysis. The concentrations of phosphorus (P), po-
(Table 1).                                                  tassium (K), calcium (Ca), sodium (Na), magnesium
  Thinning was established by cutting 50% of the stand      (Mg), manganese (Mn), iron (Fe), aluminum (Al), zinc
basal area at the beginning of November 2010. First         (Zn), lead (Pb), nickel (Ni), copper (Cu), cadmium (Cd),
sampling was done at the end of October 2010 before         sulphur (S) in the solutions were determined via ICP-
thinning treatment, and sequential samplings were con-      OES (Perkin Elmer Optima 7000 DV) spectrometer
fined to the central 25 m × 25 m area of each plot in       (Çakır and Akburak 2017). However, certified sample
order to reduce the negative edge effects (Akburak          (NIST 1575a pine needles) was also analyzed in order to
2013). Forest floor and ground cover vegetation were        validate the accuracy of the method and the calibration
manually removed before root sampling. The biomass of       of the device. The recovery was higher than 96% for all
the roots was assessed by collecting five samples from 0    certified elements.
to 35 cm layer using 6.4-cm diameter steel soil corers
(Tufekcioglu et al. 2005; Akburak 2013) per plot once       Statistical analysis
every 3 months from October 2010 to October 2012.           Weights and element concentrations of the root diam-
Over 2 years, 360 root samples in total (8 plots × 5 sam-   eter classes were compared among the plots designated
ples from each plot × 9 sampling times) were collected      as OT (oak thinned), OC (oak control), HT (hornbeam
in the study.                                               thinned) and HC (hornbeam control). The Kolmogorov-
                                                            Smirnov test was used to determine the distribution of
Root materials and chemical analysis                        the dataset (Rohlf and Sokal 1980). As a normal distribu-
The roots were separated from the soil by soaking in de-    tion could not be achieved by common transformations,
ionized water and then gently washing them over a           the differences between the plots were tested by
series of sieves with mesh sizes of 2 and 5 mm, and they    Kruskal-Wallis analysis (Rohlf and Sokal 1980). The
were manually sorted. Diameters of long roots over the      Mann-Whitley U test was used to identify the significant
sieve of 5 mm mesh size were measured with digital cali-    effects (Rohlf and Sokal 1980) of thinning on root elem-
per, and they were cut at the segment points of 2.0 and     ent stocks. Differences were considered significant at p
5.0 mm. Other organic matters were removed from tree        < 0.05. All statistical analyses were performed using
roots by color and form. Live and dead roots were not       IBM-SPSS 20.0 software.
separated and evaluated as total biomass. They were
then sorted into root diameter classes of 0–2 mm (fine      Results
roots), 2–5 mm (small roots) and > 5 mm (coarse roots).     Effects of thinning on root biomass
The categorized roots were oven-dried at 65 °C for 24 h     In the mass of fine roots, the differences between species
and then weighed (Tufekcioglu et al. 2006). The samples     and the differences between thinned and control plots
were ground by grinding mill, and the Dumas dry com-        were significant (Table 2). On comparison between
bustion method was used for the determination of car-       thinned and control plots, the small-root mass showed
bon (C) and nitrogen (N) contents using a LECO              no significant differences in both species. The coarse
Truspec 2000 CN analyzer (Akburak 2013).                    roots exhibited a significant difference in the oak plots,

Table 1 Stand characteristics of the sample plots
Parameters                                   Oak                                       Hornbeam
                                             Control           Thinning                Control                Thinning
                 −1
Density (trees∙ha )                          1112              592                     1408                   702
Basal area (m2∙ha− 1)                        22.7              11.4                    26.2                   13.0
Mean tree height (m)                         15.3              15.2                    14.3                   14.2
Mean tree diameter (DBH, cm)                 15.8              15.3                    14.9                   14.7
Taken from Akburak (2013)
Table 2 Results on the comparison of root parameters between thinned and control plots (Kruskal-Wallis and U-test, α = 0.05, n = 90)
0–2a OT OC HT HC p 2–5 OT OC HT HC p >5 OT OC HT HC p
mm mm mm
Massa 842.94a ± 997.84b ± 804.95ac ± 667.69d ± 0.032 Mass 419.82a ± 411.19a ± 480.55a ± 384.01a ± 0.762 Mass 1059.87a ± 1988.76b ± 871.50c ± 783.40c ± 0.000
84.75 106.56 88.18 68.80 54.24 42.30 56.08 42.82 61.61 196.42 62.58 54.15
C 41.22a 39.78b 40.27abc 40.80ab 0.259 C 46.44a 45.54a 48.66b 47.27ac 0.000 C 46.59a 46.41a 47.80b 47.72b 0.013
±0.41 ±0.50 ±0.70 ±0.68 ±0.37 ±0.49 ±0.33 ±0.45 ±0.36 ±0.28 ±0.37 ±0.35
N 1.42a 1.45a 1.49a 1.48a 0.745 N 1.10a 1.12a 1.08a 1.08a 0.290 N 0.95a 0.97a 0.90a 0.94a 0.579
±0.04 ±0.02 ±0.03 ±0.03 ±0.03 ±0.03 ±0.02 ±0.03 ±0.03 ±0.03 ±0.02 ±0.02
Pb 29.04a 24.75b 31.64c 16.69d 0.000 Pb 9.21 a 9.01a 12.64 b 4.99 c 0.000 Pb 2.50 a 3.02 a 8.13 b 3.88 c 0.000
Akburak and Makineci Forest Ecosystems
±1.06 ±0.50 ±0.78 ±0.37 ±0.97 ±0.71 ±0.69 ±0.23 ±0.17 ±0.19 ±0.62 ±0.18
Cd 0.49b 0.44a 0.56c 0.52bc 0.000 Cd 0.28 a 0.23 b 0.23 b 0.18 c 0.000 Cd 0.16 a 0.13 bd 0.23 c 0.15 ad 0.000
±0.01 ±0.01 ± 0.02 ±0.02 ±0.01 ±0.01 ±0.01 ±0.01 ±0.01 ±0.01 ±0.01 ±0.01
Ni 35.38b 31.52a 34.85a 36.91b 0.001 Ni 14.43 ad 10.57 b 17.77 ac 13.16 bd 0.081 Ni 16.69 a 15.92 a 16.95 a 18.36 a 0.780
±0.67 ±0.42 ±0.73 ±0.66 ±1.03 ±0.40 ±1.97 ±1.02 ±2.09 ±2.14 ±2.29 ±2.59
(2021) 8:1
Zn 52.67bc 47.55a 50.59ab 55.58c 0.003 Zn 21.74 a 21.17 a 18.51 a 23.65 a 0.191 Zn 11.08 a 10.04 a 18.08 b 16.08 c 0.000
±1.01 ±0.66 ±1.72 ±1.83 ±1.32 ±0.87 ±0.69 ±1.47 ±0.89 ±0.44 ±1.02 ±1.03
Cu 22.06 a 22.46 a 21.67 b 21.04 b 0.000 Cu 6.21 a 6.44 a 6.35 a 6.90 a 0.315 Cu 4.12 a 4.83 bc 4.65 ac 4.83 bc 0.029
±0.32 ±0.16 ±0.45 ±0.20 ±0.21 ±0.14 ±0.25 ±0.29 ±0.21 ±0.12 ±0.22 ±0.18
Mn 613 a 478 b 812 c 1008 d 0.000 Mn 243 a 198 b 671 c 548 d 0.000 Mn 159.1 a 133.7 b 549.5 c 506 c 0.000
±15.7 ±8.44 ±17.1 ±16.7 ±10.4 ±7.09 ±27.9 ±28.9 ±7.61 ±5.11 ±39.3 ±27.6
Al 15742a 14,879 b 13786bc 13151c 0.000 Al 2473 ad 3069 b 2347 ac 2624 bd 0.002 Al 1386 a 2023 bd 1616 c 2400 d 0.000
±339 ±146 ±323 ±162 ±114 ±135 ±167 ±166 ±159 ±130 ±105 ±141
Fe 9374a 9860b 7271c 6533d 0.000 Fe 1242 a 1714 b 1154 a 1420 a 0.000 Fe 958 ac 1436 bd 954 c 1345 d 0.000
±186 ±64.5 ±181 ±113 ±72.5 ±103 ±68.6 ±123 ±115 ±95.4 ±69.2 ±84.9
Ca 5533a 5686b 4004c 5302ad 0.000 Ca 11,218 a 10379a ± 5075 b 6674 c 0.000 Ca 10,361 a 9252 a 6219 b 6894 b 0.000
±51.5 ±40.6 ±143 ±91.3 ±492 414 ±191 ±264 ±575 ±207 ±288 ±209
Na 1083b 1002a 937a 1140b 0.001 Na 763 a 808 a 788 a 828 a 0.821 Na 660 a 830 b 756 ab 674 ab 0.020
±28.3 ±30.4 ±37 ±39.8 ±33.3 ±37.8 ±36.7 ±36.3 ±53.1 ±47.1 ±43.8 ±34.3
K 3007a 2764b 2022c 2504d 0.000 K 2011 a 1720 bd 1397 c 1852 ad 0.004 K 1453 ac 1883 a 1201 b 1428 c 0.000
±75.6 ±75.3 ±57.3 ±57.9 ±137 ±96.4 ±77.7 ±94.1 ±82.5 ±131 ±56.2 ±58.7
Mg 2533 a 2401 b 1593 c 2060 d 0.000 Mg 1118 ac 978 b 1081 bc 1296 d 0.001 Mg 836.9 a 814 a 994 b 1107 c 0.000
±35.4 ±15.2 ±31.3 ±28.8 ±40.2 ±30.9 ±48.6 ±57 ±53.6 ±43.6 ±39.9 ±44.1
P 732 a 673 b 710 abc 737 ac 0.194 P 298 ac 239 b 271 c 292 c 0.000 P 226 a 184 b 216 ac 253 d 0.000
±14.4 ±13.3 ±26.6 ±14.9 ±8.6 ±6.1 ±12.6 ±10.4 ±6.2 ±6.3 ±9.4 ±7.7
S 2060a ± 2205 a 3109 b 3104 b 0.000 S 1409 a ± 1365 a 2616 b 3118 c 0.000 S 1073 a ± 1146 a 2018 b 2662 c 0.000
75.6 ±60.8 ±146.2 ±136.9 54.8 ±38.2 ±130.4 ±72.7 39.3 ±50.6 ±134.6 ±108.0
a
: Taken from Akburak (2013), “±” standard error, data are mean values, OT: Oak thinned area, OC: Oak control area, HT: Hornbeam thinned area, HC: Hornbeam control area, mass: g∙m−2, C and N: %, other
elements: mg∙kg−1
Page 4 of 10Akburak and Makineci Forest Ecosystems (2021) 8:1 Page 5 of 10 whereas no significant differences were detected in the Effects of thinning on fine root element concentrations hornbeam plots. On the other hand, the oak had a sig- In the thinned oak plots, concentrations of C, Pb, nificantly greater coarse root mass than the hornbeam Cd, Ni, Zn, Mn, Na and Mg were significantly higher (Table 2). than those of the controls at the rates of 3.6%, In terms of temporal changes, for the oak plots, the 17.3%, 11.4%, 12.5%, 10.8%, 28.3%, 8.1% and 4.4%, fine-root biomass reached significantly the highest values respectively. On the other hand, concentrations of Al in April 2011 and was generally higher in the control. (5.9%) and Fe (5.5%) were higher in the control plots The small roots had a temporal tendency similar to that (Table 2). Significantly higher concentrations of Pb, of the fine roots; however, the thinned plots had a Cd and Fe, with rates of 86.6%, 7.7% and 10.7%, re- greater mass than the control. Moreover, the mass of the spectively, were found in the thinned hornbeam coarse roots of the thinned plots had markedly lower plots. However, Ni, Zn, Mn, Ca, Na, K and Mg had values than the control (Fig. 1). higher values in the hornbeam control plots, at the Generally, in the hornbeam plots, the temporal rates of 5.9%, 9.9%, 24.1%, 32.4%, 21.7%, 23.8% and changes in the root masses of the different root classes 29.3%, respectively (Table 2). Neither oak nor horn- were similar to those of oak; however, the fine-root mass beam showed a significant difference between of the thinned plots had a higher tendency than the con- thinned and control plots for N, Cu and S concen- trol, in contrast to the oak (Fig. 1). trations (Table 2). Fig. 1 Seasonal variations of root biomass in different root diameter classes, error bars show standart deviation. “*” shows significant differences between areas. O: October, J: January, A: April, Ju: July
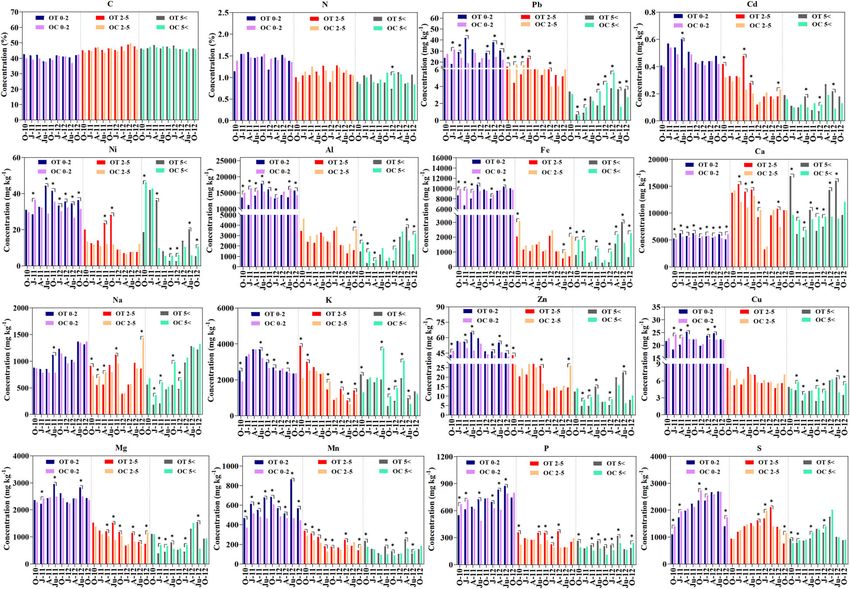
Akburak and Makineci Forest Ecosystems          (2021) 8:1                                                                                Page 6 of 10

  Significant differences were determined between the                        Ca, Na, K and Mg in the control plots exhibited higher
species for all elements except C, N and P (Table 2). Re-                    values in temporal variation (Fig. 3).
garding temporal changes, C, Pb, Cd, Ni, Zn, Mn, Na, K,
Mg and P concentrations in the fine roots of the thinned                     Effects of thinning on small root element concentrations
oak plots fluctuated and were found in higher values                         The Cd, Ni, Mn, K, Mg and P concentrations of the
than in the controls (Fig. 2). Especially in the thinned                     small roots in the thinned oak plots were significantly
oak plots, all elements except C, N, Ni and Ca reached a                     higher than in the control plots, whereas Al and Fe were
peak in July of each year of the research period (Fig. 2).                   higher in the control (Table 2). The thinned hornbeam
On the other hand, C, Ni, Cu and Mn concentrations in                        plots had significantly higher C, Pb, Cd, Ni and Mn con-
the oak control plots showed a decreasing trend in July                      centrations; however, the Al, Ca, K, Mg and S concen-
of both 2011 and 2012 (Fig. 2). In addition, Pb, Cd, Al,                     trations were significantly lower than those of the
Fe, Zn, Na, P and S showed decreases in July 2011 des-                       controls (Table 2).
pite an increasing trend in July 2012 (Fig. 2). In the                         Regarding temporal changes, N, Pb, Cd, Zn, Cu, Ca,
thinned hornbeam plots, all element concentrations ex-                       Mg, P, S, Fe and Al concentrations in the small roots of
cept C, N and S had an increasing tendency in April                          the thinned oak plots increased in July 2011, but de-
(Fig. 3). In the hornbeam control plots, Pb, Ni, Al, Fe,                     creased in July 2012 (Fig. 2). In contrast, the elements N,
Cu, Ca, Na, K, Mg and P showed different trends in dif-                      Pb, Cd, Zn, P, Mg, K and S in the oak control plots de-
ferent years, with an increase in April 2011 and a de-                       creased in July of both 2011 and 2012 (Fig. 2). Moreover,
crease in April 2012 (Fig. 3), while N, Cd and Mn                            the elements Cd, Ni, Zn, Cu, K, Mg and Ca in the oak
showed a decreasing tendency in April of both 2011 and                       control plots showed a temporal decreasing trend (Fig.
2012 (Fig. 3). In both the thinned and control plots of                      2). The Pb, Cd, Al, Zn, Cu, Mn, Ca, Mg and P in the
hornbeam, temporal changes of the elements were gen-                         thinned hornbeam plots, in addition to the elements C,
erally similar; however, Pb in the thinned plots and Mn,                     Ni, Zn, Al, Na, Mg, P and K in the hornbeam control

 Fig. 2 Seasonal variations of element concentrations in roots in the oak area (OT: Thinning area, OC: Control area). “*” shows significant
 differences between areas. O: October, J: January, A: April, Ju: July
Akburak and Makineci Forest Ecosystems          (2021) 8:1                                                                              Page 7 of 10

 Fig. 3 Seasonal variations of element concentrations in roots in the hornbeam area (HT: Thinning area, HC: Control area). “*” shows signifcant
 differences between areas. O: October, J: January, A: April, Ju: July

plots showed a distinct increase in April (Fig. 3). Regard-                 Discussion
ing temporal variation, Pb, Ni, Fe, Mn and Ca showed a                      Root biomass
decreasing tendency, even though C had an increasing                        Root systems are very important component for forest
trend in the hornbeam control plots (Fig. 3).                               ecosystems regarding annual increase and accumulation
                                                                            of biomass (Kurz 1989; Le Goff and Ottorini 2001). The
                                                                            fine-root biomass in the oak plots reached the highest
Effects of thinning on coarse root element concentrations                   value in April 2011, and the root biomass of the control
The Cd, Mn and P concentrations of the coarse roots                         plots was significantly higher than that of the thinned
in the thinned oak plots were significantly higher than                     plots. Similar to the results of the present study, Ryu
those of the controls; however, Cu, Al, Fe, Na, and K                       et al. (2009) found that the size of the fine-root mass of
concentrations were significantly higher in the control                     the thinned plots was significantly lower than that of the
plots (Table 2). The Pb, Cd, and Zn were significantly                      control plots. This can suggest that the trees remaining
higher in the thinned hornbeam plots despite the                            after thinning treatment originated from coppice sprouts
higher Al, Fe, K, Mg, P and S in the controls (Table                        have old root systems as stated by Cotillas et al. (2016)
2). As for temporal change, Al, Fe, Zn, Cu, Ca, and                         and likely with many dead roots. However, as a limita-
Mg increased in July in the thinned oak plots (Fig. 2).                     tion of this study, we did not compare and determine
The N, Pb, Al, Fe, Zn, Cu, Mn, Ca, K, P and S in the                        the live and dead roots within the limited dates to sup-
oak control plots showed increases in July 2011 and                         port this suggestion. In contrast to the oak plots, the
April 2012 (Fig. 2). In the temporal evaluation of the                      fine-root biomass of the thinned hornbeam plots was
hornbeam plots, N, Pb, Cd, Al, Fe, Cu, Na, Mg, P                            significantly greater than that of the controls. In
and S in both thinned and control plots showed an                           addition, Hwang et al. (2007) reported higher fine-root
important increase in October of the first year and in                      biomass in thinned plots. This can be a result of reduced
April of the second year (Fig. 3).                                          water and nutrient competition after thinning, which
Akburak and Makineci Forest Ecosystems (2021) 8:1 Page 8 of 10
can stimulate fine root production, depending on the determined more P concentrations in fine roots than in
physiological process of the trees remaining after thin- coarse roots. In other similar studies, some authors such
ning (Da-Lun et al. 2010). There were not significant dif- as Fogel and Hunt (1983) and Lemma et al. (2007); re-
ferences in the biomass of small roots between the ported more concentrations of P, K, Mg and S in fine
thinned and control plots for either hornbeam or oak. roots. In a temporal comparison, C, Pb, Cd, Ni, Zn, Mn,
However, Tufekcioglu et al. (2005) reported that small Na, K, Mg and P in the fine roots were found in higher
root-biomass was greater in control plots than in concentrations in the thinned oak plots than in the con-
thinned plots in a beech forest. Coarse roots showed trol plots. On the other hand, in the thinned hornbeam
species-specific results, with significant differences be- plots, the Pb concentration of fine roots was temporally
tween the thinned and control plots in oak, while no sig- higher in the control plots. Vogt et al. (1993) noted that
nificant results were observed in hornbeam. This finding amount of nutrients and trace elements could be altered
can be explained, as mentioned above, the oak plots had under anthropogenic stress conditions. Thus, this situ-
older root systems (Rodríguez-Calcerrada et al. 2011) ation in the thinned plots could be attributed to soil
and thus, they might have had a higher rate of dead properties (temperature, water, pH, etc.) changing by
roots. Temporal change of fine and small root biomass thinning treatment (Akburak and Makineci 2015, 2016).
reached the highest values during the rainy seasons. This In addition, the higher element concentrations of roots
was likely because the rainy season is conducive to the in the thinned plots were likely caused by greater root
use of water and nutrients, and also because temperature growth, element uptake and translocation after the root
conditions are favorable for vegetative plant growth competition was reduced with the thinning treatment.
(John et al. 2001). Similar to the present study, Yin et al. (1991) reported
that Ca, Mg, K, S and P showed significant temporal
Concentration of elements changes and ascribed the possible causes to the dynamic
Element concentrations of different tree fractions are hy- interactions of processes such as root growth, absorption
pervariable and concentrations tend to be higher in the of elements, accumulation in tissues and translocation.
actively growing parts of trees such as leaves, the cam- The elements of roots in July in both investigated years
bium and fine roots (Hellsten et al. 2013; Iivonen et al. (except for small roots in second year) showed a signifi-
2006). Concentrations of C, Al, Pb, Cd, Ni, Zn, Mn, Na, cantly increasing tendency in the thinned oak plots. In
K, Mg and P were higher in the thinned oak plots, contrast, the increasing tendency of elements in roots in
whereas Ca and Fe were higher in the oak control plots. the thinned hornbeam plots was in April (except for
However, Pb, and Fe were higher in the hornbeam con- coarse roots in the first year). This can be explained by the
trol plots. All elements (except C, N and P) showed sig- accumulation of elements in the cell walls due to the
nificant differences between species. Many previous immobilization of elements in the aboveground organs, al-
studies in the literature have reported higher concentra- though the root activities of the removed trees continued.
tions of heavy metals, especially in the fine roots (Yin In addition, temporal changes of elements may have arisen
et al. 1991; Vogt et al. 1993; Bakker 1999; Zhao et al. from a variety of ecological conditions (soil temperature,
2016). Especially higher Al concentrations were deter- soil moisture, etc.), depending on thinning effects and
mined in the fine roots in the thinned oak and horn- genetic characteristics (Yin et al. 1991). Moreover, the
beam plots. The Al accumulation take places in the cell start of the growing period of a tree species can be
walls and plasma membranes through the substitution of species-specific. Similarly, Matula et al. (2012) reported
Al in place of Ca and Mg in the roots (Kinraide 2003). more vegetative growth in hornbeam compared to sessile
In addition, Al is strongly absorbed by roots in a variety oak. Thus, element contents of fine and small roots
of processes or in the formation of insoluble organo-Al showed a decreasing tendency in July in the control plots,
complexes (Taylor 1991; Vanguelova et al. 2007). Van- while the element contents of the coarse roots tended to
guelova et al. (2005) found that the Al accumulation in increase. In the hornbeam control plots, element contents
roots could be increased under changing soil condition of the fine roots decreased in April, while the small and
(water, soil acidity, etc.). In our study, the Al higher con- coarse roots tended to increase. This was explained by
centrations in the thinned plots may be due to changing Kabata-Pendias (2010), who stated that some tree species
soil conditions by thinning treatments. In the present can accumulate heavy metals, especially in the roots, des-
study, all elements except C and Ca generally showed a pite carrying them to the leaves.
decreasing tendency, depending on root diameter. An
especially increasing trend of Ca can be expressed be- Conclusion
cause of the important role of Ca on the formation of In conclusion, thinning had a specific effect on the fine
new cell walls of roots, which increases with the incre- roots of coppice-originated oak species, likely resulting
ment of the root diameter. Meier et al. (1985) in root growth and element absorption and translocationAkburak and Makineci Forest Ecosystems (2021) 8:1 Page 9 of 10
interactions dependent on the decreasing root competi- Competing interests
tion post treatment. Although the hornbeam species was The authors declare that they have no competing interests.
of coppice origin, there were no clear effects of thinning. Received: 16 June 2020 Accepted: 21 December 2020
This situation demonstrated that, due to long-term cop-
pice forest management (periodical clear-cuttings) in the
same site, the roots of the two species of coppice origin
References
developed different responses to the changing site condi- Akburak S (2013) The effects of thinning on soil respiration and microbial
tions through thinning treatment. Thus, temporal respiration in oak and hornbeam stands. Istanbul University, Dissertation
changes of elements in the roots increased in July in oak Akburak S, Makineci E (2015) Effects of thinning on soil respiration and microbial
respiration of forest floor and soil in an oak (Quercus frainetto) forest. Soil Res
and in April in hornbeam, depending on both species- 53:522–530
specific characteristics and changing ecological condi- Akburak S, Makineci E (2016) Thinning effects on soil and microbial respiration in
tions (soil temperature, soil moisture, etc.) after thin- a coppice-originated Carpinus betulus L. stand in Turkey. iForest 9:783
Akburak S, Oral HV, Ozdemir E, Makineci E (2013) Temporal variations of biomass,
ning. The Al and Fe contents of the roots were higher carbon and nitrogen of roots under different tree species Scand. J For Res
than many other elements which are significantly effect- 28:8–16
ive on plant growth. This can be interpreted that roots Bakker MR (1999) Fine-root parameters as indicators of sustainability of forest
ecosystems. For Ecol Manag 122:7–16
are an important agent for Al and Fe cycling in the be- Brunner I, Godbold DL (2007) Tree roots in a changing world. J For Res 12:78–82
lowground element cycle. Overall, obtained results re- Çakır M, Akburak S (2017) Litterfall and nutrients return to soil in pure and mixed
markably indicated the significant effects of thinning on stands of oak and beech. J Faculty For Ist Univ 67:185–200
Cotillas M, Espelta JM, Sánchez-Costa E, Sabaté S (2016) Aboveground and
the temporal changes of element concentrations in roots belowground biomass allocation patterns in two Mediterranean oaks with
and species specific changes in forest nutrition manage- contrasting leaf habit: an insight into carbon stock in young oak coppices.
ment. Further studies are recommended on the dynamic Eur J For Res 135:243–252
Da-Lun T, Yuan-Ying P, Wen-De Y, Xi F, Wen-Xing K, Guang-Jun W, Xiao-Yong C
of roots presenting the restoration capability of different (2010) Effects of thinning and litter fall removal on fine root production and
tree species to achieve the clear conclusions on the ef- soil organic carbon content in Masson pine plantations. Pedosphere 20:486–
fectiveness of thinning in sustainable forest manage- 493
Eissenstat D, Yanai RD (1997) The ecology of root lifespan. Adv Ecol Res 27:1–60
ment. Also, the studies on integrating different forestry Finér L, Ohashi M, Noguchi K, Hirano Y (2011) Factors causing variation in fine
treatments (different thinning levels such as 25% or 75%, root biomass in forest ecosystems. For Ecol Manag 261:265–277
clear-cutting, prescribed fire, etc.) will contribute to the Fogel R, Hunt G (1983) Contribution of mycorrhizae and soil fungi to nutrient
cycling in a Douglas-fir ecosystem. Can J For Res 13:219–232
understanding of chemical interactions in the below- Freschet GT, Roumet C (2017) Sampling roots to capture plant and soil functions.
ground biomass. Funct Ecol 31(8):1506–1518
Hellsten S, Helmisaari HS, Melin Y, Skovsgaard JP, Kaakinen S, Kukkola M,
Abbreviations Saarsalmi A, Petersson H, Akselsson C (2013) Nutrient concentrations in
OT: Oak thinned; OC: Oak control; HT: Hornbeam thinned; HC: Hornbeam stumps and coarse roots of Norway spruce, scots pine and silver birch in
control; HNO3: Nitric acid; H2O2: Hydrogen peroxide; C: Carbon; N: Nitrogen; Sweden, Finland and Denmark. For Ecol Manag 290:40–48
P: Phosphorus; K: Potassium; Ca: Calcium; Na: Sodium; Mg: Magnesium; Hwang J, Son Y, Kim C, Yi M-J, Kim Z-S, Lee W-K, Hong S-K (2007) Fine root
Mn: Manganese; Fe: Iron; Al: Aluminum; Zn: Zinc; Pb: Lead; Ni: Nickel; dynamics in thinned and limed pitch pine and Japanese larch plantations. J
Cu: Copper; Cd: Cadmium; S: Sulphur Plant Nutr 30:1821–1839
Iivonen S, Kaakinen S, Jolkkonen A, Vapaavuori E, Linder S (2006) Influence of
Acknowledgements long-term nutrient optimization on biomass, carbon, and nitrogen
This work was supported by Scientific Research Projects Coordination Unit of acquisition and allocation in Norway spruce. Can J For Res 36:1563–1571
Istanbul University-Cerrahpasa (Project No. FYD-2016-20102). The authors IUSS Working Group WRB (2006) World reference base for soil resources 2006.
thank to four anonymous reviewers and editors for their insightful comments World soil resources reports 103. FAO, Rome, p 145
and suggestions. John B, Pandey HN, Tripathi RS (2001) Vertical distribution and seasonal changes
of fine and coarse root mass in Pinus kesiya Royle ex.Gordon forest of three
Authors’ contributions different ages. Acta Oecol 22:293–300. https://doi.org/10.1016/S1146-
All authors conducted the field experiment, planned and carried out the 609x(01)01118-3
measurements, developed the theory and analytical methods, run the data Jose S (2009) Agroforestry for ecosystem services and environmental benefits: an
analysis and discussed the results. All authors also helped to write, read and overview. Agrofor Syst 76:1–10
approved the final manuscript. Jose S, Gillespie A, Pallardy S (2004) Interspecific interactions in temperate
agroforestry. Agrofor Syst 61:237–255
Funding Kabata-Pendias A (2010) Trace elements in soil and plants, 4th edn. CRC Press,
This work was supported by Scientific Research Projects Coordination Unit of Boca Raton
Istanbul University-Cerrahpasa (Project No. FYD-2016-20102). Kim C (2012) Biomass and nutrient concentrations of fine roots in a Korean pine
plantation and a sawtooth oak stand. For Sci Tech 8:187–191
Availability of data and materials Kim S, Li G, Han SH, Kim C, Lee S-T, Son Y (2019) Microbial biomass and
The datasets used during the current study are available from the enzymatic responses to temperate oak and larch forest thinning: influential
corresponding author on reasonable request. factors for the site-specific changes. Sci Total Environ 651:2068–2079
Kinraide T (2003) Toxicity factors in acidic forest soils: attempts to evaluate
Ethics approval and consent to participate separately the toxic effects of excessive Al3+ and H+ and insufficient Ca2+
The subject has no ethic risk. and Mg2+ upon root elongation. Eur J Soil Sci 54:323–333
Kurz W (1989) Significance of shifts in carbon allocation patterns for long-term
Consent for publication site productivity research. FRI Bulletin. Forest Research Institute, New Zealand
Not applicable. Forest ServiceAkburak and Makineci Forest Ecosystems (2021) 8:1 Page 10 of 10
Law B, Waring R (2015) Carbon implications of current and future effects of Yuan Z, Chen HY (2010) Fine root biomass, production, turnover rates, and
drought, fire and management on Pacific northwest forests. For Ecol Manag nutrient contents in boreal forest ecosystems in relation to species, climate,
355:4–14 fertility, and stand age: literature review and meta-analyses. Crit Rev Plant Sci
Le Goff N, Ottorini J-M (2001) Root biomass and biomass increment in a beech 29:204–221
(Fagus sylvatica L.) stand in North-East France. Ann For Sci 58:1–13 Zhao N, Yu GR, He NP, Wang QF, Guo D, Zhang XY, Wang RL, Xu ZW, Jiao CC, Li
Lehmann J, Zech W (1998) Fine root turnover of irrigated hedgerow NN, Jia YL (2016) Coordinated pattern of multi-element variability in leaves
intercropping in northern Kenya. Plant Soil 198:19–31 and roots across Chinese forest biomes. Glob Ecol Biogeogr 25:359–367
Lemma B, Nilsson I, Kleja DB, Olsson M, Knicker H (2007) Decomposition and
substrate quality of leaf litters and fine roots from three exotic plantations
and a native forest in the southwestern highlands of Ethiopia. Soil Biol
Biochem 39:2317–2328
Masyagina O, Prokushkin S, Koike T (2010) The influence of thinning on the
ecological conditions and soil respiration in a larch forest on Hokkaido Island.
Euras Soil Sci 43:693–700
Matula R, Svátek M, Kůrová J, Úradníček L, Kadavý J, Kneifl M (2012) The
sprouting ability of the main tree species in central European coppices:
implications for coppice restoration. Eur J For Res 131:1501–1511
Meier CE, Grier CC, Cole DW (1985) Below- and aboveground N and P use by
Abies amabilis stands. Ecology 66:1928–1942
Ramachandran Nair PK, Mohan Kumar B, Nair VD (2009) Agroforestry as a
strategy for carbon sequestration. J Plant Nutr Soil Sci 172:10–23
Rodríguez-Calcerrada J, Pérez-Ramos IM, Ourcival J-M, Limousin J-M, Joffre R,
Rambal S (2011) Is selective thinning an adequate practice for adapting
Quercus ilex coppices to climate change? Ann For Sci 68:575
Rohlf JF, Sokal RR (1980) Biometry: the principles and practice of statistics in
biological research. WH Freeman and Company, New York, p 850
Ryu S-R, Concilio A, Chen J, North M, Ma S (2009) Prescribed burning and
mechanical thinning effects on belowground conditions and soil respiration
in a mixed-conifer forest, California. For Ecol Manag 257:1324–1332
Saunders M, Tobin B, Black K, Gioria M, Nieuwenhuis M, Osborne B (2012)
Thinning effects on the net ecosystem carbon exchange of a Sitka spruce
forest are temperature-dependent. Agric For Meteorol 157:1–10
Soethe N, Lehmann J, Engels C (2007) Carbon and nutrient stocks in roots of
forests at different altitudes in the Ecuadorian Andes. J Trop Ecol 23:319–328
Tang J, Qi Y, Xu M, Misson L, Goldstein AH (2005) Forest thinning and soil
respiration in a ponderosa pine plantation in the Sierra Nevada. Tree Physiol
25:57–66
Taylor GJ (1991) Current views of the aluminum stress response: the
physiological basis of tolerance. Curr Top Plant Biochem Physiol 10:57–93
Thevathasan N, Gordon A (2004) Ecology of tree intercropping systems in the
North temperate region: experiences from southern Ontario, Canada. New
Vistas in Agroforestry, pp 257–268
Tufekcioglu A, Bilmiş T, Sağlam B, Küçük M, Altun L, Yılmaz M, Bilgili E (2006)
Influence of fire on belowground root biomass and soil respiration dynamics
in young brutian pine (Pinus brutia) stands in North-Western Turkey. For Ecol
Manag 234:S167
Tufekcioglu A, Guner S, Tilki F (2005) Thinning effects on production, root
biomass and some soil properties in a young oriental beech stand in Artvin,
Turkey. J Environ Biol 26:91–95
Vanguelova E, Nortcliff S, Moffat A, Kennedy F (2005) Morphology, biomass and
nutrient status of fine roots of scots pine (Pinus sylvestris) as influenced by
seasonal fluctuations in soil moisture and soil solution chemistry. Plant Soil
270:233–247
Vanguelova EI, Hirano Y, Eldhuset TD, Sas-Paszt L, Bakker MR, Puttsepp U, Brunner
I, Lohmus K, Godbold D (2007) Tree fine root Ca/Al molar ratio–indicator of
Al and acidity stress. Plant Biosyst 141:460–480
Vogt KA, Publicover DA, Bloomfield J, Perez JM, Vogt DJ, Silver WL (1993)
Belowground responses as indicators of environmental change. Environ Exp
Bot 33:189–205
Vogt KA, Vogt DJ, Bloomfield J (1998) Analysis of some direct and indirect
methods for estimating root biomass and production of forests at an
ecosystem level. Plant Soil 200:71–89
Yang L, Wu S, Zhang L (2010) Fine root biomass dynamics and carbon storage
along a successional gradient in Changbai Mountains, China. Forestry 83:
379–387
Yin X, Perry JA, Dixon RK (1991) Temporal changes in nutrient concentrations
and contents of fine roots in a Quercus forest. For Ecol Manag 44:175–184You can also read