How to Form Behavioral Intentions in the Field of Drone Food Delivery Services: The Moderating Role of the COVID-19 Outbreak - MDPI
←
→
Page content transcription
If your browser does not render page correctly, please read the page content below
International Journal of
           Environmental Research
           and Public Health

Article
How to Form Behavioral Intentions in the Field of
Drone Food Delivery Services: The Moderating Role
of the COVID-19 Outbreak
Jinsoo Hwang 1 , Dohyung Kim 2 and Jinkyung Jenny Kim 3, *
 1    The College of Hospitality and Tourism Management, Sejong University, Seoul 143-747, Korea;
      jhwang@sejong.ac.kr
 2    Seoulland F&B, 181, Gwangmyeong-ro, Gwacheon-si, Gyeonggi-do 13829, Korea; dhkim@seoulland.co.kr
 3    School of Hotel and Tourism Management, Youngsan University, 142 Bansong Beltway,
      Haeundae-gu, Busan 48015, Korea
 *    Correspondence: jennykim1120@gmail.com

 Received: 5 November 2020; Accepted: 3 December 2020; Published: 6 December 2020

 Abstract: This study was designed to identify the significance of drone food delivery services using
 the moderating role of the outbreak of COVID-19. More specifically, this study proposed that there is
 a positive relationship between the overall image and the desire. Additionally, it was hypothesized
 that the desire helps to enhance two types of behavioral intentions, which included word-of-mouth
 intentions and the willingness to pay more. Lastly, the moderating role of the outbreak of COVID-19
 was proposed during this process. Six hypotheses were tested that used 335 samples before the
 outbreak of COVID-19, and 343 samples were used after the outbreak of COVID-19 in South Korea.
 The data analysis results indicated that the overall image has a positive influence on the desire,
 which in turn positively affects the word-of-mouth intentions and the willingness to pay more.
 Furthermore, this study identified the important moderating role of the outbreak of COVID-19 in the
 relationship between the desire and the word-of-mouth intentions.

 Keywords: drone food delivery services; COVID-19; overall image; desire; behavioral intentions

1. Introduction
     The coronavirus disease, which will hereafter be referred to as COVID-19, is a viral respiratory
disease that first broke out in Wuhan, China in December 2019 [1]. As of September 2020, there were
more than 33,492,000 confirmed cases and more than 1,005,000 COVID-19 deaths globally [2]. Around
the world, this tragic pandemic has had a significant effect on the restaurant industry. For instance,
according to the National Restaurant Association [3], about 8 million people, which is about two-thirds
of the people working in the foodservice industry, have lost their jobs since the COVID-19 outbreak.
Also, a sales loss of about US$ 240 billion is expected by the end of 2020.
     One of the reasons these negative statistical results are predicted is that people do not want to eat
out, because they want to avoid coming into contact with the COVID-19 infection. This means that
after the COVID-19 outbreak, the consumers have tended to prefer food delivery services at home
rather than eating out [4]. In this situation, drone food delivery services, which are a contactless
service, are attracting attention in the foodservice industry, because the services provide food without
face-to-face encounters [5].
     Drones are one of the fast-growing sectors recently, and their applications are widely increasing
in diverse industries due to the significant utilization values in many aspects. For example, drones
are used for agricultural imaging, emergency healthcare, product distribution, traffic monitoring,
and transportation [6]. Among these various usages, using drones for deliveries is worth attempting

Int. J. Environ. Res. Public Health 2020, 17, 9117; doi:10.3390/ijerph17239117   www.mdpi.com/journal/ijerph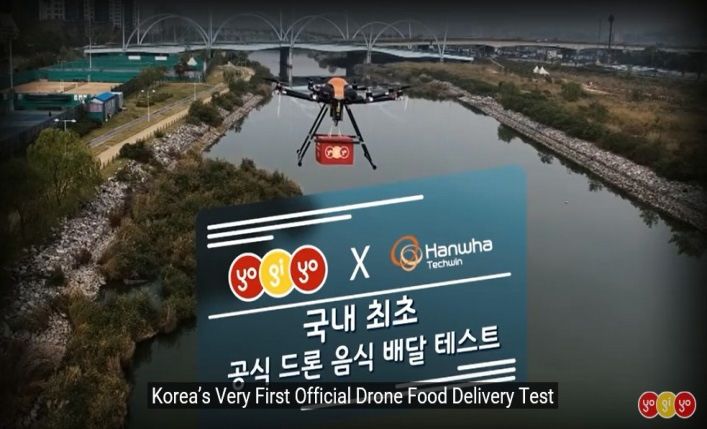
Int. J. Environ. Res. Public Health 2020, 17, 9117                                                    2 of 15

from a pro-environment standpoint. Drone home deliveries are being researched by a number
of companies, such as Amazon, UPS, and Walmart as an alternative to delivering products using
trucks [7]. More specifically, drones consume less fuel and have a smaller impact on the environment,
which therefore makes drone delivery one of the most environment-friendly transportation options [8].
Yoo et al. [9] asserted that drone delivery is faster, less expensive, and more eco-friendly than traditional
delivery facilities, such as trucks and motorbikes.
      The foodservice industry is not spared from the drones’ invasion. Uber has been approved by
the U.S. federal government for food delivery tests using drones, which began in San Diego [10].
Uber could begin delivering food using drones in 2021 [11]. The company pointed out that the
customers could receive food at their doorsteps in five to thirty minutes. Uber is not the first company
to attempt food delivery using drones. FoodPanda offers a delivery service using drones in 20 min in
Hong Kong [10], and Dominos is the first big food chain to test food delivery using drones. Various
benefits of the drone food delivery services were identified through a series of experiments, and the
environmental role of drone-based food delivery has particularly been highlighted in the existing
literature [5]. This literature illustrates that many companies are capitalizing on the commercial value
of drone food delivery services, which is based on its superior role regarding environmental protection.
      Despite the importance of drone food delivery services after the coronavirus pandemic, the research
on it is insufficient. Thus, this study tried to examine how to form behavioral intentions in the context
of drone food delivery services. More specifically, the objectives of this study are to examine (1) the
effect of the overall image of drone food delivery services on the desire to use the services, (2) the
influence of the desire to use drone food delivery services on the behavioral intentions, which includes
the word-of-mouth intentions and the willingness to pay more, and (3) the moderating role of the
COVID-19 outbreak during this process.

2. Literature Review

2.1. Overall Image
      The concept of the overall image has been consistently studied in diverse fields, which include
airlines, hotels, restaurants, and tourism [12–15]. The overall image can be defined as one of the
customers’ characteristics regarding a product/service [16]. Similarly, Assael [17] also suggested
that the overall image refers to the overall recognition of a certain product/service formed based on
information obtained from various sources of the product/service. In other words, the overall image of a
product/service can be created based on its detailed attributes [18]. The overall image of a product/service
is considered a critical factor that affects the customers’ decision-making processes [12,19]. In addition,
the overall image plays an important role to improve corporate profits, so many companies are making
efforts to create a positive overall image [20,21].
      Many previous studies have explored the antecedents and consequences of the overall image in
diverse fields. For instance, Han, Kiatkawsin, and Kim [22] tried to examine how to form the overall
image and its effect on outcome variables using 325 samples in the hotel industry. They showed
that emotional experiences play an important role in the formation of the overall image. In addition,
they also suggested that the overall image has a positive influence on satisfaction. Sharma and
Nayak [23] developed a research model to find the antecedents and consequences of the overall image
based on the 398 samples in the tourism industry. Their data analysis results indicated that the overall
image is formed by cognitive and affective images. Furthermore, they revealed that the overall image
helps to enhance behavioral intentions.

2.2. Effect of Overall Image on Desire
     Next, this paper proposed the effect of the overall image on the desire. In the hospitality and
tourism industry, the concept of desire, which was derived from the model of the goal-directed behavior
(MGB), has been studied to identify consumer behavior, which can be defined as “a state of mind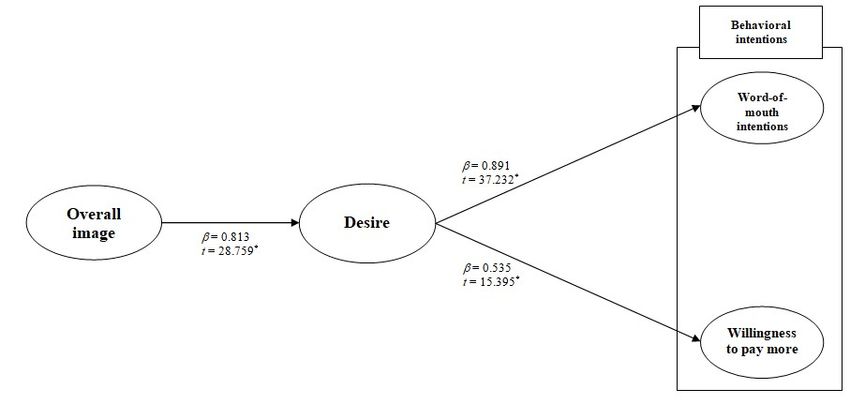
Int. J. Environ. Res. Public Health 2020, 17, 9117                                                    3 of 15

whereby an agent has a personal motivation to perform an action or to achieve a goal” [24] (p. 71).
The desire is a state that arises through an internal stimulus that triggers an action for a certain purpose,
which includes achievements, curiosity, and shortages [24,25].
      More importantly, one of the most significant factors with forming desire is the overall image
of a product/service [26], which means that when consumers have a favorable image of a certain
product/service, they would have a high level of desire. The empirical research also has supported the
relationship between the overall image and the desire. For instance, Hwang and Lyu [25] developed a
research model to find the relationship between the image and the desire using 320 samples in the
airline industry. Their data analysis results indicated that the image is a significant factor in forming
the desire. In addition, Han et al. [27] examined the relationship between the image and the desire
using 258 customers in the field of screen golf. They found the effect of the image on the desire and
suggested that when customers have a positive image of screen golf, they are more likely to use screen
golf. In addition, Han and Hyun [28] investigated how the overall image affects the desire based
on 286 passengers in the cruise industry. They showed that the overall image is an important factor
that affects desire. Integrating the theoretical and empirical backgrounds, the following hypothesis
was developed.

Hypothesis 1 (H1). The overall image has a positive influence on the desire.

2.3. The Effect of the Desire on the Behavioral Intentions
     The behavioral intentions refer to the likelihood that an individual will engage in a particular
behavior [29], and they consist of the following two concepts [30–32] that include (1) the word-of-mouth
intentions and (2) the willingness to pay more. First, the concept of word-of-mouth intentions can
be defined as “informal, person to person communication between a perceived non-commercial
communicator and a receiver regarding a brand, a product, an organization or a service” [33] (p. 63).
Consumers are more likely to rely on information from other people, which includes family members
and friends, more than commercial advertisements [34,35]. Second, the willingness to pay more is
defined as the maximum amount the consumers intend to pay for their preferred brand of products
compared to the other brands [36], so it is important to find out how to enhance the willingness to pay
more from the corporate point of view, which leads to an enhancement of the corporate profits [37,38].
     According to the MGB, when consumers try to engage in a certain behavior, they tend to show
high levels of behavioral intentions [39], which indicates that there is a positive relationship between
the desire and the behavioral intentions. The prior studies have also suggested the effect of the desire
on behavioral intentions. For example, Han et al. [40] examined the role of desire in the formation of
behavioral intentions in the field of medical hotels, and they suggested that desire positively affects
behavioral intentions. In addition, Hwang and Choe [41] also investigated the relationship between
desire and behavioral intentions. They found that desire is a key factor that affects behavioral intentions
in the field of drone food delivery services. More recently, Lee et al. [42] tried to investigate the
relationship between desire and behavioral intentions using 320 samples in the tourism industry.
They showed that desire aids to increase behavioral intentions. Based on the theoretical and empirical
backgrounds, the following hypotheses can be proposed.

Hypothesis 2 (H2). The desire has a positive influence on word-of-mouth intentions.

Hypothesis 3 (H3). Desire has a positive influence on the willingness to pay more.
Int. J. Environ. Res. Public Health 2020, 17, 9117 4 of 15
2.4. The Moderating Effect Before and After the Outbreak of COVID-19
After the outbreak of COVID-19, the consumers have been reluctant to have interactions with
others because of the infectious nature of COVID-19 [43], so they prefer contactless services [44].
This phenomenon also has had a great influence on the consumers’ perceptions of drone food delivery
services, because the services are provided without face-to-face contact with the consumers [5].
In addition, according to Bauer [45], the potential risk has a great impact on consumer behavior. In
other words, the consumers’ perceptions of drone food delivery services can be different according to
the perceived risks such as the outbreak of COVID-19.
Many prior studies have shown the significance of perceived risk in consumer behavior.
For example, Wells et al. [46] found that perceived risks negatively affect the relationship between
perceived novelty and attitude in the technology industry. In addition, Ahmed et al. [47] showed the
moderating role of perceived risk in the relationship between attitude and behavioral intentions in the
field of online shopping. Kim, Jang, and Kim [48] indicated that food technology neophobia plays an
important moderating role in the relationship between attitude and behavioral intentions.
In terms of before and after the outbreak of COVID-19, the empirical studies also examined the
changes in consumer behaviors in the foodservice industry. For instance, Long and Khoi [49] found
changes in the consumption patterns, which includes the hoarding of groceries by the consumers,
due to the risk of COVID-19, which is based on the theory of planned behavior (TPB). In addition,
Manivannan et al. [50] explained the importance and the growth of the online food delivery industry
as a result of the changes in the consumers’ buying behaviors after the outbreak of COVID-19. Jain [51]
also argued that an important change in consumer patterns in the restaurant industry was predicted
after the outbreak of COVID-19.
Drone food delivery services are considered as a representative case of contactless services [52,53].
In addition, Southey [4] suggested that the COVID-19 outbreak significantly affects consumer behavior
related to contactless food delivery services. McFarland [54] also argued that drones are an original
and efficient solution because the drones guarantee “zero human-contact” when delivering. As the
importance of contactless services increases, the consumers’ perceptions of drone food delivery services
can change before and after the outbreak of COVID-19, which means the moderating effect before and
after the outbreak of COVID-19.
Hypothesis 4 (H4a). The relationship between the overall image and the desire is significantly moderated by
the outbreak of COVID-19.
Hypothesis 4 (H4b). The relationship between the desire and the word-of-mouth intentions is significantly
moderated by the outbreak of COVID-19.
Hypothesis 4 (H4c). The relationship between the desire and the willingness to pay more is significantly
moderated by the outbreak of COVID-19.
Based on the theoretical relationships between the constructs, the following research model is
proposed (Figure 1).Hypothesis 4 (H4c). The relationship between the desire and the willingness to pay more is significantly
moderated by the outbreak of COVID-19.
Based on the theoretical relationships between the constructs, the following research model is
proposed (Figure
Int. J. Environ. 1). Health 2020, 17, 9117
Res. Public 5 of 15
Figure 1. The proposed conceptual model.
3. Methodology Figure 1. The proposed conceptual model.
3.1. Measures
To measure the five constructs, which include the overall image, the desire, the word-of-mouth
intentions, and the willingness to pay more, this study cited multi items that were proved to be reliable
and valid in the previous studies (see Appendix A). First, the overall image was measured using
three items that were adapted from Han et al. [12] and Jani and Han [55]. Second, the desire was
measured using three items that were used by Han and Yoon [56] and Perugini and Bagozzi [39].
Third, the measures for the word-of-mouth intentions were borrowed from Hennig-Thurau, Gwinner,
and Gremler [57]. Fourth, the willingness to pay more was measured using three items that were cited
from Han et al. [12]. A seven-point Likert scale that ranged from strongly disagree (1) to strongly agree
(7) was used to measure all the items in this study.
3.2. Data Collection
In this study, two surveys were conducted before and after the COVID-19 outbreak to identify the
moderating role of the outbreak of COVID-19. To collect data, this study employed the convenience
sampling technique using an online survey. First, the data collection before the COVID-19 outbreak
was collected for research other than the purpose of this study. In South Korea, drone food delivery
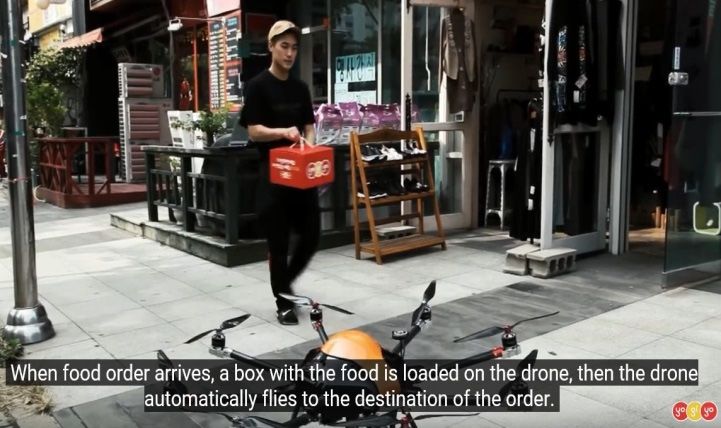
services have not been commercialized yet, so respondents were given about 2 min and 30 s of the
video to enhance their understanding of the services before the survey (see Appendix B). The video
explained the operation system of drone food delivery services well. In addition, the system was set
so that respondents can join the survey after watching the video. The first survey was based on the
survey system of EMBRAIN, which is one of the biggest market research companies in South Korea.
The company sent an e-mail invitation to 2794 perspective participants for three days in February 2018,
and 346 of them joined the survey. In addition, it is widely known that outliers can lead to wrong
statistical results [58,59], so 11 outliers were deleted after checking visual inspections and multivariate
outliers. Consequently, 335 samples were used for further statistical analysis.
Second, another data collection was conducted, which used the same data collection method as
the first data collection, and was performed after the outbreak of COVID-19 in South Korea. As with
the first data collection, respondents were shown the same video to enhance their understanding of
drone food delivery services before the survey. The online survey company sent 1479 emails over three
days in May 2020, and 343 of them completed the survey. As a result, 343 samples were employed for
further statistical analysis.Int. J. Environ. Res. Public Health 2020, 17, 9117 6 of 15
3.3. Profile of Survey Respondents
Table 1 shows the profile of the survey respondents. First, in regards to before the outbreak of
COVID-19, there were 194 males (57.9%) and 141 females (42.1%). In addition, 37.6% of the respondents
(n = 126) were in their 20 s, which was followed by 31.0% in their 30 s (n = 104). More than half of
the respondents were college graduates (n = 197 and 58.8%), and 56.7% of respondents were single
(n = 190). In regards to the income level, the highest percentage of the respondents earned between US
$2001 ~ US $3000 (n = 76, 22.7%).
Table 1. Profile of the survey respondents.
Before the Outbreak After the Outbreak of The Results of the Merging the Data
Variable
of COVID-19 (n = 335) COVID-19 (n = 343) Chi-Square Test (n = 678)
Gender
Male 194 (57.9%) 177 (51.6%) 371 (54.7%)
p = 0.058
Female 141 (42.1%) 166 (48.4%) 307 (45.3%)
Age
20 s 126 (37.6%) 103 (30%) 229 (33.8%)
30 s 104 (31%) 107 (31.2%) 211 (31.1%)
p = 0.037 *
40 s 70 (20.9%) 102 (29.2%) 172 (25.4%)
50 s 35 (10.4%) 31 (9%) 66 (9.7%)
Education level
Less than High
35 (10.4%) 30 (8.7%) 65 (9.6%)
school diploma
Associate’s degree 53 (15.8%) 43 (12.5%) p = 0.295 96 (14.2%)
Bachelor’s degree 197 (58.8%) 226 (65.9%) 423 (62.4%)
Graduate degree 50 (14.9%) 44 (12.8%) 94 (13.9%)
Marital status
Single 190 (56.7%) 198 (57.7%) 388 (57.2%)
Married 142 (42.4%) 141 (41.1%) p = 0.897 283 (41.7%)
Others 3 (0.9%) 4 (1.2%) 7 (1%)
Income level
6001$ US and over 60 (17.9%) 21 (6.1%) 81 (11.9%)
5001$ US–6000$ US 37 (11%) 10 (2.9%) 47 (6.9%)
4001$ US–5000$ US 51 (15.2%) 30 (8.7%) 81 (11.9%)
3001$ US–4000$ US 53 (15.8%) 49 (14.3%) p = 0.001 * 102 (15%)
2001$ US–3000$ US 76 (22.7%) 97 (28.3%) 173 (25.5%)
1001$ US–2000$ US 46 (13.7%) 67 (19.5%) 113 (16.7%)
Under 1000$ US 12 (3.6%) 69 (20.1%) 81 (11.9%)
Note: * p < 0.05.
Second, in regards to after the outbreak of COVID-19, there were 177 males (51.6%) and 166 females
(48.4%) that participated. Additionally, the largest age group included participants in their 30 s
(n = 107 and 31.2%), and more than half of the respondents (n = 226 and 65.9%) hold a bachelor’s
degree. In regards to the marital status, 198 (57.7%) of the participants were single. Lastly, the highest
percentage of the respondents earned between US $2001 ~ US $3000 (n = 97 and 28.3%).
3.4. Confirmatory Factor Analysis (CFA)
The CFA results of for the three models, which included before the outbreak of COVID-19, after the
outbreak of COVID-19, and merging the two, showed that the overall fit of the measurement model
was statistically adequate (Before the outbreak of COVID-19: χ2 = 131.590, df = 48, χ2 /df = 2.741,
p < 0.001, NFI = 0.979, CFI = 0.986, TLI = 0.981, and RMSEA = 0.072; After the outbreak of COVID-19:
χ2 = 14.589, df = 48, χ2 /df = 2.950, p < 0.001, NFI = 0.978, CFI = 0.985, TLI = 0.980, and RMSEA = 0.076;
and Merging before and after the outbreak of COVID-19: χ2 = 183.973, df = 48, χ2 /df = 3.833, p < 0.001,
NFI = 0.985, CFI = 0.989, TLI = 0.985, and RMSEA = 0.065) [60]. In addition, all of the factor loadings
were equal to or higher than 0.904 for before the outbreak of COVID-19, 0.936 for after the outbreak ofInt. J. Environ. Res. Public Health 2020, 17, 9117 7 of 15
COVID-19, and 0.930 for the merged version. Table 2 illustrates the specific variables employed in this
study along with their standardized factor loadings.
Table 2. The confirmatory factor analysis: Items and loadings.
Standardized Loading a
Before the After the Merging Before and
Construct and Scale Item Outbreak of Outbreak of After the Outbreak
COVID-19 COVID-19 of COVID-19
Overall image
The overall image of using drone food delivery
0.949 0.936 0.943
services is good.
The overall image I have about drone food
0.963 0.954 0.959
delivery services is great.
Overall, I have a good image about drone food
0.919 0.945 0.931
delivery services.
Desire
I desire to use drone food delivery services when
0.957 0.947 0.952
ordering food.
My desire to use drone food delivery services
0.963 0.961 0.962
when ordering food is strong.
I want to use drone food delivery services when
0.962 0.956 0.960
ordering food.
Word-of-mouth intentions
I am likely to say positive things about drone food
0.958 0.956 0.958
delivery services to others.
I am likely to recommend drone food delivery
0.904 0.959 0.930
services to others.
I am likely to encourage others to use drone food
0.962 0.964 0.961
delivery services.
Willingness to pay more
I am likely to pay more to use drone food
0.953 0.946 0.950
delivery services.
It is acceptable to pay more to use drone food
0.966 0.972 0.969
delivery services.
I am likely to spend extra to use drone food
0.973 0.968 0.971
delivery services.
Goodness-of-fit statistics
Before the outbreak of COVID-19: χ2 = 131.590, df = 48, χ2 /df = 2.741, p < 0.001, NFI = 0.979, CFI = 0.986,
TLI = 0.981, and RMSEA = 0.072
After the outbreak of COVID-19: χ2 = 14.589, df = 48, χ2 /df = 2.950, p < 0.001, NFI = 0.978, CFI = 0.985, TLI = 0.980,
and RMSEA = 0.076
Merging before and after the outbreak of COVID-19: χ2 = 183.973, df = 48, χ2 /df = 3.833, p < 0.001, NFI = 0.985,
CFI = 0.989, TLI = 0.985, and RMSEA = 0.065
Notes 1: a All factors loadings are significant at p < 0.001, Notes 2: NFI = normed fit index, IFI = incremental fit index,
CFI = comparative fit index, TLI = Tucker–Lewis index, and RMSEA = root mean square error of approximation.
As shown in Table 3, the values of all the average variance extracted (AVE) for the three models
exceeded 0.50, which supports that all the constructs used in this study had an acceptable convergent
validity [61]. In addition, the results revealed that the values of the composite reliabilities of all the
constructs for the three models are greater than 0.70, which means that all the constructs used in this
study had a satisfactory level of internal consistency [62]. Lastly, the results show that the values of
all the AVE for the three models exceeded all of the squared correlations (R2) between any pair of
constructs, which suggests that all the constructs for the three models had a high level of discriminant
validity [63].constructs, which suggests that all the constructs for the three models had a high level of discriminant
validity [63].
Table 3. The descriptive statistics and the associated measures.
Int. J. Environ. Res. Public Health 2020, 17, 9117
Mean
(Std dev.) AVE -1 -2 -3 -48 of 15
4.48 (1.30) 0.891 0.961 0.761 a 0.71 0.459
(1) Overall image 4.45 (1.35) 0.893 0.962
Table 3. The descriptive statistics and the associated measures.0.762 0.768 0.408
4.46 (1.32) 0.892 0.961 0.808 0.763 0.43
Mean (Std4.30
dev.)(1.48)AVE 0.924 (1) 0.579 b(2) 0.973 (3) 0.807 (4)
0.509
(2) Desire 4.48 (1.30)
4.15 (1.38)0.891 0.911 0.961 0.581 0.761 a 0.969 0.71 0.784 0.459
0.524
(1) Overall image 4.45 (1.35)
4.23 (1.43)0.893 0.918 0.962 0.6530.762 0.9710.7680.786 0.408
0.524
4.46 (1.32) 0.892 0.961 0.808 0.763 0.43
4.54 (1.43)0.924 0.887
4.30 (1.48) 0.579 b
0.5040.973 0.6510.8070.959 0.543
0.509
(2) (3) Word-of-mouth
Desire 4.18 (1.32)0.911 0.921
4.15 (1.38) 0.581 0.590.969 0.6150.7840.972 0.618
0.524
4.36 (1.39)
4.23 (1.43) 0.918 0.905
0.653 0.5820.971 0.6180.7860.966 0.576
0.524
4.54 (1.43)
3.22 (1.63) 0.887 0.504 0.2110.651 0.2590.9590.295
0.929 0.543
0.975
(3) Word-of-mouth 4.18 (1.32) 0.921 0.59 0.615 0.972 0.618
(4) Willingness to pay more 4.36 (1.39) 3.07 (1.50)0.905 0.926 0.582
0.1660.618 0.2740.9660.382 0.974
0.576
3.15 (1.56)0.929 0.928
3.22 (1.63) 0.211 0.1850.259 0.2750.2950.332 0.975
0.975
(4) Willingness
Notes to pay more
1: The unmarked 3.07for
values are (1.50)
before the 0.926
outbreak of0.166
COVID-19;0.274 0.382 values0.974
The underlined are
3.15 (1.56) 0.928 0.185 0.275 0.332 0.975
for after the outbreak of COVID-19, and Values in boldface type are for merging before and after the
Notes 1: The
outbreak unmarked values
of COVID-19. Notesare2:for before
AVE = the outbreak
Average of COVID-19;
Variance The underlined
Extracted, Notes 3: values
Shades.arecomposite
for after the
outbreak of COVID-19, and Values in boldface type are for merging before and after the outbreak of COVID-19.
reliabilities
Notes 2: AVEare along the
= Average diagonal,
Variance Notes
Extracted, 4. 3:. Shades.
Notes
a correlations are reliabilities
composite above theare diagonal
along theand
b . squared
diagonal, Notes 4.
a . correlations are above the diagonal and b . squared correlations are below the diagonal.
correlations are below the diagonal.
3.5.
3.5.Structural
StructuralEquation
EquationModeling
Modeling(SEM)
(SEM)
The
Theproposed
proposedhypotheses
hypotheseswere werechecked
checkedusing
usingan anSEM
SEManalysis.
analysis.The
Theoverall
overallevaluation
evaluationofofthe the
model
modelfitfitshowed
showedananacceptable
acceptablefitfitofofthe
themodel
model totothethedata
data = 240.461,
(χ2(χ=2240.461, = χ51,
df =df51, 2/dfχ2=/df = 4.715,
4.715, p<
p < 0.001,
0.001, NFI =NFI = 0.981,
0.981, CFI = CFI
0.985,= TLI
0.985, TLI =and
= 0.980, RMSEA
0.980, = 0.074).=Figure
and RMSEA 0.074).2 presents
Figure 2 the resultsthe
presents with the
results
standardized coefficients
with the standardized and their
coefficients andt-values. All three
their t-values. proposed
All three proposedhypotheses
hypotheses were
werestatistically
statistically
supportedatatp p< <
supported 0.05. More
0.05. Morespecifically, the the
specifically, overall image
overall has has
image a positive influence
a positive on the
influence ondesire (β =
the desire
(β = 0.813
0.813 and t and t = 28.759
= 28.759 *), so Hypothesis 1 was 1supported.
*), so Hypothesis In addition,
was supported. the desire
In addition, positively
the desire affectsaffects
positively both
the word-of-mouth
both (β = 0.891
the word-of-mouth = 0.891
(β and and t*)=and
t = 37.232 the *)
37.232 willingness to pay moreto(βpay
and the willingness = 0.535
more and(βt== 0.535
15.395and
*),
t = 15.395
which supported Hypotheses
*), which supported2 Hypotheses
and 3. 2 and 3.
Figure 2. The standardized theoretical path coefficients. Note: * p < 0.05.
Figure 2. The standardized theoretical path coefficients. Note: * p < 0.05
3.6. Measurement-Invariance Assessment
3.6. Measurement-Invariance Assessment
According to Steenkamp and Baumgartner [64], this study performed a measurement invariance
assessment before testing the moderating role of the outbreak of COVID-19. The samples were divided
into two groups, which included before the outbreak of COVID-19 (n = 335) and after the outbreak of
COVID-19 (n = 343). As presented in Table 4, the non-restricted model (χ2 = 273.179, df = 96, χ2 /df
= 2.845, p < 0.001, NFI = 0.978, CFI = 0.986, TLI = 0.980, and RMSEA = 0.052) and the full-metric
invariance model (χ2 = 279.758, df = 104, χ2 /df = 2.689, p < 0.001, NFI = 0.978, CFI = 0.986, TLI = 0.982,Int. J. Environ. Res. Public Health 2020, 17, 9117 9 of 15
and RMSEA = 0.050) had adequate fit statistics. In addition, the difference between the two models was
not significant (∆χ2 = 6.579 < χ2 = 0.01(df =15) = 20.090), which means that the full metric invariance
was statistically supported.
Table 4. The measurement-invariance models.
Full-Metric
Models χ2 df NFI CFI TLI RMSEA ∆χ2
Invariance
Before and Non-restricted
273.179 96 0.978 0.986 0.980 0.052
after the model ∆χ2 (8) = 6.579
outbreak of Full-metric p > 0.01 Supported
279.758 104 0.978 0.986 0.982 0.050 (insignificant)
COVID-19 invariance
Notes 1: NFI = Normed Fit Index, CFI = Comparative Fit Index, TLI = Tucker-Lewis Index, and RMSEA = Root
Mean Square Error of Approximation. Notes 2: ∆χ2 (8) = 20.09 and p > 0.01.
3.7. Moderating Role of the Outbreak of COVID-19
Table 5 presents the results of the moderating role of the outbreak of COVID-19. To test the
moderating role of the outbreak of COVID-19, multiple-group analyses were employed by comparing
the chi-square difference between the unconstrained models and the constrained models, which was
based on the difference in the degrees of freedom [60]. In multiple-group analyses, if the value of the
chi-square difference between the unconstrained models and the constrained models is higher than
3.84 (df = 1), it indicates that there is a moderating effect [60].
Table 5. The moderating role of the outbreak of COVID-19.
Unconstrained Model
Constrained
Before the Outbreak of After the Outbreak of Tests of Moderator
Model
Path COVID-19 COVID-19
∆χ2 (102) χ2
β t-Value β t-Value Hypotheses
= 320.396 difference
∆χ2 (103) ∆χ2 (103) Not
H4a OI → D 0.770 18.123 * 0.864 23.663 *
= 320.466 = 0.07 supported
∆χ2 (103) ∆χ2 (103)
H4b D → WOM 0.820 19.526 * 0.917 26.237 * Supported
= 326.145 = 5.749
∆χ2 (103) ∆χ2 (103) Not
H4c D → WPM 0.520 10.480 * 0.545 11.157 *
= 320.497 = 0.101 supported
Notes 1: OI = Overall Image, D = Desire, WOM = Word-of-mouth, and WPM = Willingness to pay more. Notes 2:
* p < 0.05 Notes 3: ∆ χ2 (1) = 3.84 and p < 0.05.
The data analysis results showed that the outbreak of COVID-19 moderated the relationship
between the desire and the word-of-mouth (∆χ2 = 5.749 > χ2 = 0.5(1) = 3.84, and df = 1), which supported
Hypothesis 4b because the value of chi-square difference between the unconstrained models and the
constrained models is greater than 3.84 (df = 1). More specifically, the path coefficient for the group
after the outbreak of COVID-19 (β = 0.917 and t = 26.237 *) was higher than the path coefficient for
the group before the outbreak of COVID-19 (β = 0.820 and t = 19.526 *). That is, after the outbreak of
COVID-19, consumers are more likely to say positive things about drone food delivery services to
others when they have high levels of desire than before the outbreak of COVID-19.
However, Hypotheses 4a (∆χ2 = 0.070 < χ2 = 0.5(1) = 3.84, and df = 1) and 4c (∆χ2 = 0.101 < χ2 =
0.5(1) = 3.84, and df = 1) were not statistically supported because the values of chi-square difference
between the unconstrained models and the constrained models are less than 3.84 (df = 1). In other
words, there is no moderating effect.Int. J. Environ. Res. Public Health 2020, 17, 9117 10 of 15
4. Discussion and Implications
First, the data analysis results showed that the overall image has a positive influence on the desire
(β = 0.813 and p < 0.05). It can be interpreted that when consumers perceived that the overall image
of using drone food delivery services is good, their desire to use the services is strong. The results
of this study are consistent with the prior studies [26,27], which suggested that the overall image
positively affects the desire. This study further extended the important role of the overall image with the
formation of the desire in the field of drone food delivery services. The results also have the following
managerial implications. It is widely known that the overall image of a certain product is formed by
its detailed attributes [18]. In this respect, it is recommended to emphasize the innovative roles and the
eco-friendly roles of drone food delivery services. For example, drone food delivery services have
the advantage of being able to quickly deliver food that is ordered by the customers regardless of the
time and the location, because drones move in the air [5]. In addition, unlike motorcycles and cars,
drone food delivery services are operated by batteries, which help to protect the environment [19].
Therefore, if restaurant companies emphasize the impressive features of drone food delivery services,
the consumers would have a good image of the services.
Second, the results of the data analysis indicated that the desire positively affects the two
dimensions of behavioral intentions, which include the word-of-mouth intentions (β = 0.891 and
p < 0.05) and the willingness to pay more (β = 0.535 and p < 0.05). This means that when the consumers’
desire to use drone food delivery services when ordering food is strong, they are more likely to
recommend the services to others or pay more for the services. Many prior studies have consistently
shown the importance of desire [26–28]. In this regard, this confirmed the significant role of the desire
in the field of drone food delivery services, which is considered a significant theoretical implication of
this study.
Lastly, this study found the moderating role of the outbreak of COVID-19 in the relationship
between the desire and the word-of-mouth intentions, so hypothesis 4c was supported. More specifically,
the path coefficient between the desire and the word-of-mouth intentions for the group after the
outbreak of COVID-19 (β = 0.917) was greater than the path coefficient between the desire and the
word-of-mouth intentions for the group before the outbreak of COVID-19 (β = 0.820). The data
analysis result can be interpreted that after the outbreak of COVID-19, people are more likely to
recommend drone food delivery services to others when they have high levels of desire to use the
services than before the outbreak of COVID-19. The results of this study are due to the following
reasons. After the outbreak of COVID-19, people tend to prefer contactless services to reduce the risk
of infection [52]. As previously explained, drone food delivery services are considered representative
contactless services, so people are more inclined to mention the advantages of the services to others
after the outbreak of COVID-19. Therefore, if restaurant companies emphasize the role of drone food
delivery service as contactless services after the outbreak of COVID-19 through advertisements, people
would have high word-of-mouth intentions for the services.
5. Limitations and Future Research
The current study has significant theoretical and practical implications, which were mentioned
above. However, this study also has the following limitations. First, since the data for this study was
collected in South Korea, it is difficult to apply the findings of this study to other regions. Second,
even though the delivery services that use drones are used not only in the foodservice industry but
also in other industries, the results of this study focused only on the foodservice industry. Therefore,
it is necessary to increase the external validity by applying the research model proposed in this study
to other industries in future studies. Third, drone food delivery services are not presently activated
in South Korea. Therefore, it is recommended to research the customers who have used drone food
delivery services in future research. Forth, the current study attempted to find the moderating role of
the COVID-19 outbreak. For this reason, the samples are collected at different time periods, which can
lead to a bias in the results. Thus, future research needs to collect data at the same time after COVID-19Int. J. Environ. Res. Public Health 2020, 17, 9117 11 of 15
ends. Lastly, nowadays, drone food delivery services are in the text phase, but the services will be
activated worldwide in due course. For this reason, governments around the world are working on
regulations for utilizing drones in our lives [65,66]. That is, although there are currently no legal
requirements for droned food delivery services, there will be formal legal processes, such as operation
and licensing in the future.
6. Conclusions
The objective of the current study was to identify how to form behavioral intentions in the field of
drone food delivery services. More specifically, this study proposed the effects of the overall image on
the desire. In addition, it was hypothesized that the desire helps to enhance the two dimensions of
the behavioral intentions, which include word-of-mouth intentions and the willingness to pay more.
Lastly, the moderating role of the COVID-19 outbreak was proposed in this process. To evaluate the
six hypotheses, this study collected data from 335 samples before the outbreak of COVID-19 and
343 samples after the outbreak of COVID-19 in South Korea. The results of the data analysis have the
important theoretical and managerial implications the development of drone food delivery services
after the COVID-19 outbreak.
Author Contributions: All the authors including J.H., D.K., and J.J.K. contributed to the conceptualization, formal
analysis, investigation, methodology, writing of the original draft, and writing review and editing. All authors
have read and agreed to the published version of the manuscript.
Funding: This work was supported by Leaders in Industry-university Cooperation + (LINC+), Sejong
University, Korea.
Conflicts of Interest: The authors declare no conflict of interest.
Appendix A The Questionnaire
1. Please read each item carefully and circle the appropriate number which best reflects your true
opinions or feelings.
Overall Image Strongly Disagree → Neutral → Strongly Agree
The overall image of using drone
1 2 3 4 5 6 7
food delivery services is good.
The overall image I have about
1 2 3 4 5 6 7
drone food delivery services is great.
Overall, I have a good image about
1 2 3 4 5 6 7
drone food delivery services.
2. Please read each item carefully and circle the appropriate number which best reflects your true
opinions or feelings.
Desire Strongly Disagree → Neutral → Strongly Agree
I desire to use drone food delivery
1 2 3 4 5 6 7
services when ordering food.
My desire to use drone food delivery
services when ordering food 1 2 3 4 5 6 7
is strong.
I want to use drone food delivery
1 2 3 4 5 6 7
services when ordering food.Int. J. Environ. Res. Public Health 2020, 17, 9117 12 of 15
3. Please read each item carefully and circle the appropriate number which best reflects your true
opinions or feelings.
Int. J. Environ. Res. Public Health 2020, 17, x 12 of 15
Word-of-Mouth Intentions Strongly Disagree → Neutral → Strongly Agree
3. Please read each item carefully and circle the appropriate number which best reflects your true
I am likely to say positive things
opinions or feelings.
about drone food delivery services 1 2 3 4 5 6 7
to others.
Strongly Strongly
Word-of-Mouth
I am likely to recommend drone food Intentions → Neutral →
1 2 3 Disagree4 5 6 Agree
7
Idelivery
am likelyservices
to say to others. things about drone food delivery
positive
1 2 3 4 5 6 7
services to others.
I am likely to encourage others to
1 2 3 4 5 6 7
Iuse
am drone
likelyfood
to recommend drone food delivery services to
delivery services.
1 2 3 4 5 6 7
others.
I am 4.
likely to encourage
Please read eachothers
item to use drone
carefully food
and delivery
circle the appropriate number which4best reflects your true
1 2 3 5 6 7
services.
opinions or feelings.
4. Willingness
Please read each
to Pay item carefully
More and circle
Strongly the appropriate
Disagree → number which
Neutral → best reflects your
Strongly true
Agree
opinions or feelings.
I am likely to pay more to use
1 2 3 4 5 6 7
drone food delivery services.
Strongly Strongly
Willingness
It is acceptable to pay more to useto Pay More → Neutral →
1 2 3 Disagree
4 5 6 Agree
7
drone food delivery services.
I am likely to pay more to use drone food delivery services. 1 2 3 4 5 6 7
ItI am likely to spend
is acceptable extra
to pay in order
more to use drone
1 food delivery
2 3
to use drone food delivery services. 14 2 53 4 6 5 6 77
services.
I am likely to spend extra in order to use drone food
1 2 3 4 5 6 7
delivery services.
Appendix B
Appendix B
Figure
FigureA1.
A1.Screenshot
Screenshotfrom
fromVideos
Videos(Source:
(Source:Yogiyo
Yogiyo[67]).
[67]).
References
References
1.1. World Health
World HealthOrganization.
Organization.Coronavirus Disease
“Coronavirus (COVID-19)
Disease Pandemic.
(COVID-19) Available online:
Pandemic”. https://www.
Available online:
who.int/emergencies/diseases/novel-coronavirus-2019 (accessed on (accessed
https://www.who.int/emergencies/diseases/novel-coronavirus-2019 1 October on
2020).
1 October 2020).
2.2. Worldometers. COVID-19
Worldometers. CoronavirusCoronavirus
COVID-19 Pandemic. Available online: https://www.worldometers.info/
Pandemic. Available online:
coronavirus/ (accessed on 1 October 2020). (accessed on 1 October 2020).
https://www.worldometers.info/coronavirus/
3.3. National Restaurant
National Restaurant Association.
Association.The“The
Restaurant Industry
Restaurant Impact Survey.
Industry Impact Available
Survey”. online: https://www.
Available online:
restaurant.org/manage-my-restaurant/business-operations/covid19/research/industry-research
https://www.restaurant.org/manage-my-restaurant/business-operations/covid19/research/industry- (accessed on
1 April 2020).
research (accessed on 1 April 2020).
4.4. Southey,F.F.Online
Southey, OnlineFood
Food Delivery
Delivery ‘One
‘One of Only
of the the Only Winners’
Winners’ in Coronavirus
in Coronavirus Outbreak.
Outbreak. AvailableAvailable
online:
online: https://www.foodnavigator.com/Article/2020/03/19/Online-food-delivery-one-of-the-only-winners-
https://www.foodnavigator.com/Article/2020/03/19/Online-food-delivery-one-of-the-only-winners-in-
in-coronavirus-outbreak
coronavirus-outbreak (accessed
(accessed on 1on 1 October
October 2020).
2020).
5. Hwang, J.; Lee, J.S.; Kim, H. Perceived innovativeness of drone food delivery services and its impacts on
attitude and behavioral intentions: The moderating role of gender and age. Int. J. Hosp. Manag. 2019, 81, 94–
103.
6. Environmental Technology. How does drone delivery impact the environment? Available online: delivery-
impact-the-environment/46595https://www.envirotech-online.com/news/environmental-Int. J. Environ. Res. Public Health 2020, 17, 9117 13 of 15
5. Hwang, J.; Lee, J.S.; Kim, H. Perceived innovativeness of drone food delivery services and its impacts on
attitude and behavioral intentions: The moderating role of gender and age. Int. J. Hosp. Manag. 2019, 81,
94–103. [CrossRef]
6. Environmental Technology. How does drone delivery impact the environment? Available
online: delivery-impact-the-environment/46595https://www.envirotech-online.com/news/environmental-
laboratory/7/breaking-news/how-does-drone- (accessed on 1 October 2020).
7. Campbell, J.F.; Sweeney, D.; Zhang, J. Strategic design for delivery with trucks and drones. Available
online: https://www.researchgate.net/publication/316169890_Strategic_Design_for_Delivery_with_Trucks_
and_Drones (accessed on 1 October 2020).
8. Koiwanit, J. Analysis of environmental impacts of drone delivery on an online shopping system. Adv. Clim.
Chang. Res. 2018, 9, 201–207. [CrossRef]
9. Yoo, W.; Yu, E.; Jung, J. Drone delivery: Factors affecting the public’s attitude and intention to adopt. Telemat.
Inform. 2018, 35, 1687–1700. [CrossRef]
10. Food and Wine. Uber Will Test Food Delivery by Drone. Available online: https://www.foodandwine.com/
news/uber-food-drone-food-delivery-san-diego (accessed on 1 November 2018).
11. Business Insider. Uber May Start Delivering Burgers by Drones as soon as 2021 because Its CEO Says
We Need Flying Burgers. Available online: https://www.businessinsider.com/uber-planning-drone-food-
delivery-2021-2018-10 (accessed on 1 November 2018).
12. Han, H.; Hsu, L.T.J.; Lee, J.S. Empirical investigation of the roles of attitudes toward green behaviors, overall
image, gender, and age in hotel customers’ eco-friendly decision-making process. Int. J. Hosp. Manag. 2009,
28, 519–528. [CrossRef]
13. Hwang, J.; Choi, J.K. An investigation of passengers’ psychological benefits from green brands in an
environmentally friendly airline context: The moderating role of gender. Sustainability 2018, 10, 80.
[CrossRef]
14. Park, S.H.; Hsieh, C.M.; Lee, C.K. Examining Chinese college students’ intention to travel to Japan using the
extended theory of planned behavior: Testing destination image and the mediating role of travel constraints.
J. Travel Tour. Mark. 2017, 34, 113–131. [CrossRef]
15. Ryu, K.; Han, H.; Kim, T.H. The relationships among overall quick-casual restaurant image, perceived value,
customer satisfaction, and behavioral intentions. Int. J. Hosp. Manag. 2008, 27, 459–469. [CrossRef]
16. Kotler, P. A Framework for Marketing Management; Prentice-Hall: Upper Saddle River, NJ, USA, 2001.
17. Assael, H. Customer Behavior and Marketing Action; Kent: Boston, MA, USA, 1984.
18. Bloemer, J.; de Ruyter, K. On the relationship between store image, store satisfaction and store loyalty.
Eur. J. Mark. 1998, 32, 499–513. [CrossRef]
19. Hwang, J.; Kim, H. Consequences of a green image of drone food delivery services: The moderating role of
gender and age. Bus. Strategy Environ. 2019, 28, 872–884. [CrossRef]
20. Famiyeh, S. Corporate social responsibility and firm’s performance: Empirical evidence. Soc. Responsib. J.
2017, 13, 390–406. [CrossRef]
21. Zameer, H.; Tara, A.; Kausar, U.; Mohsin, A. Impact of service quality, corporate image and customer
satisfaction towards customers’ perceived value in the banking sector in Pakistan. Int. J. Bank Mark. 2015, 33,
442–456. [CrossRef]
22. Han, H.; Kiatkawsin, K.; Kim, W. Traveler loyalty and its antecedents in the hotel industry. Int. J. Contemp.
Hosp. Manag. 2019, 31, 474–495. [CrossRef]
23. Sharma, P.; Nayak, J.K. Do tourists’ emotional experiences influence images and intentions in yoga tourism?
Tour. Rev. 2019, 74, 646–665. [CrossRef]
24. Perugini, M.; Bagozzi, R.P. The distinction between desires and intentions. Eur. J. Soc. Psychol. 2004, 34,
69–84. [CrossRef]
25. Hwang, J.; Lyu, S.O. Relationships among green image, consumer attitudes, desire, and customer citizenship
behavior in the airline industry. Int. J. Sustain. Transp. 2020, 14, 437–447. [CrossRef]
26. Hudson, S.; Wang, Y.; Gil, S.M. The influence of a film on destination image and the desire to travel:
A cross-cultural comparison. Int. J. Tour. Res. 2011, 13, 177–190. [CrossRef]
27. Han, H.; Baek, H.; Lee, K.; Huh, B. Perceived benefits, attitude, image, desire, and intention in virtual golf
leisure. J. Hosp. Mark. Manag. 2014, 23, 465–486. [CrossRef]Int. J. Environ. Res. Public Health 2020, 17, 9117 14 of 15
28. Han, H.; Hyun, S.S. Cruise travel motivations and repeat cruising behaviour: Impact of relationship
investment. Curr. Issues Tour. 2019, 22, 786–805. [CrossRef]
29. Ajzen, H.; Fishbein, M. Understanding Attitudes and Predicting Social Behavior; Prentice Hall: Englewood Cliffs,
NJ, USA, 1980.
30. Gilal, F.G.; Zhang, J.; Gilal, N.G.; Gilal, R.G. Integrating self-determined needs into the relationship among
product design, willingness-to-pay a premium, and word-of-mouth: A cross-cultural gender-specific study.
Psychol. Res. Behav. Manag. 2018, 11, 227. [CrossRef]
31. Hwang, J.; Park, S.; Kim, I. Understanding motivated consumer innovativeness in the context of a robotic
restaurant: The moderating role of product knowledge. J. Hosp. Tour. Manag. 2020, 44, 272–282. [CrossRef]
32. Hwang, J.; Choe, J.Y.J.; Kim, J.J. Strategy for enhancing the image of edible insect restaurants: Focus on
internal environmental locus of control. J. Hosp. Tour. Manag. 2020, 45, 48–57. [CrossRef]
33. Harrison-Walker, L.J. E-complaining: A content analysis of an internet complaint forum. J. Serv. Mark. 2001,
15, 397–412. [CrossRef]
34. Kotler, P.; Bowen, J.T.; Makens, J.C. Marketing for Hospitality and Tourism, 4th ed.; Pearson Education: Cranbury,
NJ, USA, 2005.
35. Yi, Y.; Gong, T. The effects of customer justice perception and affect on customer citizenship behavior and
customer dysfunctional behavior. Ind. Mark. Manag. 2008, 37, 767–783. [CrossRef]
36. Netemeyer, R.G.; Krishnan, B.; Pullig, C.; Wang, G.; Yagci, M.; Dean, D.; Ricks, J.; Wirth, F. Developing and
validating measures of facets of customer-based brand equity. J. Bus. Res. 2004, 57, 209–224. [CrossRef]
37. Homburg, C.; Koschate, N.; Hoyer, W.D. Do satisfied customers really pay more? A study of the relationship
between customer satisfaction and willingness to pay. J. Mark. 2005, 69, 84–96. [CrossRef]
38. Hwang, J.; Hyun, S.S. First-class airline travelers’ tendency to seek uniqueness: How does it influence their
purchase of expensive tickets? J. Travel Tour. Mark. 2017, 34, 935–947. [CrossRef]
39. Perugini, M.; Bagozzi, R.P. The role of desires and anticipated emotions in goal-directed behaviours:
Broadening and deepening the theory of planned behaviour. Br. J. Soc. Psychol. 2001, 40, 79–98. [CrossRef]
40. Han, H.; Kim, Y.; Kim, C.; Ham, S. Medical hotels in the growing healthcare business industry: Impact of
international travelers’ perceived outcomes. J. Bus. Res. 2015, 68, 1869–1877. [CrossRef]
41. Hwang, J.; Choe, J.Y.J. Exploring perceived risk in building successful drone food delivery services.
Int. J. Contemp. Hosp. Manag. 2019, 31, 3249–3269. [CrossRef]
42. Lee, C.K.; Ahmad, M.S.; Petrick, J.F.; Park, Y.N.; Park, E.; Kang, C.W. The roles of cultural worldview
and authenticity in tourists’ decision-making process in a heritage tourism destination using a model of
goal-directed behavior. J. Destin. Mark. Manag. 2020, 18, 100500. [CrossRef]
43. Djalante, R.; Lassa, J.; Setiamarga, D.; Mahfud, C.; Sudjatma, A.; Indrawan, M.; Haryanto, B.; Sinapoy, M.S.;
Rafliana, I.; Djalante, S.; et al. Review and analysis of current responses to COVID-19 in Indonesia: Period of
January to March 2020. Prog. Dis. Sci. 2020, 100091. [CrossRef]
44. Chandler, S. Coronavirus Delivers ‘World’s First’ Drone Delivery Service. Forbes. Available
online: https://www.forbes.com/sites/simonchandler/2020/04/03/coronavirus-delivers-worlds-first-drone-
delivery-service/#b8cd02549579 (accessed on 1 October 2020).
45. Bauer, R.A. Consumer behavior as risk taking. In Risk Taking and Information Handling in Consumer Behavior;
Cox, D., Ed.; Harvard University Press: Cambridge, MA, USA, 1960; pp. 389–398.
46. Wells, J.D.; Campbell, D.E.; Valacich, J.S.; Featherman, M. The effect of perceived novelty on the adoption of
information technology innovations: A risk/reward perspective. Decis. Sci. 2010, 41, 813–843. [CrossRef]
47. Ahmed, A.; Rehman, U.; Rizwan, M.; Rafiq, M.Q.; Nawaz, M.; Mumtaz, A. Moderating role of perceived risk
and innovativeness between online shopping attitude and intention. J. Basic Appl. Sci. Res. 2013, 3, 310–323.
48. Kim, Y.G.; Jang, S.Y.; Kim, A.K. Application of the theory of planned behavior to genetically modified foods:
Moderating effects of food technology neophobia. Food Res. Int. 2014, 62, 947–954. [CrossRef]
49. Long, N.N.; Khoi, B.H. An Empirical Study about the Intention to Hoard Food during COVID-19 Pandemic.
EURASIA J. Math. Sci. Technol. Educ. 2020, 16, em1857.
50. Manivannan, P.; Kesavan, D.; Anuradha, M.R.; Vetrivel, V. Impact of COVID 19 on online food delivery
industry with reference to operational and revenue parameters. UGC CARE J. 2020, 31, 142–152.
51. Jain, D. Effect of COVID-19 on Restaurant industry–How to Cope with Changing Demand. Available online:
https://papers.ssrn.com/sol3/papers.cfm?abstract_id=3577764 (accessed on 1 October 2020).Int. J. Environ. Res. Public Health 2020, 17, 9117 15 of 15
52. Research and Markets. 5 Ways Drones Can Help in a Pandemic. Available online:
https://www.researchandmarkets.com/issues/covid-19-drones?utm_medium=GNOM&utm_source=
covid19&utm_campaign=gnuav00 (accessed on 7 April 2020).
53. Zeng, Z.; Chen, P.J.; Lew, A.A. From high-touch to high-tech: COVID-19 drives robotics adoption. Tour. Geogr.
2020, 22, 724–734. [CrossRef]
54. McFarland, M. Why Robots Aren’t Delivering Your Groceries during the pandemic. CNN Business.
Available online: https://edition.cnn.com/2020/04/30/tech/robots-covid-19-deliveries/index.html (accessed on
1 October 2020).
55. Jani, D.; Han, H. Personality, satisfaction, image, ambience, and loyalty: Testing their relationships in the
hotel industry. Int. J. Hosp. Manag. 2014, 37, 11–20. [CrossRef]
56. Han, H.; Yoon, H.J. Hotel customers’ environmentally responsible behavioral intention: Impact of key
constructs on decision in green consumerism. Int. J. Hosp. Manag. 2015, 45, 22–33. [CrossRef]
57. Hennig-Thurau, T.; Gwinner, K.P.; Gremler, D.D. Understanding relationship marketing outcomes:
An integration of relational benefits and relationship quality. J. Serv. Res. 2002, 4, 230–247. [CrossRef]
58. Agresti, A.; Finlay, B. Statistical Methods for the Social Sciences, 4th ed.; Pearson Prentice Hall: Upper Saddle
River, NJ, USA, 2009.
59. Barnett, V.; Lewis, T. Outliers in Statistical Data, 3rd ed.; Wiley: Chichester, UK, 1994.
60. Byrne, B.M. Structural equation modeling: Perspectives on the present and the future. Int. J. Test. 2001, 1,
327–334.
61. Fornell, C.; Larcker, D.F. Structural equation models with unobservable variables and measurement error:
Algebra and statistics. J. Mark. Res. 1981, 18, 382–388. [CrossRef]
62. Hair Jr, J.F.; Hult, G.T.M.; Ringle, C.; Sarstedt, M. A Primer on Partial Least Squares Structural Equation Modeling
(PLS-SEM); Sage Publications: Thousand Oaks, CA, USA, 2016.
63. Bagozzi, R.P.; Yi, Y. On the evaluation of structural equation models. J. Acad. Mark. Sci. 1988, 16, 74–94.
[CrossRef]
64. Steenkamp, J.B.E.; Baumgartner, H. Assessing measurement invariance in cross-national consumer research.
J. Consum. Res. 1998, 25, 78–90. [CrossRef]
65. CNET. Manna’s 5G Drone Delivery Deal Will Help You Track Your Airborne Pizza. Available online: https:
//www.cnet.com/news/manna-5g-drone-delivery-deal-will-help-you-track-your-airborne-pizza (accessed
on 1 October 2020).
66. Forbes. Food Delivery via Drones May Be Closer than You Think. Available
online: https://www.forbes.com/sites/aliciakelso/2019/07/12/food-delivery-via-drones-may-be-closer-than-
you-think/#115fbe217438 (accessed on 1 March 2019).
67. Yogiyo. Korea’s Very First Official Drone Food Delivery Test. Available online: https://www.youtube.com/
watch?v=-BxAqGSgs1Y (accessed on 1 November 2018).
Publisher’s Note: MDPI stays neutral with regard to jurisdictional claims in published maps and institutional
affiliations.
© 2020 by the authors. Licensee MDPI, Basel, Switzerland. This article is an open access
article distributed under the terms and conditions of the Creative Commons Attribution
(CC BY) license (http://creativecommons.org/licenses/by/4.0/).You can also read