Predicting thermoelectric properties from chemical formula with explicitly identifying dopant effects
←
→
Page content transcription
If your browser does not render page correctly, please read the page content below
www.nature.com/npjcompumats

                  ARTICLE                 OPEN

                  Predicting thermoelectric properties from chemical formula
                  with explicitly identifying dopant effects
                                     1✉
                  Gyoung S. Na            , Seunghun Jang1 and Hyunju Chang                 1

                      Dopants play an important role in synthesizing materials to improve target materials properties or stabilize the materials. In
                      particular, the dopants are essential to improve thermoelectic performances of the materials. However, existing machine learning
                      methods cannot accurately predict the materials properties of doped materials due to severely nonlinear relations with their
                      materials properties. Here, we propose a unified architecture of neural networks, called DopNet, to accurately predict the materials
                      properties of the doped materials. DopNet identifies the effects of the dopants by explicitly and independently embedding the host
                      materials and the dopants. In our evaluations, DopNet outperformed existing machine learning methods in predicting
                      experimentally measured thermoelectric properties, and the error of DopNet in predicting a figure of merit (ZT) was 0.06 in mean
                      absolute error. In particular, DopNet was significantly effective in an extrapolation problem that predicts ZTs of unknown materials,
                      which is a key task to discover novel thermoelectric materials.
                      npj Computational Materials (2021)7:106 ; https://doi.org/10.1038/s41524-021-00564-y
1234567890():,;

                  INTRODUCTION                                                                           learning has been successfully applied to various scientific applica-
                  In physical science, various calculation methods to predict                            tions in physical science, existing machine learning methods are not
                  materials properties have been developed because the materials                         effective to predict the materials properties of the doped materials.
                  properties determine applications of materials1–3. However,                            There are three problems in predicting materials properties of the
                  extensive computation costs of the calculation methods fre-                            doped materials based on machine learning:
                  quently limit the applicability of them in practical applications4,5.                  ●    Lack of information: the crystal structures of the doped
                  In particular, the conventional calculation methods are not
                                                                                                              materials are not available in most cases because impractical
                  applicable to the doped materials due to impractical computation
                                                                                                              computation costs are required to calculate the crystal
                  costs caused by large cells of the doped materials6. For this reason,
                                                                                                              structures of the doped materials.
                  most experiments to discover novel materials of desired thermo-                        ●    Dopant effect vanishing: the chemical formula-based materi-
                  electric properties have been conducted relying on the intuition of
                                                                                                              als representations cannot precisely describe the effects of the
                  domain experts.                                                                             dopants in the doped materials because numerical changes
                     With the rapidly growing public materials databases, machine                             by the dopants are tiny in the materials representations due to
                  learning began to be studied widely in physical science to                                  small proportions of the dopants.
                  efficiently predict the materials properties7–9. In the early stage                     ●    Severely nonlinear relations: relations between the doped
                  of materials machine learning, the materials were described as                              materials and their materials properties are severely nonlinear
                  vector-shaped representations based on global characteristics of                            because the dopants sometimes dramatically change the
                  the materials or statistical information from atomic attributes.                            materials properties of the host materials.
                  Then, conventional machine learning methods (e.g., Gaussian
                  process regression10) were applied to predict materials proper-                        Therefore, to accurately predict the materials properties of the
                  ties based on these vector-shaped representations7,11. Recently,                       doped materials, we need a machine learning method to
                  advanced machine learning methods that explore structural                              effectively approximate severely nonlinear functions from the
                  information of input data, as well as input features, have been                        chemical formulas with identifying the dopant effects.
                  studied in physical science to fully utilize structural information                       In this paper, we propose a unified architecture of neural
                  from the crystal structures. In particular, graph neural networks                      networks, called DopNet, to accurately predict the materials
                  (GNNs)12 have been successfully applied to various scientific                           properties of the doped materials. DopNet utilizes the chemical
                  applications of physical science because the crystal structure is                      formula of the materials to predict materials properties without
                  natively represented as a mathematical graph. In various                               the crystal structures. To overcome the problems from the dopant
                  chemical and physical applications, GNNs have achieved state-                          effect vanishing and severely nonlinear relations, DopNet explicitly
                  of-the-art performances beyond the conventional machine                                describes the host materials and the dopants. In Discussion
                  learning methods8,13,14.                                                               Section, we will show that the doped materials can be clearly
                     Predicting the materials properties of the doped materials is the                   identified according to their materials properties by explicitly
                  next challenge of machine learning in physical science. The doped                      embedding the host materials and the dopants. Another benefit
                  materials are popular in real-world applications due to their superior                 of DopNet is that it does not require additional information about
                  performances and stability15–17. In particular, the doped materials are                the materials other than the chemical formulas of them. Hence,
                  dominant in the thermoelectric materials due to their superior                         DopNet can be universally applied to both experimental and
                  thermoelectric performances18,19. However, although machine                            calculation materials databases.

                  Korea Research Institute of Chemical Technology, Daejeon, South Korea. ✉email: ngs0@krict.re.kr
                  1

                  Published in partnership with the Shanghai Institute of Ceramics of the Chinese Academy of Sciences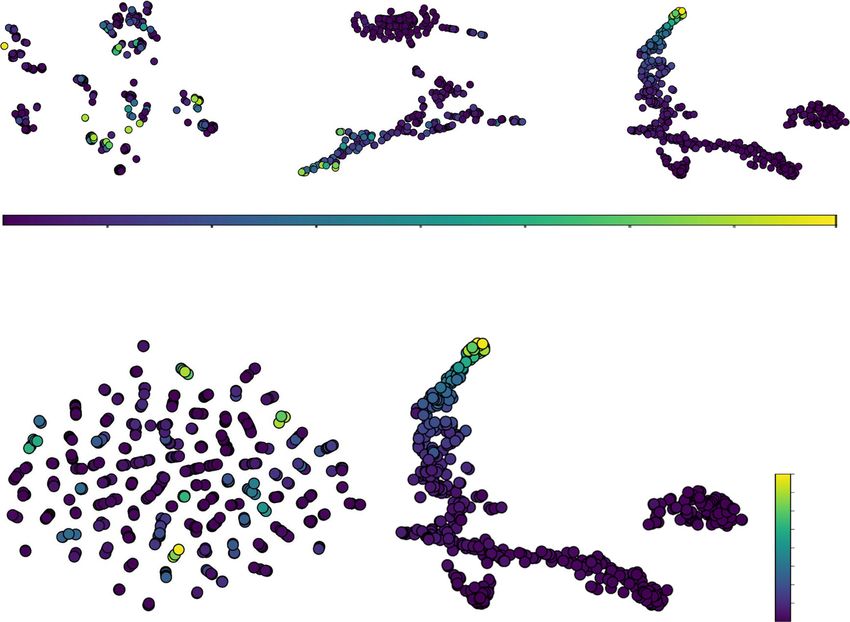
G.S. Na et al.
2
a Fluctuations of ZTs in local areas of materials space b Distribution of thermoelectric materials and their
proportional to ZTs. ZTs at 700 K in real-word dataset.
(1) Mg Si . Ge . Bi . (0.82)
Figure of merit (ZT)
(2) Mg Si . Ge . Ag . (0.19)
(d)
(c) (e)
(a) (2) Zr . Hf . NiSn (0.55)
Local relation of Zr . Hf . NiSn . Sb . (1.34)
(b) Zr . Hf . NiSn Sb (1)
Zr . Hf . Ti . NiSn (1.02)
Local relation of Mg Si Bi
Materials space 0.2 0.4 0.6 0.8 1.0 1.2 1.4 1.6
Fig. 1 Mixed distribution of thermoelectirc materials and their ZTs. a Conceptual materials space proportional to ZT at 700 K. Five example
doped materials denoted by (a)–(e) are presented to describe severely nonlinear relations between the doped materials and ZT. (a)
Mg2Si0.9985Bi0.0015 (ZT = 0.64); (b) Mg2Si0.999Bi0.001 (ZT = 0.32); (c) Zr0.5Hf0.5NiSn (ZT = 0.54). (d) Zr0.5Hf0.5NiSn1.9998Sb0.002 (ZT = 1.45); (e)
Zr0.5Hf0.5NiSn1.9994Sb0.006 (ZT = 1.34). b Distribution of doped materials and their ZTs at 700 K in real-world dataset26. Each point indicate a
material, and they were visualized in 2-dimensional space by t-SNE27. For the five example material, ZTs at 700 K are presented in parentheses.
In our evaluations on a real-world materials dataset, DopNet the same region despite their completely different ZTs. That is,
achieved state-of-the-art accuracies in predicting experimentally the effect of the dopants Bi0.02 and Ag0.02 are not identified. The
measured thermoelectric properties of 573 different materials and similar problem was observed in the example materials
conditions. Specifically, the prediction error of DopNet in Zr0.5Hf0.5NiSn, Zr0.5Hf0.5NiSn1.994Sb0.006, and Zr0.15Hf0.15Ti0.7NiSn.
predicting a figure of merit (ZT) was 0.06 in mean absolute error In the next section, we propose a neural network for the
(MAE). In particular, DopNet was significantly more effective than accurate prediction of thermoelectric properties by explicitly
1234567890():,;
the most popular gradient boosting tree regression (GBTR)20 in identifying the dopant effects in the doped materials.
predicting ZTs of completely unseen materials. The errors of GBTR
and DopNet in predicting ZTs of these unseen materials were 0.41 Architecture of DopNet
and 0.13, respectively, and the performance improvement by
In the existing machine learning methods, to predict materials
DopNet is 68.29%. The significant improvement of DopNet in this
properties from the chemical formulas, the materials are
extrapolation problem is noteworthy because an accurate
represented based on the statistical information from the
prediction for unseen materials is a key task of inverse design.
elemental attributes of the atoms in the materials regardless of
Although we focused on the prediction of the thermoelectric
identifying the dopants7,11. However, the atoms in the host
properties in this paper, DopNet can be generally applied to
material and the dopants are independently embedded in
predict any materials properties of the doped materials. For the
DopNet. This explicit embedding mechanism of DopNet improves
future works of machine learning in materials science, we publicly
the prediction performance for the doped materials by capturing
open the source code of DopNet at https://github.com/ngs00/
the dopant effects, which are numerically tiny in the materials
DopNet.
representations.
DopNet consists of three parts: (1) host embedding networks to
RESULTS extract latent embeddings representing the host materials, (2)
dopant embedding networks to generate latent embeddings of
Doped materials in regression of materials property
the dopants, and (3) dense network to predict target materials
Usually, only a small amount of these dopants are added to the property from the embeddings of the host materials and the
host materials, but the materials properties can be changed dopants. Figure 2 illustrates the architecture and forward step of
drastically21,22. Hence, the doped material have severely nonlinear DopNet to predict target materials property y from the input
relations with their materials properties in local areas of materials chemical formula through four steps:
space as shown in Fig. 1a. For instance, the changes from (b)
Mg2Si0.999Bi0.001 to (a) Mg2Si0.9985Bi0.0015 is tiny in the entire ● The input chemical formula is decomposed into the host
materials space, but ZT was significantly improved from 0.32 to material and the dopant(s). Each atom in the material is
0.6421. Also, ZTs of (c)-(e) fluctuated from 0.54 to 1.4522. However, classified as a dopant when their proportion is less than or
existing machine learning methods are not suitable to approximate equal to γ, where γ ≥ 0 is a pre-defined hyperparameter of
these severely nonlinear relations23. Although some machine DopNet. For instance, Zr0.5Hf0.5Sn1.998Sb0.002 is decomposed
learning methods to approximate the severely nonlinear functions into a host material Zr0.5Hf0.5Sn1.998 and a dopant Sb0.002 for a
were proposed24,25, they require large-scale training datasets, which given γ = 0.1.
are impractical in experimental materials databases. ● The host material is described as a vector-shaped representa-
This severely nonlinear relations between the thermoelectric tion xh based on statistical information from the elemental
materials and their ZTs are observed in real-world datasets. attributes of the constituent atoms. For the host feature vector
Figure 1b shows distribution of thermoelectric materials xh, an autoencoder gψ(hϕ(xh))28 is applied to generate a
collected from a real-world database26. Each point is a material, compact latent embedding of the host material. Then, the
and the colors of the points indicate the values of ZTs at 700 K. host embedding zh is calculated by feeding the latent feature
For the five example material, their ZTs at 700 K are presented in vector of the host material into the host embedding network.
● The feature vectors of the dopants are stored in a set Sd that
parentheses. The materials were visualized in 2-dimensional
space by t-SNE27. As shown in the figure, the doped materials can contain maximum K dopants, where the maximum
are highly mixed in terms of their ZTs. As a result, this mixed number of dopants K is a hyperparameter of DopNet. In
distribution forms a severely nonlinear relation between the doped materials including M < K dopants, the K − M unde-
doped materials and their ZTs. It is consistent with our common fined dopant feature vectors are set to zero vectors. Then, the
sense in the conceptual materials space of Fig. 1a. Specifically, dopants are embedded independently of the host material
Mg2Si0.6Ge0.4Bi0.02 and Mg2Si0.6Ge0.4Ag0.02 are distributed almost through the dopant embedding networks that share model
npj Computational Materials (2021) 106 Published in partnership with the Shanghai Institute of Ceramics of the Chinese Academy of Sciences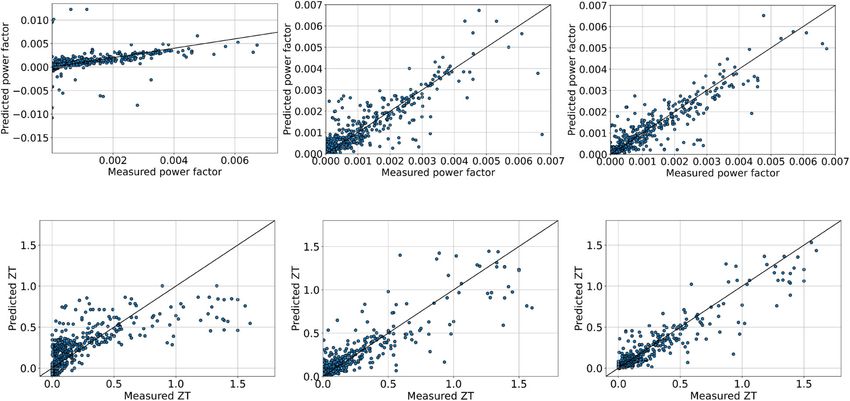
G.S. Na et al.
                                                                                                                                                                                  3
             Input chemical formula:                                  Set of dopant features:

              Zr   .   Hf       .   NiSn      .     Sb   .

                 Dopant
                                                                              Dopant embedding
                                                                                 network #1
                                                                                                     Dopant embedding
                                                                                                        network #2
                                                                                                                         …      Dopant embedding
                                                                                                                                   network #K
              decomposition
                                                                                                                                             Parameter
                       Zr   .       Hf   .   NiSn   .        Sb   .                                 Dopant embedding:
                                                                                                                                              sharing

                                                                          Encoder         Decoder                                                          Target
                                                                            ℎ                                 Host                                       property:

                                                                                                                                   …
                                         Statistical materials
                                                                                                          embedding:
                                         representation:

                                                                                                 Host embedding                    Dense Network
                                                                                                    network

Fig. 2 Architecture of DopNet and its forward process to predict target materials property y from the chemical formula
Zr0.5Hf0.5Sn1.998Sb0.002. The yellow circle and squircle in the network indicates artificial neuron with ReLU activation52 and ReLU feedforward
network, respectively.

    parameters with each other. After the embedding process, the                                        representations based on elemental attributes of the constituent
    generated dopant embeddings are concatenated as a single                                            atoms. The selected elemental attributes and the representation
    vector representation zd.                                                                           method of the materials are provided in Supplementary Note 1.
●   The target property y is predicted through the dense network                                        We compared the prediction performance of DopNet with support
    by feeding the final materials representation zh ⊕ zd.                                               vector regression (SVR)33, Gaussian process regression (GPR)10,
The hyperparameter settings and network configurations of                                                gradient boosting tree regression (GBTR)20, and deep neural
DopNet are provided in the method section, and the implementa-                                          network (DNN)34. SVR is effective to prevent overfitting due to its
tion details including selected elemental attributes are presented                                      margin-based loss formulation. GPR is widely used in scientific
in Supplementary Table 1.                                                                               applications due to its extrapolation capabilities35. GBTR is the
                                                                                                        most popular method in scientific applications and achieved state-
                                                                                                        of-the-art performance in various applications36,37. The prediction
Prediction of thermoelectric properties
                                                                                                        performances were measured by mean absolute error (MAE) and
About 70% of the primary energy is lost in the form of heat                                             coefficient of determination (R2 score)38. All machine learning
during the energy conversion process29. To utilize the wasted                                           methods were evaluated with 3-fold cross-validation, and the
energy, thermoelectric materials that convert heat into electricity                                     evaluation was repeated 10 times. We reported the average of the
by Seebeck effect30 have been widely studied in physical                                                prediction performances measured by the 10 times repetitions of
science31,32. The efficiency of the energy conversion process                                            the evaluations.
originated from the thermoelectric materials are typically given                                           Table 1 summarizes the evaluation results of SVR, GPR, GBTR,
by a figure of merit (ZT) as:
                                                                                                        DNN, and DopNet on the MRL dataset. For all thermoelectric
       S2 σT                                                                                            properties, DopNet showed the best prediction performances, as
ZT ¼         ;                                                  (1)
                                                                                                        highlighted by the bold fonts. In particular, DopNet outperformed
         κ
where S is Seebeck coefficient, σ is electrical conductivity, T is                                       GBTR that showed state-of-the-art performances in various
temperature, and κ is thermal conductivity.                                                             scientific applications36,37,39,40. Furthermore, DopNet achieved R2
   Despite the importance of the thermoelectric materials,                                              score of 0.86 ± 0.02 in predicting ZT that determines the thermo-
machine learning to predict thermoelectric performances of                                              electric capability of the materials, and its prediction error for ZT
the materials was hardly studied in physical science. The main                                          was 0.06 ± 3.00e−3. Figure 3 shows the prediction results of GPR,
obstacle is the lack of training datasets because simulation and                                        GBTR, and DopNet for power factor and ZT. Note that the
calculation methods are not applicable to estimate the thermo-                                          prediction results of SVR are not presented due to its low R2 scores
electric properties of the materials in most cases. However,                                            −4.10 ± 0.34 and 0.17 ± 0.01 in predicting power factor and ZT,
although there is no dataset for the thermoelectric materials,                                          respectively. Although GPR and GBTR well predicted the power
Materials Research Laboratory (MRL) opened about 500                                                    factors of the materials, there are severe outliers in their prediction
materials with their thermoelectric properties in their website26,                                      results as shown in Fig. 3a. By contrast, the severe outliers were
and we manually collected the chemical formulas of the                                                  removed in the prediction results of DopNet. In predicting ZT, GPR
thermoelectric materials and their thermoelectric properties at                                         and GBTR also well predicted the ZTs of the materials. However,
the website of MRL to predict the thermoelectric properties of                                          they significantly underestimated the ZTs of the high-ZT materials,
the materials. In this paper, we refer this collected thermo-                                           as highlighted in Fig. 3b. By contrast, DopNet roughly predicted
electric dataset to MRL dataset. This MRL dataset contains 573                                          the ZTs of the high-ZT materials.
thermoelectric materials from various combinations of the host                                             In addition to power factor and ZT, we also present the
materials and the dopants with several thermoelectric proper-                                           prediction results for the transport properties of the materials, as
ties measured experimentally at 300 K, 400 K, and 700 K. The                                            shown in Fig. 4. GPR completely failed to predict the transport
collected materials systems in the MRL dataset are summarized                                           properties of the test materials, even though it roughly predicted
in Supplementary Table 2.                                                                               ZTs. By contrast, GBTR and DopNet accurately predicted Seebeck
   In the evaluations, we predicted five thermoelectric properties:                                      coefficients of the materials. In particular, many outliers in the
Seebeck coefficient, electrical conductivity, thermal conductivity,                                      prediction results of GBTR were removed as shown in the
power factor, and ZT. For prediction, the chemical formulas of the                                      prediction results of DopNet. However, GBTR and DopNet showed
materials were converted into the vector-shaped materials                                               large prediction errors for the materials of the low electrical

Published in partnership with the Shanghai Institute of Ceramics of the Chinese Academy of Sciences                                  npj Computational Materials (2021) 106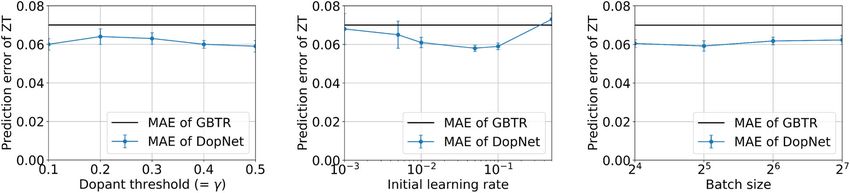
G.S. Na et al.
4
     Table 1.   Prediction errors of SVR, GPR, GBTR, DNN, and DopNet.

    Prediction Method          Seebeck coefficient             Electrical conductivity     Thermal conductivity        Power factor               ZT

    SVR                        148.62 ± 1.75                  1464.15 ± 193.08               2.56 ± 0.14              2.44e−3 ± 6.05e−5           0.16 ± 5.00e−3
                               (−0.03 ± 0.04)                  (−0.02 ± 0.00)             (−0.08 ± 0.01)                (−4.10 ± 0.34)            (0.17 ± 0.01)
    GPR                        148.62 ± 1.75                  2160.61 ± 107.03               2.15 ± 0.06              8.63e−4 ± 1.94e−4           0.15 ± 6.00e−3
                               (−0.03 ± 0.04)                  (−0.01 ± 0.01)               (0.43 ± 0.04)               (−5.98 ± 7.23)            (0.47 ± 0.04)
    GBTR                        45.40 ± 1.42                   795.96 ± 233.47               1.21 ± 0.09              3.05e−4 ± 1.55e−5           0.07 ± 3.00e−3
                                (0.80 ± 0.02)                   (0.57 ± 0.27)               (0.55 ± 0.09)                 (0.74 ± 0.05)           (0.78 ± 0.03)
    DNN                         56.53 ± 2.51                  1325.92 ± 197.95               1.27 ± 0.06              3.69e−4 ± 1.40e−5            0.09 ± 0.01
                                 (0.74 ± 0.03)                   (0.03 ± 0.10)              (0.53 ± 0.06)                 (0.69 ± 0.02)           (0.77 ± 0.02)
    DopNet                      39.46 ± 1.34                  763.66 ± 208.02               1.12 ± 0.09               2.75e−4 ± 1.15e−5           0.06 ± 3.00e−3
                                (0.86 ± 0.04)                   (0.64 ± 0.13)              (0.61 ± 0.08)                 (0.79 ± 0.03)           (0.86 ± 0.02)
     The prediction errors measured by MAE are reported with their standard deviations. For each machine learning method, R2 scores are presented in the
     parenthesis below the prediction errors. The measured Seebeck coefficient, electrical conductivity, thermal conductivity, power factor, and ZT are distributed
     within [−752.00, 1235.00], [6.90e−5, 1.32e+5], [0.20, 48.70], [1.77e−10, 6.73e−3], and [6.76e−8, 1.60], respectively. The best prediction performance was
     highlighted by the bold font.

                                                                 a Predicon results of power factor
                                   GPR,          =− .                  GBTR,      = .                               DopNet,       = .

                                                                         b Predicon results of ZT
                    GPR,      = . 7                                    GBTR,      = .                               DopNet,       = .

                                           Underestimated                                   Underestimated
                                          high-ZT materials                                high-ZT materials

    Fig. 3 Prediction results of the machine learning methods on the MRL dataset. a Scatter plots of the prediction results for the test materials
    in predicting power factor. b Scatter plots of the prediction results in predicting ZT. X and Y axes are measured and predicted materials
    properties, respectively.

    conductivities as shown in the yellow areas of Fig. 4b. This                        Prediction of high-ZT materials
    happened because the data with small target values are some-                        The ultimate goal of machine learning in materials science is to
    times omitted in the training of ML algorithms. As future work, we                  discover a novel material, which is called inverse design. For this
    can employ a weighted surrogate loss function to reduce the                         purpose, an accurate prediction of the high-ZT materials is
    prediction errors for the materials of the low electrical conductiv-                important because the goal of the inverse design for the
    ities. In the prediction results of thermal conductivity, GBTR and                  thermoelectric materials is to discover a novel material with high
    DopNet showed severe outliers marked by red circles in Fig. 4c.                     ZT. To evaluate the effectiveness of the machine learning methods
    These data are Zn0.9975Al0.0025O at 300 K and 400 K. Experimen-                     in the inverse design, we measured the prediction errors of the
    tally, they have low electrical conductivities less than 3. However,                machine learning methods in predicting the high-ZT materials.
    similar materials, such as Zn0.995Al0.005O and Zn0.95Al0.05O, have                  Table 2 shows the predicted ZTs of GPR, GBTR, and DopNet for the
    very high electrical conductivities larger than 30. That is, GBTR and               top 10 high-ZT materials in the MRL dataset. As shown in the table,
    DopNet were failed to predict the electrical conductivities of                      GPR and GBTR significantly underestimated ZT of the high-ZT
    Zn0.9975Al0.0025O at 300 K and 400 K because GBTR and DopNet                        materials. The prediction errors of GBTR are 0.12–0.81, and its MAE
    were overfitted to Zn0.995Al0.005O and Zn0.95Al0.05O. This overfitting                for the high-ZT materials was 0.45. By contrast, DopNet showed
    problem is common in ML and can be solved by collecting larger                      prediction errors lower than 0.5 for all materials, and its MAE for the
    training datasets.                                                                  high-ZT materials was 0.26. Hence, DopNet improved the prediction

    npj Computational Materials (2021) 106               Published in partnership with the Shanghai Institute of Ceramics of the Chinese Academy of Sciences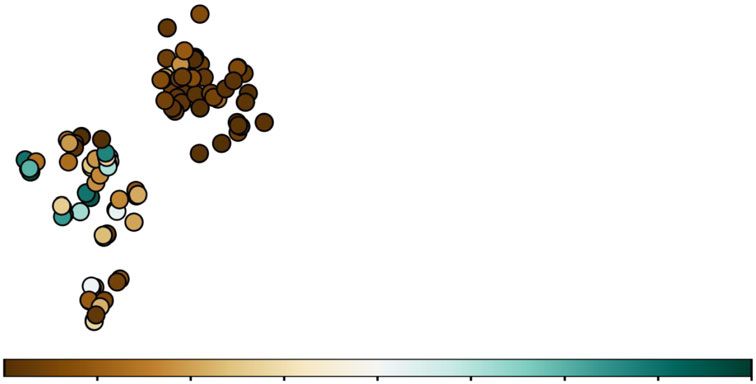
G.S. Na et al.
                                                                                                                                                                5
                                                    a Prediction results of Seebeck coefficient

                 GPR,        =− .                              GBTR,        = .                                DopNet,         = .

                                                  b Prediction results of electrical conductivity

                             GPR,       =− .                                 GBTR,         = .                             DopNet,           = .

                                                    c Prediction results of thermal conductivity

                 GPR,        = .

                                                                            GBTR,         = .                               DopNet,           = .

Fig. 4 Regression results of the ML algorithms in predicting Seebeck coefficient, electrical conductivity, and thermal conductivity.
a Scatter plots of the prediction results for the test materials in predicting Seebeck coefficient. b Scatter plots of the prediction results with
large error regions for electrical conductivity. c Scatter plots of the prediction results with large error data for thermal conductivity. The
prediction results of electrical conductivity were presented by log scale. Two marked materials (a) and (b) in the prediction results of thermal
conductivity are Zn0.9975Al0.0025O at 300 K and 400 K, respectively.

 Table 2.   Predicted ZTs of the machine learning algorithms for top 10 high-ZT materials in the MRL dataset.

Chemical formula                    Ground truth (= y)            fGP            fGB              fDN          ∣y − fGP∣         ∣y − fGB∣          ∣y − fDN∣

Pb0.96Sr0.4TeNa0.2                  1.6053                        0.55           0.79             1.43         1.05              0.81               0.17
Pb0.98Sr0.2TeNa0.1                  1.5653                        0.76           0.81             1.53         0.80              0.75               0.03
Na0.02PbTe0.85Se0.15                1.5054                        0.84           1.24             1.21         0.66              0.26               0.29
In0.25Co4Sb12                       1.5055                        0.46           1.22             1.06         1.04              0.28               0.44
Zr0.5Hf0.5NiSn1.998Sb0.002          1.4522                        0.85           0.98             1.35         0.60              0.47               0.10
Zr0.25Hf0.25Ti0.5NiSn               1.4222                        0.62           1.04             1.22         0.80              0.38               0.20
Tl0.02Pb0.98Te                      1.3956                        0.90           0.91             0.91         0.49              0.48               0.48
Na0.02PbTe0.75Se0.25                1.3954                        0.84           1.27             1.15         0.55              0.12               0.24
In0.2Co4Sb12                        1.3955                        0.47           1.26             1.04         0.92              0.13               0.35
Ag0.15Sb0.15Te1.15Ge0.85            1.3857                        0.60           0.59             1.05         0.78              0.79               0.33
Average error (MAE)                                                                                            0.77              0.45               0.26
 ZTs of all materials were measured at 700 K. The predicted values of GPR, GBTR, and DopNet are denoted by fGP, fGB, and fDN, respectively.

Published in partnership with the Shanghai Institute of Ceramics of the Chinese Academy of Sciences             npj Computational Materials (2021) 106
G.S. Na et al.
6
accuracy for the high-ZT materials by 42.22% compared to GBTR. and the MAE of DopNet, it can be used to roughly investigate the
This significant improvement by DopNet in predicting high ZT is thermoelectric performances of new material before synthesizing it
important and has wide impacts because the accurate prediction of (Table 2).
the high-ZT materials is a key task in the machine-based inverse
design of the materials. Hyperparameter analysis
Compared to conventional artificial neural networks, DopNet has
ZT prediction of unseen materials from external databases two additional hyperparameters denoted by γ and K. The dopant
Since the MRL dataset contains ZTs of the same materials for each threshold γ determines whether an atom in a given material is an
temperature, some known materials with ZTs measured at atom in the host material or a dopant. If the proportion of the
different temperatures can be included in the training dataset. atom is less than or equal to γ, it is identified as a dopant. Another
To evaluate the machine learning methods in the extrapolation hyperparameter K defines the maximum number of dopants
problem, we measured the prediction accuracies of GBTR and allowed in DopNet. However, K is automatically determined to
DopNet for completely unseen thermoelectric materials. The test cover all doped materials in the dataset for a given γ. Hence, we
thermoelectric materials for this evaluation were collected in measured the prediction errors of DopNet as γ changes on the
previous literature22,41,42. ZTs of the collected test materials were MRL dataset. Figure 5a shows the evaluation results of DopNet for
measured at 700 K. The test thermoelectric materials for the different values of the dopant threshold γ. The prediction errors
evaluation can be categorized as: were measured by MAE. As shown in Fig. 5, DopNet achieved
lower errors than GBTR for all values of γ. This evaluation result
● Known combination: the combinations of the host atoms and shows the robustness of DopNet for the hyperparameter γ.
dopants were already provided in the MRL dataset, but the In addition to γ, there are two important hyperparameters in the
same doping concentrations were not given in the training. training of deep neural networks, called initial learning rate and
● Unknown combination: both the combinations of the atoms batch size. We also evaluated the prediction errors of DopNet for
and the doping concentrations are completely unseen in the different initial learning rates and batch sizes in predicting ZT. As
MRL dataset. shown in Fig. 5b, DopNet showed smaller prediction errors with
Table 3 summarizes the evaluation results. For the two test reasonable choices of the initial learning rates in { 5e−3, 1e−2, 5e
cases, GBTR showed relatively large errors in predicting ZTs of the −2, 1e−1}. However, the prediction error of DopNet was larger
test thermoelectric materials because the tree-based methods are than the errors of GBTR for the initial learning rate of 5e−1
not suitable for the extrapolation problems. In particular, GBTR because the gradient descent method to train GBTR was not
couldn’t capture the changes by the different doping concentra- converged. For the different batch sizes, DopNet always out-
tions of Sb in Zr0.25Hf0.25Te0.5NiSn1−xSbx, and ZTs of these materials performed GBTR as shown in Fig. 5c. As a result, DopNet was
are predicted as the same value of 0.32. MAE of GBTR for the robust to the changes in the dopant threshold (γ) and the batch
materials from the external databases was 0.41. By contrast, size, and it will enhance the general applicability of DopNet to
DopNet predicted ZT of the test materials more accurately, and the real-world applications.
MAE of DopNet was 0.13. Furthermore, while GBTR failed to In a practical implementation, the dopant threshold γ is an
identify the dopant effects in Zr0.25Hf0.25Te0.5NiSn1−xSbx system, important hyperparameter of DopNet because it determines
DopNet roughly predicted the order of ZTs in the Zr0.25Hf0.25Te0.5- the host materials and the additives in a given material. However,
NiSn1−xSbx system. As shown in the prediction results in Table 3 the dopant threshold should be selected in appropriate ranges.
Table 3. Predicted ZTs of the machine learning algorithms for external test materials of two test cases.
Test case Chemical formula Temperature (K) Ground truth (= y) fGB fDN
41
Known combination Na0.01Pb0.99Te 700 1.22 1.31 1.26
Na0.02Pb0.98Te 700 1.3741 1.32 1.29
Na0.03Pb0.97Te 700 1.4941 1.32 1.37
Unknown combination Pb0.95Ce0.05Te 300 0.2442 0.06 0.09
Zn0.02PbTe 300 0.4142 0.22 0.09
Pb0.95Ce0.05Te 673 0.8842 1.16 0.98
Na0.025Mg0.03Pb0.95Te 700 1.0742 1.29 1.22
Na2TeSr0.01PbTe 700 1.2442 0.43 1.32
Mg3.05Nb0.15Sb1.5Bi0.49Te0.01 673 1.5742 0.40 1.66
Zr0.25Hf0.25Te0.5NiSn0.998Sb0.002 700 1.5022 0.32 1.27
Zr0.25Hf0.25Te0.5NiSn0.996Sb0.004 700 1.3822 0.32 1.25
Zr0.25Hf0.25Te0.5NiSn0.99Sb0.01 700 1.2122 0.41 1.24
Zr0.25Hf0.25Te0.5NiSn 700 1.3022 0.32 1.27
Mg3.2Sb1.5Bi0.49Te0.01 716 1.5042 0.33 1.43
PbTeCd0.02 773 1.5042 1.19 1.31
Tl0.02Pb0.98Te 800 1.5042 0.93 1.36
Ce0.1In0.1Tb0.2Co4Sb12 800 1.3442 0.64 0.95
Ba0.06La0.05Tb0.02Co4Sb12 850 1.2842 0.63 1.25
Average error (MAE) 0.41 0.13
ZTs of the test materials were measured at 700 K. The predicted ZT of GBTR and DopNet are denoted by fGB and fDN, respectively.
npj Computational Materials (2021) 106 Published in partnership with the Shanghai Institute of Ceramics of the Chinese Academy of SciencesG.S. Na et al.
7
a Predicon errors for each b Predicon errors for each
c Predicon errors for each batch size
dopant threshold inial learning rate
Fig. 5 Prediction errors of DopNet for different values of the hyperparameters. a Prediction errors for different dopant thresholds.
b Prediction errors for different initial learning rates of the gradient method. c Prediction errors for different batch sizes.
For a large dopant threshold, too many elements can be identified DopNet is 42.22% compared to GBTR. This improvement of
as the additives, and the host materials were not defined. To DopNet in predicting high-ZT materials is noteworthy because our
prevent this implementation issue, we propose a rule to select the ultimate goal is to discover a novel high-ZT material.
dopant threshold. Let β is defined as the maximum value of the Since the MRL dataset contains ZTs of the same material
proportions of the elements in a chemical composition. In the measured at different temperatures, some materials in the test
implementation of DopNet, the dopant threshold should satisfy dataset can be shown in the training dataset with different
the following inequality for the chemical compositions X ¼ temperatures. To evaluate DopNet in predicting ZTs of completely
fx1 ; x2 ; ::: ; xN g in a given dataset, where xi is a chemical unseen materials, we predicted ZTs of the materials collected from
composition. external databases as shown in Table 3. In this experiment, GBTR
was not effective to predict ZTs of the unseen materials, and the
γ < minfβ1 ; β2 ; ::: ; βN g (2) MAE of GBTR increased explosively from 0.07 for the test dataset
If the dopant threshold does not satisfy the inequality in Eq. (2), of the MRL dataset to 0.41 for the completely unseen materials.
some materials are recognized as having no host materials. Thus, The inaccurate prediction performance of GBTR in the extrapola-
the dopant threshold should be selected in ð0; minfβ1 ; β2 ; ::: ; βN gÞ tion limits the applicability of GBTR to real-world applications
to properly separate the materials into the hosts and the additives. despite its superior interpolation capabilities. This problem of
GBTR in the extrapolation is unsolvable because the functions
approximated the tree-based methods are defined only in the
DISCUSSION ranges of the training datasets. By contrast, the MAE of DopNet
The doped materials are common in thermoelectric materials. increased from 0.06 for the MRL dataset to 0.13 for the unseen
Since the materials can have completely different materials materials. That is, DopNet was significantly more effective than the
properties by a small amount of the dopants, the doped materials popular GBTR in the extrapolation problem. We will investigate
usually have mixed distribution for the materials properties, as the reason for the performance improvement of DopNet in the
shown in Fig. 1. In particular, the thermoelectric properties of the extrapolation problem in the next section.
materials can be dramatically changed by the dopants. For this To clarify the reason for the performance improvement of
reason, predicting the materials properties of the doped materials DopNet, we investigated the embedding results of DopNet and
using machine learning algorithms is challenging because the compared the embedding results of DopNet with the embeddings
relations between the doped materials and their materials of DNN. Note that we did not compare the embedding results
properties are severely nonlinear. In this paper, we proposed a with SVR, GPR, and GBTR because they do not generate the latent
unified architecture of the neural networks, called DopNet, to embeddings of the input data. To visualize the embedding results,
accurately predict the thermoelectric properties of the doped t-SNE27 was applied to the outputs of the last hidden layers of
materials. DopNet is designed to explicitly and independently DNN and DopNet. Figure 6 shows the visualization results of the
representing the host materials and the dopants to identify the embeddings generated by DNN and DopNet. In the figure, each
effects of the dopants in the entire materials, as illustrated by the point is the data (pair of material and temperature) in the MRL
architecture of DopNet in Fig. 2. To the best of our knowledge, dataset, and the colors of the points indicate the measured ZTs. As
DopNet is the first machine learning algorithm to predict materials shown in Fig. 6a, the data is disorderly distributed in the initial
properties from the chemical formulas of the materials by stage. After 100 epochs of the training of DopNet, the data was
identifying the dopant effects. roughly clustered into the low-ZT data and the high-ZT data.
We evaluated DopNet in predicting the five thermoelectric Finally, the data was arranged in a direction proportional to the
properties of various doped materials. For the evaluations, we measured ZTs. That is, DopNet generated a latent data
manually collected the chemical formulas of 573 materials and representation that makes the regression problem easier. We also
their thermoelectric properties from the MRL database26. As compared the embedding results of DopNet with the embeddings
shown in Table 1, DopNet outperformed state-of-the-art machine of DNN. As shown in Fig. 6b, DNN did not generate a proper data
learning methods in predicting Seebeck coefficient, electrical embedding that separates the input data according to their target
conductivity, thermal conductivity, power factor, and ZT. In values. For instance, despite the completely different ZTs of
particular, DopNet achieved R2 scores of 0.79 and 0.86 in In0.2Co4Sb12 and In0.05Co4Sb12 at 700 K, they were embedded into
predicting power factor and ZT, respectively. Furthermore, DopNet the same area as shown in the embedding results of DNN. By
was significantly more effective than GPR and GBTR in predicting contrast, they were separately embedded by DopNet. In addition
the high-ZT materials. Specifically, the MAEs of GPR and GBTR for to this case, DNN did not properly represent Zr0.25Hf0.25Ti0.5NiSn
the top 10 high-ZT materials were 0.77 and 0.45, respectively. and Zr0.5Hf0.25NiSn. This embedding result of DNN shows that
However, the MAE of DopNet was 0.26, and the improvement of DNN cannot effectively identify the subtle changes by the dopants
Published in partnership with the Shanghai Institute of Ceramics of the Chinese Academy of Sciences npj Computational Materials (2021) 106G.S. Na et al.
8
a Embedding results of DopNet for each epoch
Initial data distribution Embedding result
Mg Si 100 epochs 500 epochs Proportional to ZT
Low-ZT data
Zr . Hf . NiSn
ℎ
Co Sb High-ZT data
ℎ
Measured ZT (= Target value)
0.2 0.4 0.6 0.8 1.0 1.2 1.4 1.6
b Embedding result comparison of DNN and DopNet
Embedding result of DNN Embedding result of DopNet
(d) (c)
(c) (a) (a) In . Co Sb (ZT = 1.39, 700 K)
(d) (b) In . Co Sb (ZT = 0.59, 700 K)
(b)
(c) Zr . Hf . Ti . NiSn (ZT = 1.42, 700 K)
(b)
(d) Zr . Hf . NiSn (ZT = 0.54, 700 K)
(a)
1.6
1.0
0.2
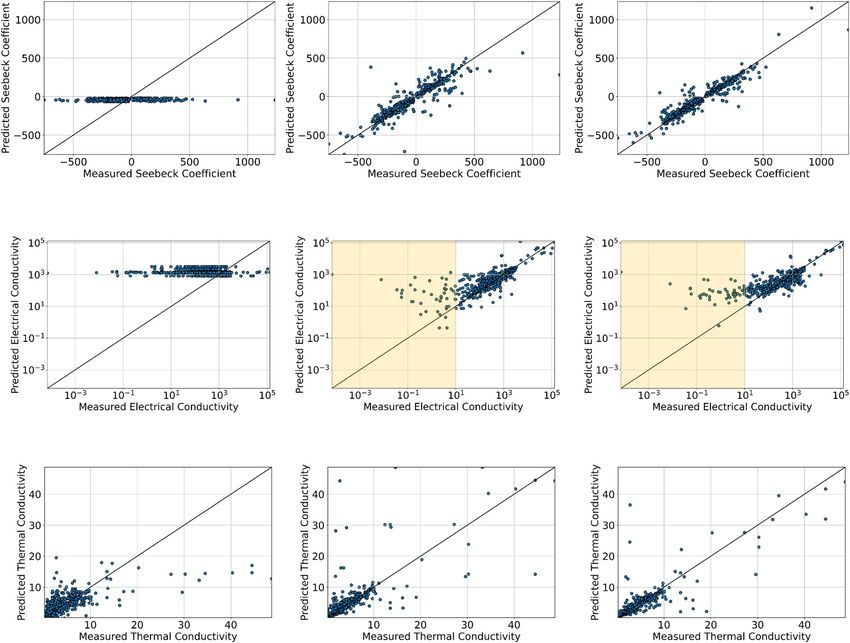
Fig. 6 2-dimensional visualization of embedding results of DNN and DopNet. a embedding results of DopNet for each epoch of the
training. b embedding results comparison between FNN and DopNet. The embedding results were visualized by t-SNE27 applied to
the outputs of the last hidden layers of FNN and DopNet. Each point is the data (pair of material and temperature) in the MRL dataset, and the
colors of the points indicate the values of ZTs. Two axes h1 and h2 indicate the first and second latent features calculated by t-SNE, respectively.
in the materials. However, DopNet properly represented the the traditional calculation methods even though DopNet does not
doped materials according to their ZTs because it was specifically require human labor and extensive computing resources.
designed to identify the dopant effects in the materials, as We also predicted ZTs of RECuZnP2 (RE = Pr, Nd, Er) at 300 K,
illustrated in Fig. 2. 400 K, 700 K. We omitted the Mg2Si structure because it was
From the embedding results, we can also rationalize the contained the training dataset of DopNet. By contrast, the
performance improvement of DopNet in predicting ZTs of the RECuZnP2 (RE = Pr, Nd, Er) system have never been shown in
unseen materials, which is called the extrapolation problem. the training dataset. Moreover, Pr and Er have never been shown
We can observe that the data is monotonically arranged according in any data in the training dataset. For the calculation results of45,
to ZTs in the embedding results of DopNet, as shown in Fig. 6b. That MAE was 0.12 for the RECuZnP2 (RE = Pr, Nd, Er) system. However,
is, the linearity of the relation between the materials and their ZTs DopNet achieved MAE of 0.06 ± 0.01 in 10 times repetitions of the
increased in the embedding space generated by DopNet. Hence, training and prediction processes for the same materials systems.
the relation to be approximated the prediction model was linearized Furthermore, although the calculation methods should be
by encoding the nonlinearity into the input data of the prediction manually modified to improve the prediction accuracies, the
model. The positive effects of improving the prediction accuracy in prediction accuracy of DopNet can be improved just by collecting
the extrapolation problems by the nonlinearity encoding were well more training data. Thus, DopNet can be used as a computation
investigated theoretically and experimentally in43. tool to discover novel thermoelectric materials.
Recently, Fan et al.44 calculated the electronic structure, electron DopNet can provide a rapid prediction with reasonable
relaxation time, and thermoelectric properties for Pb doped Mg2Si prediction accuracies in discovering new thermoelectric materi-
structure, and reported the calculated thermoelectric properties at als. One of the most practical benefits of DopNet is that
different temperature. Also, Pőhls et al.45 tried to calculate the additional information generated by experimental analyses and
thermoelectric properties of RECuZnP2 (RE = Pr, Nd, Er) using density functional theory (DFT)46 calculations are not required.
sophisticated calculation methods based on ab initio scattering Thus, DopNet can be used for fast screening in large materials
and transport (AMSET) and compressive sensing lattice dynamics. databases or combinatorially generated candidates. This screen-
According to their calculation results at 300 K, 400 K, and 700 K, ing method based on DopNet will significantly accelerate the
MAE between the experimental and calculation ZTs are 0.1244,45. process of discovering novel materials because we can sum up
Similarly, DopNet showed the error of 0.13 in predicting ZTs of the several candidate materials in thousands of materials from
completely unseen materials as shown in Table 3. As a result, combinations of host materials, doped elements, and doping
DopNet achieved the comparable extrapolation capabilities with concentrations.
npj Computational Materials (2021) 106 Published in partnership with the Shanghai Institute of Ceramics of the Chinese Academy of SciencesG.S. Na et al.
9
For a trained DopNet fθ(z; θ*), the computational screening designed to extract latent features of given data and trained in
process based on DopNet can be conducted as the following unsupervised manner by minimizing reconstruction loss. For a given
three steps. training dataset D ¼ fðx1 ; y1 Þ; ðx2 ; y2 Þ; :::; ðxN ; yN Þg, the training problem
of autoencoders are defined by:
● Step 1: The chemical compositions of the candidate materials
are generated combinatorially. For instance, the compositions 1X N
ϕ ; ψ ¼ arg minϕ;ψ jjxh;i gψ ðhϕ ðxh;i ÞÞjj22 ; (6)
of our target materials system TlaPbbTec are generated N i¼1
combinatorially for all possible values of the proportions a, where N is the number of materials in the training dataset. Note that the
b, and c. Then, the combinatorially generated compositions label data yi is not used in the training of the autoencoder. In DopNet,
are validated based on chemical rules, such as valency there is no restriction in choosing autoencoder to embed the representa-
checking. tions of the host materials. For instance, a probabilistic model of
● Step 2: The trained DopNet predicts the target materials autoencoder47 can be used in DopNet rather than the traditional
properties for the generated compositions. After the predic- autoencoder defined by Eq. (6).
tion, the compositions are sorted according to user-defined After the training of the autoencoder, the dopant embedding network fμ
criteria. and the dense network fθ is simultaneously trained in supervised manner.
● Step 3: For top k materials in the prediction results, domain For a trained autoencoder gψ(hϕ(xh)), the host embedding network, the K
dopant embedding networks, and the dense network are trained by
experts synthesize the selected materials to validate their directly minimizing the surrogate loss, such as MAE and root mean square
properties experimentally. error (RMSE). For instance, the training problem of the networks can be
Usually, the first and second steps are finished within an hour, i.e., defined based on MAE as:
promising materials can be identified from thousands of
1X N
candidate materials within an hour. Thus, experimenters can θ ; ω ; μ ¼ arg minθ;μ;ω jy f θ ðzh;i zd;i Þj; (7)
N i¼1 i
significantly reduce the time required to synthesize thousands of
materials to the time required to synthesize only a few k materials. where θ, ω, and μ are the model parameters of the dense, host embedding,
and dopant embedding networks, respectively. In the training of the
neural networks in DopNet, the dropout technique48 was applied to
METHODS improve the generalization capability. Adam optimizer49 and stochastic
Forward process of DopNet gradient descent method with learning rate decay were used to optimize
the model parameters of the autoencoder and the other model parameters
Forward process of DopNet consists of host embedding, dopant
in DopNet, respectively. Algorithm2 formally describes the training process
embedding, and prediction. For a host feature vector xh, a latent
of DopNet based on the gradient descent methods.
embedding of the host material is calculated via an the autoencoder
and the host embedding network as:
zh ¼ f ω ðuω ðhϕ ðxh ÞÞÞ; (3)
where hϕ is an encoder network of the autoencoder, and fω is the host
embedding network. Simultaneously, the dopant embedding zd is
calculated from the set of dopant features Sd via dopant embedding
networks as:
zd ¼ f μ ðxd1 Þ f μ ðxd2 Þ f μ ðxdK Þ; (4)
where xdi is a feature vector of ith dopant in the input material, fμ is the
dopant embedding network, and ⊕ indicates vector concatenation. After
generating the latent embeddings of the host material and the dopants,
the target materials property y is predicted via fθ as:
y ¼ f θ ðzh zd Þ: (5)
By the independent embedding processes of the host material and the
dopants in Eqs. (3) and (4), DopNet can easily capture the dopant effects in
the entire materials. The forward step of DopNet is formally described in
Algorithm1.
Hyperparameter settings
Model parameter optimization We applied greedy search with validation dataset to select hyperpara-
The materials representations of the host materials are converted into the meters of the machine learning methods. All hyperparameters were set as
latent and compact embeddings via autoencoder in DopNet. In the optimal values that minimize the prediction errors of the validation
training of DopNet, the autoencoder for the host material and the dopant datasets. Two hyperparameters of SVR, called margin ϵ and regularization
embedding network are independently trained on the basis of the coefficient C, were selected within {0.01, 0.1, 0.5, 1.0} and {0.1, 0.2, 0.4},
decomposed materials representations xh and Sd. Autoencoders are respectively. For GBTR, maximum depth of tree and number of estimators
Published in partnership with the Shanghai Institute of Ceramics of the Chinese Academy of Sciences npj Computational Materials (2021) 106G.S. Na et al.
10
were searched in {3, 4, 5, 6, 7, 8} and {100, 200, 300, 400}, respectively. The 10. Rasmussen, C. E. & Williams, C. K. I. Gaussian Processes for Machine Learning
hyperparameters of DopNet were also selected manually. The selected (Adaptive Computation and Machine Learning) (The MIT Press, 2005).
value of the dopant threshold γ and the maximum number of dopants K 11. Lee, J., Seko, A., Shitara, K., Nakayama, K. & Tanaka, I. Prediction model of
were set to 5e−1 and 3, respectively. DopNet was trained by stochastic band gap for inorganic compounds by combination of density functional
gradient descent (SGD)50. The autoencoder of DopNet to embedded the theory calculations and machine learning techniques. Phys. Rev. B 93, 115104
host materials were trained by SGD with the initial learning rate 1e−3, the (2016).
L2 regularization coefficient 1e−5, and the batch size 32. The other parts of 12. Kipf, T. N. & Welling, M. Semi-supervised classification with graph convolutional
DopNet (dopant embedding network and dense network) were also networks. In International Conference on Learning Representations (ICLR) (2017).
trained by SGD with the initial learning rate 1e−1, the L2 regularization 1e 13. Wu, Z. et al. Moleculenet: a benchmark for molecular machine learning. Chem. Sci.
−7, and the batch size 32. For all experiments, the autoencoder of DopNet 9, 513–530 (2018).
was defined as fc(256)-fc(64)-fc(256)-fc(n1), where fc indicates fully- 14. Morawietz, T. & Artrith, N. Machine learning-accelerated quantum mechanics-
connected layer, the numbers in the fc are the number of output neurons, based atomistic simulations for industrial applications. J. Comput. Aided Mol. Des.
and n1 is dimensionality of the host feature xh. The host and dopant 35, 557–586 (2020).
embedding networks of DopNet were defined as simple dense networks 15. Zitolo, A. et al. Identification of catalytic sites for oxygen reduction in iron- and
with one fc(256). The dense network of DopNet to predict the target nitrogen-doped graphene materials. Nat. Mater. 14, 937–942 (2015).
materials properties was implemented by three fully-connected layers as fc 16. Shui, J., Wang, M., Du, F. & Dai, L. N-doped carbon nanomaterials are durable
(512)-fc(16)-fc(1), and the dropout technique was applied to each fc layer. catalysts for oxygen reduction reaction in acidic fuel cells. Sci. Adv. 1, 1–7 (2015).
To convert the chemical formulas into the numerical feature vectors, 17. Das Adhikari, S., Guria, A. K. & Pradhan, N. Insights of doping and the photo-
intrinsic elemental features are assigned for each atom in the materials. luminescence properties of mn-doped perovskite nanocrystals. J. Phys. Chem.
These feature vectors of the atoms is converted into a feature vector of a Lett. 10, 2250–2257 (2019).
material by calculating statistics of the atomic feature vectors. We 18. Pei, Y., Wang, H. & Snyder, G. J. Band engineering of thermoelectric materials.
calculated average, standard deviation, minimum value, and maximum Adv. Mater. 24, 6125–6135 (2012).
value of the atomic feature vectors. Total 31 intrinsic elemental features 19. Wei, J. et al. Review of current high-zt thermoelectric materials. J. Mater. Sci. 55,
were assigned for each atom, such as atomic number, atomic weight, and 12642–12704 (2020).
electronegativity. Hence, the materials were represented by 124 features 20. Chen, T. & Guestrin, C. Xgboost: a scalable tree boosting system. In Proceedings of
from the mean, standard deviation, minimum, and maximum of the 31 the 22nd ACM SIGKDD International Conference on Knowledge Discovery and Data
atomic attributed of the constituent atoms. Finally, the feature vector of Mining. Association for Computing Machinery (2016).
the materials were concatenated with the temperatures at which the 21. Bux, S. K. et al. Mechanochemical synthesis and thermoelectric properties of high
thermoelectric properties of the materials were measured. The quality magnesium silicide. J. Mater. Chem. 21, 12259–12266 (2011).
elemental features used in this paper are available in Python Mendeleev 22. Sakurada, S. & Shutoh, N. Effect of ti substitution on the thermoelectric properties
Package51. of (zr,hf)nisn half-heusler compounds. Appl. Phys. Lett. 86, 082105 (2005).
23. Tavanaei, A., Ghodrati, M., Kheradpisheh, S. R., Masquelier, T. & Maida, A. Deep
learning in spiking neural networks. Neural Netw. 111, 47–63 (2019).
DATA AVAILABILITY 24. Bian, W. & Chen, X. Neural network for nonsmooth, nonconvex constrained minimiza-
The MRL dataset used in the evaluations was manually collected from http://www. tion via smooth approximation. IEEE Trans. Neural Netw. Learn. Syst.25, 545–556 (2014).
mrl.ucsb.edu:8080/datamine/thermoelectric.jsp. The collected MRL dataset is avail- 25. Weinberger, K. Q., Blitzer, J. & Saul, L. K. Distance metric learning for large margin
able at https://github.com/ngs00/DopNet. nearest neighbor classification. In Conference on Neural Information Processing
Systems (NIPS) (MIT Press, 2009).
26. Gaultois, M. W. et al. Data-driven review of thermoelectric materials: performance
and ressource considerations. Chem. Mater. 25, 2911–2920 (2013).
CODE AVAILABILITY
27. van der Maaten, L. & Hinton, G. Visualizing data using t-sne. J. Mach. Learn. Res. 9,
The source code of DopNet and the experiment scripts are publicly available at 2579–2605 (2008).
https://github.com/ngs00/DopNet. 28. Baldi, P. Autoencoders, unsupervised learning and deep architectures. In Pro-
ceedings of the 2011 International Conference on Unsupervised and Transfer
Received: 18 March 2021; Accepted: 28 May 2021; Learning Workshop - Volume 27, UTLW’11, 37-50 (JMLR.org, 2011).
29. Forman, C., Muritala, I., Pardemann, R. & Meyer, B. Estimating the global waste
heat potential. Renew. Sust. Energy Rev. 57, 1568–1579 (2016).
30. Seebeck, T. Ueber die magnetische polarisation der metalle und erze durch
temperatur-diferenz. Ann. Phys. 82, 133–160 (1826).
31. Snyder, G. J. & Toberer, E. S. Complex thermoelectric materials. Nat. Mater. 7,
REFERENCES 105–114 (2008).
1. Wang, X.-P. et al. Time-dependent density-functional theory molecular-dynamics 32. Julio Gutiérrez Moreno, J., Cao, J., Fronzi, M. & Assadi, M.H.N. A review of recent
study on amorphization of sc-sb-te alloy under optical excitation. npj Comput. progress in thermoelectric materials through computational methods. Mater.
Mater. 6, 31 (2020). Renew. Sustain. Energy 9, 16 (2020).
2. Tsai, Y.-C. & Bayram, C. Band alignments of ternary wurtzite and zincblende iii- 33. Awad, M. & Khanna, R. Support vector regression. Efficient Learning Machines.
nitrides investigated by hybrid density functional theory. ACS Omega 5, (Springer, 2015).
3917–3923 (2020). 34. LeCun, Y., Bengio, Y. & Hinton, G. Deep learning. Nature 521, 436–444 (2015).
3. Jang, S. et al. First-principles calculation of metal-doped caalsin3: material design 35. Wilson, A. G. & Adams, R. P. Gaussian process kernels for pattern discovery and
for new phosphors. RSC Adv. 5, 39319–39323 (2015). extrapolation. In Proceedings of the 30th International Conference on International
4. Umari, P., Mosconi, E. & Angelis, F. D. Relativistic GW calculations on Conference on Machine Learning - Volume 28, ICML’13 (JMLR.org, 2013).
CH3NH3PbI3 and CH3NH3SnI3 perovskites for solar cell applications. Sci. Rep. 4, 36. Wang, Z., Zhang, H. & Li, J. Accelerated discovery of stable spinels in energy
4467 (2014). systems via machine learning. Nano Energy 81, 105665 (2021).
5. Govoni, M. & Galli, G. Large scale gw calculations. J. Chem. Theory Comput. 11, 37. Sheridan, R. P., Wang, W. M., Liaw, A., Ma, J. & Gifford, E. M. Extreme gradient
2680–2696 (2015). boosting as a method for quantitative structure-activity relationships. J. Chem. Inf.
6. Shim, J., Lee, E.-K., Lee, Y. J. & Nieminen, R. M. Density-functional calculations of Model. 56, 2353–2360 (2016).
defect formation energies using supercell methods: defects in diamond. Phys. 38. Draper, N. R. & Smith, H. Applied Regression Analysis, 3rd ed. (Wiley-Interscience,
Rev. B 71, 035206 (2005). 1998).
7. Zhuo, Y., Mansouri Tehrani, A. & Brgoch, J. Predicting the band gaps of inorganic 39. Rothschild, D. et al. Environment dominates over host genetics in shaping human
solids by machine learning. J. Phys. Chem. Lett 9, 1668–1673 (2018). gut microbiota. Nature 555, 210–215 (2018).
8. Xie, T. & Grossman, J. C. Crystal graph convolutional neural networks for an 40. Zhang, D. et al. A data-driven design for fault detection of wind turbines using
accurate and interpretable prediction of material properties. Phys. Rev. Lett. 120, random forests and xgboost. IEEE Acess 6, 21020–21031 (2018).
145301 (2018). 41. Jood, P. et al. Na doping in pbte: solubility, band convergence, phase boundary
9. Zhao, Z.-W., del Cueto, M., Geng, Y. & Troisi, A. Effect of increasing the descriptor mapping, and thermoelectric properties. J. Am. Chem. Soc. 142, 15464–15475 (2020).
set on machine learning prediction of small molecule-based organic solar cells. 42. Hasan, M. N., Wahid, H., Nayan, N. & Mohamed Ali, M. S. Inorganic thermoelectric
Chem. Mater. 32, 7777–7787 (2020). materials: a review. Int. J. Energy Res. 44, 6170–6222 (2020).
npj Computational Materials (2021) 106 Published in partnership with the Shanghai Institute of Ceramics of the Chinese Academy of SciencesG.S. Na et al.
11
43. Xu, K. et al. How neural networks extrapolate: From feedforward to graph neural AUTHOR CONTRIBUTIONS
networks. In International Conference on Learning Representations (2021). G.S.N. and H.J. supervised the research. G.S.N. and S.J. contributed to design of
44. Fan, T., Xie, C., Wang, S., Oganov, A. R. & Cheng, L. First-principles study of experiments and G.S.N. conducted experiments. G.S.N. and S.J. wrote the original
thermoelectric properties of Mg2Si-Mg22Pb semiconductor materials. RSC Adv. 8, manuscript and analyzed the results. G.S.N. and S.J. equally contributed this work. All
17168–17175 (2018). the authors were involved in writing the manuscript.
45. Pőhls, J.-H. et al. Experimental validation of high thermoelectric performance in
RECuZnP2 predicted by high-throughput dft calculations. Mater. Horiz. 8, 209–215
(2021). COMPETING INTERESTS
46. Kohn, W. & Sham, L. J. Self-consistent equations including exchange and corre-
The authors declare no competing interests.
lation effects. Phys. Rev. 140, A1133–A1138 (1965).
47. Kingma, D. P. & Welling, M. Auto-encoding variational bayes. In International
Conference on Learning Representations (ICLR) (2014).
48. Srivastava, N., Hinton, G., Krizhevsky, A., Sutskever, I. & Salakhutdinov, R. Dropout: ADDITIONAL INFORMATION
A simple way to prevent neural networks from overfitting. J. Mach. Learn. Res. 15, Supplementary information The online version contains supplementary material
1929–1958 (2014). available at https://doi.org/10.1038/s41524-021-00564-y.
49. Kingma, D. P. & Ba, J. L. Adam: A method for stochastic optimization.In Interna-
tional Conference on Learning Representations (ICLR) (2015). Correspondence and requests for materials should be addressed to G.S.N.
50. Bottou, L. Large-scale machine learning with stochastic gradient descent. In
COMPSTAT. (Physica-Verlag HD, 2010). Reprints and permission information is available at http://www.nature.com/
51. Python mendeleev package. https://github.com/lmmentel/mendeleev (2020). reprints
Accessed 12 March 2021.
52. Agarap, A. F. Deep learning using rectified linear units (ReLU). Preprint at https:// Publisher’s note Springer Nature remains neutral with regard to jurisdictional claims
arxiv.org/abs/1803.08375 (2018). in published maps and institutional affiliations.
53. Biswas, K. et al. High-performance bulk thermoelectrics with all-scale hierarchical
architectures. Nature 489, 414–418 (2012).
54. Pei, Y. et al. Convergence of electronic bands for high performance bulk ther-
moelectrics. Nature 473, 66–69 (2011). Open Access This article is licensed under a Creative Commons
55. He, T., Chen, J., Rosenfeld, H. D. & Subramanian, M. A. Thermoelectric properties Attribution 4.0 International License, which permits use, sharing,
of indium-filled skutterudites. Chem. Mater. 18, 759–762 (2006). adaptation, distribution and reproduction in any medium or format, as long as you give
56. Heremans, J. P. et al. Enhancement of thermoelectric efficiency in appropriate credit to the original author(s) and the source, provide a link to the Creative
pbte by distortion of the electronic density of states. Science 321, 554–557 Commons license, and indicate if changes were made. The images or other third party
(2008). material in this article are included in the article’s Creative Commons license, unless
57. Skrabek, E. Properties of the general tags system. In CRC Handbook of Thermo- indicated otherwise in a credit line to the material. If material is not included in the
electrics, 267–275 (CRC Press,1995). article’s Creative Commons license and your intended use is not permitted by statutory
regulation or exceeds the permitted use, you will need to obtain permission directly
from the copyright holder. To view a copy of this license, visit http://creativecommons.
org/licenses/by/4.0/.
ACKNOWLEDGEMENTS
This study was supported by a project from the Korea Research Institute of Chemical
Technology (KRICT) [grant number: SI2151-10]. © The Author(s) 2021
Published in partnership with the Shanghai Institute of Ceramics of the Chinese Academy of Sciences npj Computational Materials (2021) 106You can also read