ASSESSING THE TREND IN RENTAL VALUES OF COMMERCIAL PROPERTIES ALONG OYEMEKUN ROAD, AKURE, NIGERIA
←
→
Page content transcription
If your browser does not render page correctly, please read the page content below
Covenant Journal of Research in the Built Environment (CJRBE) Vol. 1, No. 1 (Maiden Edition), June, 2014.

    ASSESSING THE TREND IN RENTAL VALUES OF
   COMMERCIAL PROPERTIES ALONG OYEMEKUN
              ROAD, AKURE, NIGERIA
                                                    By
                                               Iroham, C. O1,
                                            Oluwunmi, A. O.1,
                                              Simon, R. F1,
                                                  &
                                             Akerele, B. A1.
                               1
                            Department of Estate Management,
                        Covenant University, Ota Ogun State Nigeria.

                         osmond.iroham@covenantuniversity.edu.ng
                        funike.oluwunmi@covenantuniversity.edu.ng
                                  funshosimon@yahoo.com
                                 akerelebeatrice@yahoo.com
Abstract: Commercial property investment which is now very evident along Oyemekun
Road, Akure, Nigeria, a place characterized hither to by residential development, leaves
investors at dark with the choice of commercial property investment. Commercial
properties evident in the study area are purpose-built office space, converted office space
and shopping complex. In a bid to lead investors aright on the best decision of the type of
property to invest their hard earned income in, a study was conducted to assess the trends
in rental values of the properties between 2006 and 2011 in order to discover the property
with the highest trend. This study which is a cross-sectional research that entailed the
survey of the entire 22 Estate Surveying Firms in the study area made use of
questionnaires as the primary source of data. The use of both descriptive and inferential
statistical techniques such as the frequency distribution table and the simple linear
regression, and Analysis of Variance (ANOVA) were adopted in analysing data. From the
study it was discovered that the converted office space is mostly predominant (53%) while
the shopping complex is the most professionally managed property (46%) respectively.
However, the purpose built office space with the highest R2 of 0.9 and having the highest
trend in rental values will result to the fastest recoup of investment. The use of (ANOVA)
coupled with Tukey post-hoc test reveal that the rental values of three properties at the
95% confidence level are significantly different (p=0.000). Based on the study findings, it
is recommended that the purpose built office space with the highest rent and trend should
be the focus of both investors and professional managing agents in order to maximize
returns.
Keywords: Rental values, Rental Trends, Commercial Properties, Nigeria.

                                                                                                             10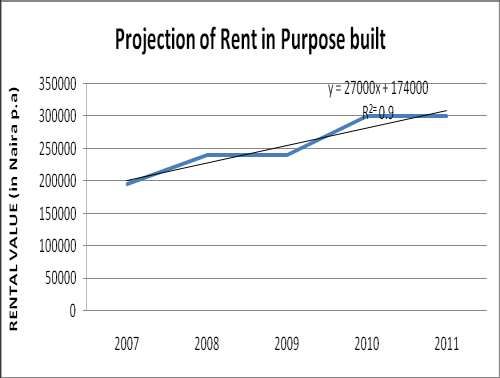
Covenant Journal of Research in the Built Environment (CJRBE) Vol. 1, No. 1 (Maiden Edition), June, 2014.

1. Introduction                                              Meyer,. 2006); the situation of a
Real estate trend is a generic term                          new sport venue (Dehring,
used to describe any consistent                              Depken, and Ward. 2007);
pattern or change in the general                             distance      from        foreclosed
direction of the real estate                                 properties (Lee, 2008); local
industry, which must be based on                             historic designation (Ijla, 2008);
fact and, over the course of time,                           the impact of inflation and real
causing a statistically noticeable                           construction cost in the long-run
pattern of change (Mueller, 1999).                           while in the short-run increase in
This phenomenon can be a result                              wealth rising from equity price
of the economy, a change in                                  (Leung, Chow and Han, 2008);
mortgage       rates,     consumer                           provision of wall-fence round the
speculations or other fundamental                            building and the installation of
and non-fundamental reasons. A                               burglary proof in all the windows
trend can be downward or upward,                             (Olujimi and Bello, 2009);
horizontal or vertical depending                             nearness to worship centres‟
on the series of related changes                             (Iroham, Oloyede and Oluwunmi,
that are identified and projected                            2011) amongst others. Specifically
into a plausible future. When such                           for commercial properties certain
trends are based on rental values                            factors do abound as revealed in
then the observation will be                                 previous studies. Such factors
confined to any evident changes in                           include average floor area and
rent patterns. Rents passing on                              number of rooms (Slade, 2000);
properties are bound to be                                   changes in floor space and prime
influenced variedly due to the                               lending rates (Chin, 2003); size of
heterogeneity of real estate. These                          sales facility (Kivilahti and
factors range from intrinsic to                              Viitanen, 2006); neighborhood
extrinsic characteristics. They                              and      physical     characteristics
include closeness to high-rise                               (Marco, 2007). From these
office    buildings     (Thibodeau,                          backdrops these requisite factors
1990); accessibility (Ball, Lizieri                          have to be continually evident for
and MacGregor, 1998); location,                              properties to keep commanding
size, structural characteristics                             attractive rents that will generate
(Tay, Lau and Leung, 1999;                                   an impressive trend/pattern from
McCluskey, Deddis, Lamont, &                                 the stance of investors over a
Borst, 2000); proximity to rail and                          given period of time. Rising rents
park (Jensen and Durham, 2003);                              have been described as an
provision of balconies (Chau,                                attraction for rental real estate
Wong, , and Yiu, 2004); proximity                            development as prospect of rental
to open space (Anderson and                                  growth is also an important
West, 2005); location of dams                                viability consideration. In addition
(Provencher,      Sarakinos,    and                          rental growth rates combined with

                                                                                                                 11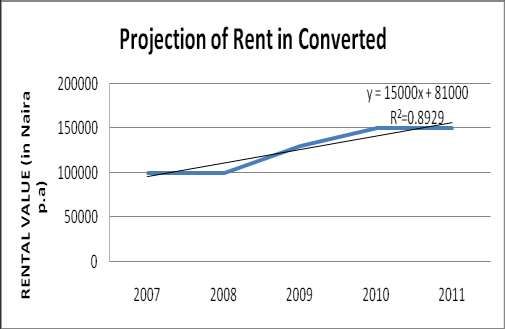
Covenant Journal of Research in the Built Environment (CJRBE) Vol. 1, No. 1 (Maiden Edition), June, 2014.
occupancy levels are being Akure which was hither to sprawl
regarded as major long run with residential structures. Three
determinants of property income types of commercial properties
(Mueller, 1999). including purpose-built office
space, converted office space and
Changes in rent invariably affect
shopping complex are evident in
every type of real estate although
the study area. As a fast growing
in varying degrees. It appears that
arena for commercial activities
these changes are more evident in
investors could be faced with the
commercial properties. This
decision on which of the type of
perhaps is due to the fact that
property to invest their hard
these properties are majorly built
earned income. This study is
for business transactions and as
thereby geared towards leading
the name implies could easily be
investors aright on the best
prone to varying economic warp.
decision of investment to make
Commercial property which could
amongst the three property types
come in form of office space,
for earliest recoupment of
malls, retail stores, shopping
investment.
centers, banks amongst others has
an important role in real estate Hence the basic research questions
markets. Its importance can be designed are to seek the opinion of
related to three different factors: respondents through direct
First, as a factor of production, statements contained in the
commercial property provides the questionnaire on certain aspects of
space to house the activities of the study:
business and industry. Second, as What are the rental values
a financial asset, commercial of the various types of
property constitutes a significant commercial properties
part within asset markets. Third, along Oyemekun Road,
as an investment medium, it Akure between the years
provides revenues to its holders 2006 and 2011?
based on value (Ustaoğlu, 2003). What are the trends in the
These characteristics make rental values of these
commercial property attractive for properties?
investors. Hence, any painstaking Which of these properties
process in monitoring rental has the highest trend in
movements over the years is worth rental values over the
the while. years?
Perhaps these grandiose attributes Is there any significant
commercial properties offer have difference in the rental
resulted to a plethora of such values passing on these
investment in Oyemekun Road, properties?
15
12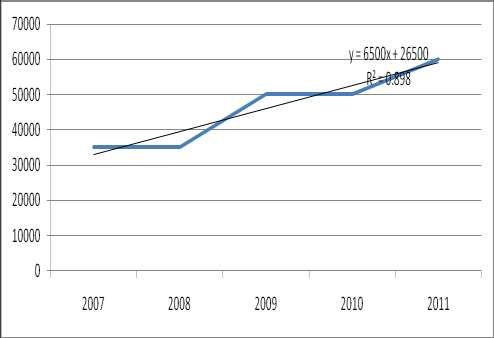
Covenant Journal of Research in the Built Environment (CJRBE) Vol. 1, No. 1 (Maiden Edition), June, 2014.

                                                             rent increases (indicating rent
2. Earlier Works on Trends in                                drift) could be found. Evidence
Property Values                                              was found to support the existence
According to Nwuba (2008), the                               of such rent drift. This rent drift
need to analyse the movement of                              has also been discovered in
rents is premised on the fact that it                        commercial real estate rents in
would aid entrepreneurs in their                             similar research conducted in
planning and cash flow projections;                          Hong Kong (Brown and Chau,
assist developers in investment decision                     1997) and Australia (Beer, 1999).
making; useful to real estate                                However, a later research in Hong
professionals in appraisals and                              Kong, Dahoa (2003), discovered
evaluation of proposed development                           that after a peak reached in 1997
projects; as well as provide information                     there was a drop of 66.9% and
for researchers. A number of studies                         48.7% respectively in House Price
have been carried out on rental                              Index      and    Rental     Index
movements. In the United States,                             respectively. The situation in
Mueller (1999) using asking rents                            Scotland is quite different as no
and average rental growth rate,                              regular trend in office rents was
evaluated rental growth rates in                             observed. However, there were
the physical real estate cycle and                           fluctuations particularly between
found that national average                                  1987 and 2002 (Langdon and
growth rates at each point in the                            Everest, 2003).
cycle were statistically different.                          Scott and Judge (2000) examined
Bjorklund       (1999)        studied                        the     cyclical   behaviour      in
residential rent between 1990 and                            commercial property values in the
1997 in Stockholm from an                                    UK between 1956 and 1996 using
investor‟s point of view. With the                           a     structural    times     series
use of rent equations, estimations                           (unobserved            components)
were conducted to analyse                                    approach. The study incorporated
whether or not rent levels varied                            influence of the transition to short
between locations holding other                              rent reviews during the late 1960s
rent-affecting variables (age and                            and the short and long-term
improvement) constant. It was                                impacts of the 1974 and 1990
discovered it varies. The study                              property crashes in the analysis,
also entailed a comparison                                   via dummy variables. It was found
between annual increases in the                              that once these variables were
effective rent charged for privately                         taken into account a fairly regular
owned residential properties and                             cyclical pattern can be discerned
the official increases set via                               within a period of about 7 to 8
official       negotiation        for                        years. Furthermore, the 1974 and
municipality owned residential                               1990 property crashes were shown
housing to see whether excessive                             to have had a major long-term

                                                                                                                 13
Covenant Journal of Research in the Built Environment (CJRBE) Vol. 1, No. 1 (Maiden Edition), June, 2014.
impact on property value growth recent financial crises in
(presumably via their influence on developed economies, the results
investors‟ expectations). of stress-testing exercises and the
Shipley (2000) embarked on a current historically high share of
research that was designed to commercial property-related
examine the assertion that historic lending to private non-financial
designation of properties, under corporates. Observation made
the heritage legislation in reveals that over the period 2003
Canada‟s largest province, has a to 2006, there was a large increase
negative impact on the values of in capital values in the Irish
those properties. The actual selling commercial property market
price of subject properties was without a correspondingly large
used to establish their value increase in rents. Consequently,
history trends, which were then income yields on all types of
compared to ambient market commercial property reached very
trends within the same low levels in 2006. Of additional
communities. Almost 3,000 concern, from a financial stability
properties in 24 communities were perspective have been the rapid
investigated, in what is believed to rates of increase in lending for
be the largest study of its kind commercial property-related
ever undertaken in North America. purposes during the same period.
It was found that heritage The paper investigated whether
designation could not be shown to these trends were unique to
have a negative impact. In fact Ireland, and considered the extent
there appeared to be a distinct and to which the growth in
generally robust market in commercial property values can
designated heritage properties be explained by fundamental
with over 74% of such properties factors. It addressed these issues
performing well. These heritage by examining recent trends in
properties tend to be resistant to capital values and income yields
down-turns in the general market on Irish commercial property on a
as ample numbers of willing historical and international basis
buyers were prepared to pay and found that nominal income
premium for this type of property. yields have followed a general
Woods (2007) argued that downward trend since the mid-
developments in the commercial 1990s.
property market have greater Hui et al (2008) carried out a
consequences for the stability of research on building and real
the Irish financial system. This as estate index for the Hong Kong
highlighted by Woods op. cit. may residential property market. The
be especially true in the light of aim of the study was to explore
international experience regarding changes in price expectations and
14Covenant Journal of Research in the Built Environment (CJRBE) Vol. 1, No. 1 (Maiden Edition), June, 2014.
confidence of housing consumers source of data collection was
over a period of time, with the secondary through newspapers,
primary objective of developing magazines and internet,
an independent confidence index supplemented by primary data
for residential properties in Hong collection via interviews and
Kong. The building and real estate making personal visits to the
index provided an objective various real estate companies. The
resource to forecast market study revealed issues concerned
performance. It also provided an with real estate investment in the
objective tool, and a statistical country considering the past and
pointer that forecasts future present trends of rental values.
housing price trends. Cities like Delhi, Mumbai and
Jeong and Kim (2009) used a time Gurgaon experienced a 20-25%
series analysis and a shock- jump in their rental values because
response analysis of the vector of the demand for independent
auto regression (VAR) model to houses by majorly corporate
find the trends in retail rents in sectors who rent such houses for
South Korea. The data of retail their senior executives. Even
rent series were compiled by three though commercial lease
institutions (the Bank of Korea - agreements specify a 15%
BOK, the Kookmin Bank, and the escalation in the real estate rental
Korea Statistic Office) from in every three years, the present
January 1995 to February 2008. cause of real estate boom in India
was injection of foreign funds by
The long-term trends in retail rents the government into
showed that they continued to rise infrastructures like hotels,
in general but there was a short shopping malls, large-scale
sluggish period. The researcher residential complexes in new
discovered that retail rents had a townships, InfoTech parks and
positive relationship with office special economic zones in order to
rents, property management attract higher investments. The
expenses, consumer price index, growth in the real estate sector
and housing deposit-basis lease was discovered to be between 25-
value (chonsei), but negative 30% for residential, 10-15% for
relationship with interest rate. commercial and agriculture
Singh and Komal (2009) in their sectors.
study of the prospects and Briggs and Ng (2009) in their
problems of real estate in India; study of trends and cycles in New
surveyed 50 major players in the Zealand house prices sought to
real estate field. The study focused find the trend level of house prices
on commercial real estate and identifying the anchor or
investment in India. The principal attractor for house prices, and look
15Covenant Journal of Research in the Built Environment (CJRBE) Vol. 1, No. 1 (Maiden Edition), June, 2014.
at whether it was possible to respectively. Each interview
identify a long run equation that which lasted a minimum of 30
describes the trend in house minutes was based on the
prices. The study linked house following research question: to
prices to household income what extent has structural change,
suggesting that other factors caused by the state-led economic
besides interest rates such as tax transition, affected the
treatment of rental properties and performance and the stability of
an increase in the proportion of the emerging office market as
rental properties are also behind reflected by market-led cyclical
the rise in the trend in house fluctuations? The interview
prices. Certain factors including process undertaken between 2004
increases in section prices and the and 2007 was centered on five
cost of construction would have an themes developed based on the
impact on the cost of existing research question: Markets and
houses as well as new houses. cycles since the 1990s; what
Other factors include increased changes have occurred?
access to credit following Information (data) availability and
financial deregulation, and a quality; how this was structured?
higher propensity on the part of Factors affecting commercial
households to borrow. property markets; Government
Wu et al. (2009) used interview policy and office markets - the
data to explore and examine analysis: e.g. Market vs. State
property markets in three Chinese policy, which one is the main
cities with the focus placed on the driver? Also there was a search for
emergence of the commercial the future prospect and market
property markets and the maturity. The work identified
government-market interplay, varying opinions and perceptions
noting the market formation among key stake-holders about
process and cycles that are cycles in China‟s emerging
„unexpected‟ in a transitional commercial property markets.
economy. Interviewees were Interviews in the three cities
selected with the intention to suggested a spectrum of factors
cover the core elements of the that may substantially affect the
property submarket. The sampling stability of China‟s office markets.
was not random because the A cross-sectional comparison of
information sought-after was not the three cities did reveal a similar
evenly distributed in the society. pattern of cyclical behaviour
A total of 27, 19 and 26 semi- highlighting structural change and
structured interviews were state intervention with leads-and-
conducted in Guangzhou, lags, in spite of the dispersion in
Chongqing and Beijing geography, culture and market
16Covenant Journal of Research in the Built Environment (CJRBE) Vol. 1, No. 1 (Maiden Edition), June, 2014.
maturity. The various views between the rental growth rates
offered about market mechanism and CPI inflation rates. The results
and cyclical behaviour represented showed that office rents
varying levels of market maturity. maintained upward trend during
These brief insights offer an the study period but the growth
opportunity to develop an rates were lower than general
alternative approach to measure inflation rates. Rental growth rates
property market conditions in were statistically significant, but
emerging or immature markets no significant difference existed
such as China by looking at between the growth rates and
market stakeholder perception inflation rates. There was a strong
based on the notion that market positive linear relationship
can be partially driven based on between time and office rents
perception i.e. market are not movement, which could be an
100% efficient. indication that office rents grow
significantly over time. Also,
The Nigerian Experience
Although studies on rental trends Idudu (1989) and Omuojune
in Nigeria are relatively sparse, (1994) in related studies on trends
certain contributions need to be in rental values observed that
acknowledged. Nwuba (2004) in a urban rents in Nigeria have
study involving differences in maintained upward movements in
house rent in various locations in the previous two decades.
Kaduna between 1986 and 2004 In Ikeja, Lagos State, due to the
shows the existence of house rent rate of increase in rental values of
inflation rates which was commercial properties along each
discovered to be statistically arterial road which has become
significant amongst these areas. unpredictable leading to inability
Nwuba and Adeagbo (2007) as a of Estate Surveyors and Valuers to
follow-up on this research found a accurately predict its trend, Oni
steady rise in house rents index in (2009) focused on determining
Kaduna during the same period. In spatial distribution and deriving
the succeeding year, Nwuba models for predicting the trend of
(2008) evaluated office rental the values. In doing so, data
movements in the Central Area of (rental values over a period of 5
Abuja, Nigeria, between year years, 2003-2007) were collected
2000 and year 2007, with a view by interviewing Estate Surveyors
to measuring the rental growth and Valuers and occupiers of
rates. The basic questions commercial properties in the study
determined were whether the area, analyzed using polynomial
rental growth rates were regression models and spatial
significant, and whether distribution of commercial
significant difference exists property values along the arterial
17Covenant Journal of Research in the Built Environment (CJRBE) Vol. 1, No. 1 (Maiden Edition), June, 2014.
roads were depicted on a Value the researchers also embarked on
Map. Models were also derived to participants‟ observation of the
assist Estate Surveyors and properties in the area to know the
Valuers, real estate developers and number of commercial properties
financiers in predicting accurately in the area. The method used in
future values of commercial analyzing the data includes
properties along the arterial roads frequency distribution as well as
in the study area. other techniques. The collected
The studies so far have been in- data was arranged, tabulated and
depth however there was no presented to allow for meaningful
nudging for investors in making analysis and interpretation. The
decision amongst given data of the frequency table was
alternatives particularly amongst presented using diagrams, charts
the Nigerian researchers. This and graphs, in addition to the
present study takes a leap in this simple linear regression models of
direction. Microsoft Excel. Data was
processed by coding using the
Methodology Statistical Package for Social
The methods are principles Sciences (SPSS) software in
underlying any given research determining any statistical
which logically involves obtaining significance amongst the three sets
information via peculiar field of rental values by the use of the
work, data collection, sample size Analysis of Variance (ANOVA)
and frame, sampling procedure, coupled with the Tukey post-hoc
data requirements through primary test at the 95% confidence level.
sources and secondary sources and
method of data analysis. The 3. Findings and Discussions
methodological framework used to The administration of
attain the stated aim and questionnaire to Estate Surveyors
objectives of the study are and Valuers was carried out
examined, also the type and personally, and the various
sources of data examined are responses were subsequently
usually along the procedure analyzed using the Statistical
employed. package for social science (SPSS)
software. Twenty-two (22) copies
This is a cross-sectional research of questionnaire were distributed
that entailed the survey of the to the firms of practicing estate
entire 22 Estate Surveying Firms surveyors and valuers in Akure.
in the study area. The major Nineteen completed
instrument for data collection of questionnaires were returned
this study is questionnaire for resulting to a response rate of
Estate Surveyors and Valuers 86%. This was found substantial
involved in the study. However, for convincing analysis.
18Covenant Journal of Research in the Built Environment (CJRBE) Vol. 1, No. 1 (Maiden Edition), June, 2014.
In achieving the objective of this grouped into Purpose-built office
study, the researchers embarked space, Converted office space and
on a participant observation of all Shopping Complex. The
commercial properties in the area. frequency distribution of the three
It was observed that the types of commercial properties are
commercial properties were given in Table 1.
Table 1: Frequency Distribution of Commercial Property along
Oyemekun Road
S/N Type of Office Percentage
1 Purpose-built 40
Frequency 31.0
2 Converted 70 53.0
3 Shopping Complex 21 16.0
Total 131 100
Source: Authors’ Field Survey, 2012
From Table 1, it can be seen that study area, Oyemekun was mainly
converted office space ranked the of residential use before
highest type of commercial commercial activities evolved and
property found in the area, demand for office spaces
constituting about 53% of the total encouraged owners to convert to
number of properties along offices. However, the respondents
Oyemekun Road. This indicates asserted that they have more of
that the type of office spaces shopping complexes under their
mostly common in the study area management portfolios as shown
is the converted office space. The in Fig. 1
Fig. 1: Pie Chart Showing Percentages of Commercial Properties
managed along Oyemekun Road.
19Covenant Journal of Research in the Built Environment (CJRBE) Vol. 1, No. 1 (Maiden Edition), June, 2014.
Figure 1 shows the percentage of managed. However, the shopping
commercial properties available in complex which is the least in
the respondents‟ management number happens to be the most
portfolio. During the course of the managed.
field survey the researchers Rental values of the various
discovered that most of the types of commercial properties
converted office spaces were not along Oyemekun Road, Akure
being managed. As a result, most between the years 2006 and 2011
estate firms do not have converted The study period of between year
office spaces in their management 2006 and year 2011 reveals that
portfolio. Hence, of the 70 the average rental values per
converted office spaces in the annum of these commercial
study area only 13 are being property types are as shown in
Table 2.
Table 2: Average Rental Values of Commercial Properties
S/N Office Space 2007 2008 2009 2010 2011
1 Purpose-built 195,000 240,000 240,000 300,000 300,000
2 Converted 100,000 100,000 130,000 150,000 150,000
Office
3 Shopping 35,000 35,000 50,000 50,000 60,000
Complex
Source: Authors’ Field Survey, 2012
Trends in the rental values of the commercial properties along
Oyemekun Road, Akure
From the average rental values of the different commercial properties
within the area obtained, the trend in the commercial property values were
obtained and shown in Figure 2
20Covenant Journal of Research in the Built Environment (CJRBE) Vol. 1, No. 1 (Maiden Edition), June, 2014.
350000
300000
250000
200000 Purpose-built
150000 Converted
100000 Shopping Complex
50000
0
2007 2008 2009 2010 2011
source: Authors field survey 2012
Figure 2: Trends in Rental Values of Commercial Properties
The future trend was considered using linear regression analysis for each of
the properties in the study area with time as the independent variable to
explain how the rental values of these properties vary with time. The
graphic details below elucidate better:
Table 3: Rent paid for Purpose-built Office from 2006-2011
S/N Office Space 2007 2008 2009 2010 2011
1 Purpose-built 195,000 240,000 240,000 300,000 300000
Fig 3: Trend in Purpose-built Properties
21Covenant Journal of Research in the Built Environment (CJRBE) Vol. 1, No. 1 (Maiden Edition), June, 2014.
Table 4: Rent paid for Converted Office Space from 2006-2011
S/N Office Space 2007 2008 2009 2010 2011
1 Converted 100,000 100,000 130,000 150,000 150,000
Fig 4: Trend in Converted Office Space
Table 5: Rent paid for Shopping Complex from 2006-2011
S/N Office Space 2007 2008 2009 2010 2011
1 Shopping 35,000 35,000 50,000 50,000 60,000
Complex
Fig 5: Trend in Shopping Complex
Source: Authors’ Field Survey 2012
22Covenant Journal of Research in the Built Environment (CJRBE) Vol. 1, No. 1 (Maiden Edition), June, 2014.
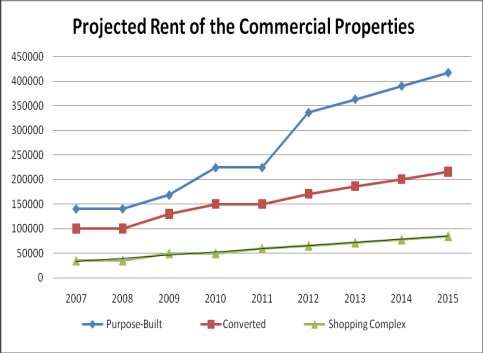
Commercial properties with the by which the variation in outcome
highest trend in rental values of the dependent variable can be
over the years in the study area accounted for by the independent
From the projections seen in the variable. The R2 of the three
following linear equation as commercial properties as shown in
follows the graph above are as follows:
Y= A + Bx Purpose-built office space = 0.9;
This can aid in projecting future Shopping Complex = 0.8989;
rental income Converted Office Space = 0.8929.
Where: Although the high R2 value of the
Y= the calculated or estimated three commercial property types
value for the dependent variable indicate a very strong positive
(projected rent) relationship between time and
rents, from above it can be seen
A= the Y intercept, the theoretical
that the R2 of the purpose–built
value of Y when X=0
office space is the highest among
B= the slope of the line, the
the three commercial properties.
change in Y is divided by the
Therefore, it is the property whose
change in X, the value by which Y
rental values can be most
changes when X changes by 1.
ascertained with each successive
X= the number of years projected
year under study. Hence, it implies
for.
that about 90% of the variation in
Therefore, from the graph above,
rent of purpose-built office space
it is evident that the following R2
is explained by variation in time in
applies to the linear equation for
the model, making it the property
the various commercial properties.
with the highest trend over the
R2 in regression analysis
years as revealed in Fig 6
represents the level of relationship
23Covenant Journal of Research in the Built Environment (CJRBE) Vol. 1, No. 1 (Maiden Edition), June, 2014.
Fig 6: Projected Rent of the Commercial Properties
Significant difference in the rental values passing on the properties in
the study area
An Analysis of Variance (ANOVA) was conducted to discover if this
difference in rental values is quite significant. Results from the SPSS
analysis produced the following relevant Tables (6-8).
Table 6: Descriptive
Rent
95% Confidence Interval for
Mean
N Mean Std. Deviation Std. Error Lower Bound Upper Bound Minimum Maximum
pur 5 45000.00000 20124.61180
255000.0000 20124.61180 310874.8799 310874.8799 310874.8799
con 5 25099.80080
126000.0000 11224.97216 11224.97216 157165.5190 157165.5190 157165.5190
sho 5 46000.0000 10839.74169
4847.67986 4847.67986 59459.3170 59459.3170 59459.3170
Total 15 93462.49566 24131.91261 24131.91261 194091.1383 35000.00 300000.00
142333.3333
24Covenant Journal of Research in the Built Environment (CJRBE) Vol. 1, No. 1 (Maiden Edition), June, 2014.
Table 7: ANOVA
Rent
Sum of
Squares df Mean Square F Sig.
Between Groups 1.112E11 2 5.560E10 60.164 .000
Within Groups 1.109E10 12 9.242E8
Total 1.223E11 14
Table 8: Multiple Comparisons
Dependent Variable:Rent
(I) 95% Confidence Interval
propert (J) Mean Difference
y property (I-J) Std. Error Sig. Lower Bound Upper Bound
Tukey pur con 1.29000E5 19226.71752 .000 77705.7390 180294.2610
HSD sho 2.09000E5 19226.71752 .000 157705.7390 260294.2610
con pur -1.29000E5 19226.71752 .000 -180294.2610 -77705.7390
sho 80000.00000* 19226.71752 .003 28705.7390 131294.2610
sho pur -2.09000E5 19226.71752 .000 -260294.2610 -157705.7390
con -8.00000E4 19226.71752 .003 -131294.2610 -28705.7390
Games- pur con 1.29000E5 23043.43724 .003 59168.2601 198831.7399
Howell sho 2.09000E5 20700.24154 .001 138654.7866 279345.2134
con pur -1.29000E5 23043.43724 .003 -198831.7399 -59168.2601
sho 80000.00000* 12227.01926 .002 41344.5229 118655.4771
sho pur -2.09000E5 20700.24154 .001 -279345.2134 -138654.7866
con -8.00000E4 12227.01926 .002 -118655.4771 -41344.5229
*. The mean difference is significant at the 0.05 level.
We can see from the output of the contains the results of Tukey post-
ANOVA analysis that there is a hoc tests is referred.
statistically significant difference We can see from the table below
amongst the means of the various that there is a significant
types of commercial property in difference in rental values
the study area. We can see that the amongst the various types of
significance level is 0.000 (p = properties. For instance, the rental
.000), which is below 0.05. values between the purpose built
Therefore, there is a statistically commercial properties and
significant difference in the mean converted shops is significantly
rent collected on these properties. different (p=0.000); likewise the
However, in order to know if the rental values between purpose
difference cuts across the three built properties and shopping
property types, the “Multiple complex (p=0.000). The rental
Comparisons Table” which difference is also evident between
25Covenant Journal of Research in the Built Environment (CJRBE) Vol. 1, No. 1 (Maiden Edition), June, 2014.
the converted shops and shopping Conclusion
complex (p=0.003). The converted office space which
In a nutshell, it is revealed that happens to be the most evident
there is a statistically significant amongst the commercial
difference in the rental values properties already reveals the
amongst the three types of status of the study area as
commercial properties in the study residential base in time past. The
area as determined by one-way shopping complex on the other
ANOVA (F(2,12) = 60.164, p = hand being the most
.000). A Tukey post-hoc test professionally managed reveals
revealed that the rental values are the status of this type of
statistically significantly different commercial investment when
as follows: purpose built compared to others. Although the
commercial property (N255, 000 three sets of properties have quite
±N45, 000, p = .003); Converted high R2 values, that of purpose
Shops (N126, 000 ± N25, 099.80, built office space recorded the
p = .000) and Shopping Complex highest and also in rental values.
(N46, 000 ± N10, 839.74, p There is therefore the need for
=.000). Hence, the difference in investors and professional
rental values is quite glaring with managing agents to devote much
purpose built shops showing the effort to the investment in
most prospects in rental values. purpose-built office space, in the
area of development and
management respectively, so as to
maximize returns on investment.
References: Bjorklund, K. (1999) Real Estate
Anderson, S.T. & West, S.E. Performance: Five Essays.
(2006) Open Space, Residential Doctoral dissertation,
Property Values, and Spatial Department of Real Estate and
Context. Regional Science and Construction Management,
Urban Economics, 36(6), 773- Royal Institute of Technology,
789. Stockholm.
Beer, A. (1999) Housing Briggs, P., and Ng, T. (2009)
Investments and The Private Trends and Cycles in New
Rental Sector in Australia Urban Zealand House Prices, a Paper
Studies 36(2), 255-269 for CHRANZ Workshop
Ball, M.; Lizieri, C. and Brown, G. and Chau, K. W. (1997)
MacGregor, B. D. (1998) The "Excess Returns in the Hong
Economics of Commercial Kong Commercial Property
Property Markets, Routledge, Market" Journal of Real Estate
402 pp., ISBN 0-415-14992-4 Research, 14(2), 91-106.
26Covenant Journal of Research in the Built Environment (CJRBE) Vol. 1, No. 1 (Maiden Edition), June, 2014.
Chau, K. W., Wong, S.K., and Yiu, Cities in the United States PhD
C.Y. (2004) The Value of the Thesis Submitted to the
Provision of a Balcony in Department of Urban Studies
Apartments in Hong Kong. and Public Affairs, Levin
Property Management, 22(3), College of Urban Affairs,
250-264. Cleveland State University.
Chin, W.H (2003) Macroeconomic Iroham, C.O., Oloyede, S. A. and
Factors Affecting Office Rental Oluwunmi, A. O. (2011) An
Values in Southeast Asian Analysis of the Location of
Worship Centers on Residential
Cities: The Case of Singapore, Property Values in Ota, Nigeria,
Hong Kong, Taipei, Kuala Journal of Sustainable
Lumpur, and Bangkok, Paper Development in Africa 13(1);
presented at 2003 PRRES 14-22
Conference, Brisbane, Australia. Jensen, D. and Durham, J. (2003)
Dahoa, D. (2003) Accessing Hong The Property Value Effects of
Hong‟s deflationary Trend the South Ridegline rail.
Accessed February 14, 2004 Retrieved from:
from http://economics.uoregon.edu/ho
http://www.ctctrade.com/econfor nors-
um /boc031001.htm papers/2003/Ridgeline%20paper
Dehring, C.A., Depken, C.A., and .pdf on February 2, 2010
Ward, M.R. (2007) The Impact Jeong, and Kim (2009) A Study of
of Stadium Announcements on Retail Rents with VAR Model
Residential Property Values: (in South Korea), Paper
Evidence from a Natural presented at the
Experiment in Dallas-Fort Pacific Rim Real Estate Society
Worth. Contemporary Economic Conference, Sydney, Australia,
Policy, 25(4), 627- 638 18 – 21 January
Idudu, O. J. A. (1989). Kivilahti, A., and Viitanen, K.
Mobilisation of Private and (2006) Dynamics of the
Public Investments in Property Commercial Property Markets in
Development. Paper Presented Finland, Shaping the Change
at the 19th Annual Confeence of XXIII FIG Congress, Munich
the Nigerian Institution of Estate Germany.
Surveyors and Valuers in Lagos, Langdon and Everest (2003)
6th – 9th April, 1989 Analysis of Historical
Ijla, A.M. (2008) The Impact of Construction Costs Movements
Local Historic Designation on in Scottish Social Housing: Final
Residential Property Values: An Report, Assessed on May 31
Analysis of Three Slow-growth 2013 from
and Tree Fast-growth Central
27Covenant Journal of Research in the Built Environment (CJRBE) Vol. 1, No. 1 (Maiden Edition), June, 2014.
http://www.scotland.gov.uk/Pub Quantity Surveyor, 55(2), 24 –
lications/2004/06/19127/34780 30
Lee, K. (2008) Foreclosure Price- Nwuba, C. C. (2008). Analysis of
Depressing Spillover Effects on Office Rent Movement in
Local Properties: A Literature Abuja, Nigerian Journal of
Review. Public and Community Education 7(1), 1-11
Affairs Discussion Paper 2008-1 Olujimi, J. A. and Bello, M. O.
Federal Reserve Bank of Boston (2009). Effects of Infrastructural
Leung, F., Chow, K. and Han, G. Facilities on the Rental Values
(2008) Long-Term and Short- of Residential Property, Journal
Term Determinants of Property of Social Sciences 5(4), 332-341,
Prices in Hong Kong, Working 2009
paper Hong Kong Monetary Omuojine E. O. (1994). Property
Authority, October 2008. Market in Nigeria: Analysis and
Marco, L. (2005) Determinants of Perspective. The Estate
New York City Residential Surveyor and Valuer, 18(1), 15 -
Rental Prices The Michigan 21.
Journal of Business, 3(2), 61-83. Oni, A. O. (2009) Developing
McCluskey, W.J., Deddis, W.G., Predictive Models of
Lamont, I.G., and Borst, R.A. Commercial Property Values in
(2000). “The Application of Emerging Economy: Case Study
Surface Generatedinterpolation of Ikeja, Nigeria, Paper
Models for the Prediction of Delivered at the 9th
Residential Property Values. International Conference
Journal of Property Investment organized by African Real
& Finance, 18(2), 162-176. Estate Society Held at Lagos
Mueller, G. R. (1999). Real Estate Oriental Hotels, Lekki, Nigeria
Rental Growth Rates at 20th – 23rd October,
Different Points in the Physical Provencher, B., Sarakinos, H., and
Market cycle, Journal of Real Meyer, T. (2006). Does Small
Estate Research 18 (1), 131-150 Dam Removal Affect Local
Nwuba, C. C. (2004). An Analysis Property Values? An Empirical
of Location Differences in Analysis, University of
Trends in House Rents in Wisconsin-Madison Agricultural
Kaduna, Nigeria, 1986-2003 The & Applied Economics Staff
Estate Surveyor and Valuer, Paper Series.
27(1), 64-71 Scott, P. and Judge, G. (2000)
Nwuba, C. C. and Adeagbo, D. O. Cycles and Steps in British
(2007).The Relationship Commercial Property Values,
between Housing Construction Applied Economics, 32, 1287-
Costs and House Rents Trends 1297
in Kaduna, Nigeria. The
28Covenant Journal of Research in the Built Environment (CJRBE) Vol. 1, No. 1 (Maiden Edition), June, 2014.
Shipley, R. (2000) Heritage Buildings on Residential
Designation and Property Property Values, Land
Values: Is there an Effect? The Economics, 66(4), 402-408.
International Journal of Ustaoglu, E. (2003) Hedonic Price
Heritage Studies, 6(1), 1-18. Analysis of Office Rents. A
Singh, V., and Komal (2009) Case Study of the Office Market
Problems and Prospects of Real in Ankara A Thesis submitted to
Estate in India International the Graduate School of Social
Research Journal of Finance Sciences of Middle East
and Economics, Issue 24, 243- Technical University
254. Woods, M. (2007). A Financial
Slade, A. (2000) Office Rent Stability Analysis of the Irish
Determinants during Market Commercial Property Market.
Decline and Recovery. Journal Financial Stability Report. 75-
of Real Estate Research, 20(3), 90.
358-380. Wu, H., Wong, S.K., Mckinnell,
Tay, R. S., Lau, C. K. and Leung, K., Reed, R., and Robinson, J.
M. S. (1999) The Determination (2009) Commercial Property
of Rent in Shopping Centers: Markets and Property Cycles in
Some Evidence from Hong Chinese Cities, A paper
Kong, Journal of Real Estate delivered at the 15th Pacific Rim
Literature, 7(2), 183-196 Real Estate Society Conference
Thibodeau, T.G. (1990) Estimating Sydney, Australia .
the Effect of High Rise Office
29You can also read