What's in a Linked List? A Phenomenographic Study of Data Structure Diagrams
←
→
Page content transcription
If your browser does not render page correctly, please read the page content below

Paper ID #32913

What’s in a Linked List? A Phenomenographic Study of Data Structure
Diagrams
Morgan M. Fong, University of Illinois, Urbana-Champaign
 Morgan M. Fong is a Ph.D. student in the Department of Computer Science at the University of Illinois,
 Urbana-Champaign and an NSF Graduate Research Fellow. Prior to starting her Ph.D. Morgan completed
 her B.A. in Computer Science at the University of California, Berkeley. She is broadly interested in how
 people learn computer science with a focus on creating inclusive learning environments.
Seth Poulsen, University of Illinois at Urbana-Champaign
 Seth Poulsen is Ph.D. student in Computer Science at University of Illinois at Urbana-Champaign and an
 NSF Graduate Research Fellow. Before beginning his Ph.D. he completed a Bachelors degree in Math-
 ematics at Brigham Young University and worked as a Software Engineer at Amazon.com. His research
 interests include using technology to help students learn to write mathematical proofs, educational data
 mining, and computing and math education more broadly.
Dr. Geoffrey L. Herman, University of Illinois at Urbana-Champaign

 Dr. Geoffrey L. Herman is a teaching associate professor with the Deprartment of Computer Science
 at the University of Illinois at Urbana-Champaign. He also has a courtesy appointment as a research
 assistant professor with the Department of Curriculum & Instruction. He earned his Ph.D. in Electrical
 and Computer Engineering from the University of Illinois at Urbana-Champaign as a Mavis Future Faculty
 Fellow and conducted postdoctoral research with Ruth Streveler in the School of Engineering Education
 at Purdue University. His research interests include creating systems for sustainable improvement in
 engineering education, conceptual change and development in engineering students, and change in faculty
 beliefs about teaching and learning.

 c American Society for Engineering Education, 2021
What’s in a Linked List? A Phenomenographic Study of Data
 Structures Diagrams
Introduction

Data structures are required topics in computer science (CS) curricula [1] and have semi-
canonical diagrams that encode information spatially. Linked lists are an example of a data
structure: they are commonly represented using spatially oriented diagrams (e.g., nodes moving,
pointers pointing), and are generally taught in the first or second years of CS curricula. Spatial
ability strongly correlates with and predicts success in early CS [2]–[6], playing a gatekeeping
role, but little is known about why. Thus, studying linked list diagrams may provide an avenue to
explore the relationship between CS content and spatial ability. However, to the best of our
knowledge, there is no formal documentation on how instructors represent linked lists or how
those representations are used. Much of the existing literature focuses on visualizers (e.g., Online
Python Tutor [7], CSTutor [8]), and these visualizers impose diagram standards onto their users.

Informally, we have seen a variety of diagrams for illustrating linked lists that vary in what
information is made explicit or kept implicit. Likewise, in conversations with colleagues, we
have had many discussions about our perceptions of the affordances and drawbacks for different
styles of diagrams. We are not aware of any studies that have sought to systematically document
the parameter space for these diagrams and how that parameter space is used. By documenting
the parameter space, we can more formally interrogate whether different styles of diagrams
affect student learning, particularly as it pertains to spatial ability and the science of diagrams
and reasoning. We take our first steps toward creating this foundation for future research by first
analyzing freely available instructional videos on linked lists from YouTube™ and by asking the
following research questions:

 RQ1: What is the parameter space of diagrams YouTubers use when discussing linked lists?
 RQ2: How do YouTubers change these diagrams when used to illustrate algorithms?

Literature Review

Diagrams and Reasoning

Diagrams can help offload cognition [9] and are frequently used to reason about abstract data
structures. Using diagrams leads to a variety of common metaphors and imagery that are visually
easier to reason about than code or low-level memory models (e.g., an array is a contiguous set
of boxes). Thus, instructors and students alike often sketch or visualize diagrams when designing
algorithms, leading to spatially oriented tasks (e.g., transposing matrices). However, this
presents a natural problem for low spatial ability students who may have difficulty visualizing
diagrams and their manipulations.

For a diagram to be useful, the diagram needs to make important concepts explicit in its features
and be clear in what its features can or cannot do. As students progress and gain more
knowledge, their domain expertise helps guide their attention and fill in implicit information.
Hegarty [10] argues that when presented with instructional diagrams, a novice’s attention is
focused on perceptually salient diagram features (e.g., high contrast shapes or colors).
Unfortunately, what a novice might consider perceptually salient may not be conceptually
important, and what an instructor may consider conceptually important may not even be present.
Hegarty, Canham, and Fabrikant [11] studied perceptual salience in weather maps and found that
pre-training participants, who viewed either pressure-salient or temperature-salient weather
maps, were equally accurate on pressure-related tasks. After training, all participants improved
accuracy on the same pressure-related tasks, but participants who viewed pressure-salient maps
post-training outperformed participants who viewed temperature-salient maps post-training. This
finding highlights not only the importance of making task-relevant features salient, but also
helping diagram users to process these task-relevant features. Johnson-Glauch, Choi, and
Herman [12] found that students failed to use knowledge they possessed when there was not an
explicit feature in the diagram indicating to use that knowledge. Additionally, the design of
diagrams can hinder learning. Johnson-Glauch et al. [12] also found that students conflated
different concepts when both represented arrows. Similarly, Heiser and Tversky [13] found that
arrows in mechanical diagrams can communicate multiple meanings (sometimes simultaneously)
such as sequential steps or path of motion. Based on these findings, we speculate arrows in
linked data structure diagrams may have multiple meanings depending on how they are used.

Despite the prevalence of diagrams in a data structures context and the existing literature on
diagram design, we lack an understanding of what kinds of diagrams are used in the classroom.
Mazumder, Latulipe, and Pérez-Quiñones [14] studied variable, array, and object diagrams in 15
Java textbooks and found that many diagrams were not explanative in terms of system topology
or behavior. However, they did not explicitly document the variance of the diagrams found.
Chotzen, Johnson, and Desai [15] found that while students appear to understand linked list
diagrams, they had difficulty understanding pointer reassignment when applied to insertion or
deletion algorithms. Thus, it is difficult to quantify which diagrams are helpful, effective, or
spatially oriented when we do not understand the parameter space for constructing diagrams.

Spatial Ability

According to Margulieux [16], spatial reasoning “is the mental processing of spatial, non-verbal
information” (p. 82), such as mental rotations and translations of objects. Spatial ability and
spatial skill refer to an individual’s upper limit and current level of spatial reasoning,
respectively. In this paper, we will use spatial ability to refer to both.

There is growing interest in spatial ability and its predictive power on students’ success in
computing. Spatial ability has been correlated with success in a number of STEM fields and
appears most important for novices [17]. In a 50-year longitudinal study, Wai, Lubinski, and
Benbow [18] showed spatial ability was a key predictor of STEM achievement and success, and
others have shown similar correlations specifically in computer science [2]–[6]. Unfortunately,
spatial ability becomes a gatekeeper to success because novices must grapple with spatial ability
in early coursework, whereas experts have built up the domain knowledge and expertise to cope
with problem-solving without relying on purely spatial means [17]–[19], similar to how experts
can fill in implicit information in diagrams. Further complicating the picture, studies have shown
a gender gap in spatial ability favoring men [20] and a socioeconomic gap favoring the wealthy
[21].
To cope with these issues, researchers have looked to interventions to bridge these gaps. In
chemistry, Stieff et. al [22] found that training students in mixed spatial-analytic problem-solving
strategies eliminated the gender gap in an introductory organic chemistry series. However,
Stieff’s interventions depended on the invariant, canonical nature of diagrams in chemistry
education, whereas computer science instructors do not agree on canonical diagram conventions
or how existing diagram conventions should be used. In engineering, Sorby and colleagues
developed a spatial ability course for low spatial ability students, resulting in significantly
improved grades in later courses and better retention rates [23], [24]. In computer science, there
have now been a few studies demonstrating that spatial ability training can help students succeed
in CS1 [2], [3], [5].

However, few studies try to tease apart the relationship between general spatial ability and less
obviously spatial, but domain-specific content. In mathematics education, Hegarty and
Kozhevnikov [25] showed the relationship between spatial ability and problem-solving strategy
when applied to word problems: students who identified spatial relationships in the problem and
drew diagrams accordingly performed better than students who did not.

Methods

We used a phenomenographic approach to capture as many diagram features as possible.
Phenomenography seeks to describe the variety of ways a group experiences and thinks about a
topic. In our case, we are interested in how a community of YouTubers conceptualizes linked
lists. Because of their prevalence in CS1/CS2-type courses (and in programming interview
question pools), we chose to focus on linked lists and expected to see a variety of diagrams. A
key advantage of linked lists is that insertion is fast relative to arrays, so we expected many
YouTubers to show diagram manipulations to explain insertion algorithms. We describe the data
collection and analysis processes below.

Data Collection

To explore the parameter space of linked list diagrams, we searched YouTube™ for video
resources. YouTubers, particularly independent creators, come from all over the world and likely
feel there is a gap in existing videos that they can fill. This leads to a high degree of variability,
maximizing our data sampling. YouTube™ provides a rich resource pool for our initial study,
which will enable more targeted data collection in the future. From the student perspective, these
free videos are helpful supplementary materials with thousands (sometimes over a million) views
and generally positive comments (top comments frequently mention that the YouTuber was
better than their university professors). While we considered searching online learning platforms
like Coursera and EdX, these platforms have accessibility issues that hinder analysis (e.g., course
materials are limited to students who enroll and are only available when the course is live).

To gather videos for analysis, we followed a literature review-style approach: we used an
Incognito tab on Google Chrome to limit search bias, agreed on keywords to use as search terms,
and pulled as many videos that used those keywords in the title of the video. To look for generic
videos covering singly linked lists, we searched for “linked list.” From this initial search, we
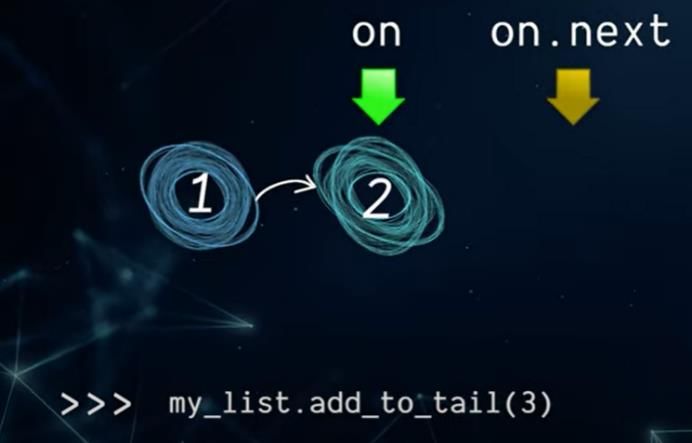
found 13 generic videos covering linked lists: Video #1 [26], Video #2 [27], Video #3 [28],
Video #4 [29], Video #5 [30], Video #6 [31], Video #7 [32], Video #8 [33], Video #9 [34],
Video #10 [35], Video #11 [36], Video #12 [37], and Video #13 [38]. From the 13 generic
videos, we decided to exclude Video #11 because the YouTuber anthropomorphized nodes as
people and described these nodes in a way that none of the coders could map consistently to
more standard linked list diagrams or conventions. Additionally, many commenters also
mentioned being confused.

After initial coding of the 13 generic videos (see next section), the last author found 5 additional
generic videos to help verify codes and resolve disagreements: Video #14 [39], Video #15 [40],
Video #16 [41], Video #17 [42], and Video #18 [43]. To look for diagrams in action during
insertion, we searched for “linked list insertion,” and found 4 videos specific to insertion: Video
#19 [44], Video #20 [45], Video #21 [46], and Video #22 [47]. Additionally, some of the
previous generic videos included clips of insertion, so these were added for analysis. For
insertion-specific videos and clips, we wanted to keep the focus on diagrams, so we only
included clips of diagram manipulation on a non-empty list example. For YouTubers who used a
diagram when illustrating insertion but implemented the algorithm in code separately, we
included a clip of their coding process for comparison. See Table 1 for a summary of videos
found.

As shown above, every video has been cited in the references, but we will refer to the videos by
a random identifier (e.g., Video #1, Video #2, Video #3) to help the reader avoid interpreting our
analysis as an evaluation or critique of individual YouTubers.

 Table 1: Categories of videos curated from YouTube™. Note: a mixture of Generic and
 Insertion-specific videos contributed to Prepend, Insert Anywhere, and Append clips.

 Video Category Search Term # of Videos
 Generic “linked list” 18
 Insertion-specific “linked list insertion” 4
 Prepend Clips N/A 7
 Insert Anywhere Clips N/A 10
 Append Clips N/A 5

Qualitative Methods

To answer RQ1, we performed inductive coding on the 13 generic videos from YouTube™.
Each author coded the videos separately, then came together and developed a code book. We
used Krippendorff’s to measure the inter-rater reliability of our code book [48]. The code book
and four, randomly selected videos were sent to an outside colleague to check the clarity of the
code book and the ability of others to apply our code book. This first external check did not yield
satisfactory reliability ( =0.42), so we revised and clarified the code book. The authors then sent
the updated codebook and the same four videos to a second colleague, reaching satisfactory
reliability ( =0.77). After a second round of refinement, the authors used the same code book to
code the 5 additional generic videos found by the last author to check our internal reliability and
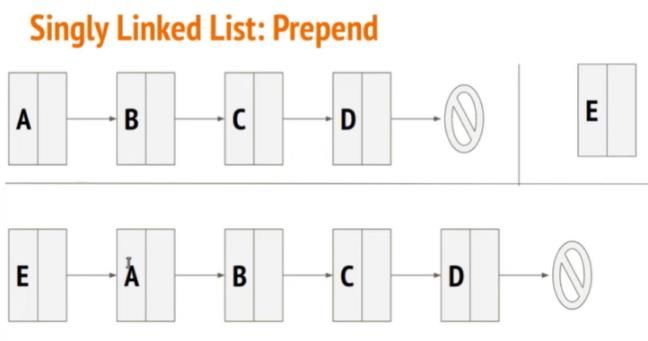
code saturation. We calculated 99.48% agreement, which suggests good interrater reliability
within the research team, and did not introduce any new codes, which suggests code saturation.

To answer RQ2, we followed roughly the same inductive coding procedure for videos on linked
list insertion. In addition to the four videos specific to linked list insertion, 9 of the 18 generic
videos included some form of insertion. The videos were then broken down into clips covering
the three different types of insertion for a linked list: prepend (insert at the beginning), insert
anywhere, and append (insert at the end). The authors inductively coded each type of insertion
separately. The codes were then grouped into categories: diagram codes, program codes, and
other codes. Program and other codes, for the most part, were the same across all three types of
insertion and reached saturation (no new codes introduced in the last 14 clips and 11 clips,
respectively). Diagram codes that were insertion type-specific also reached saturation (2 new
codes in the last 5 out of 8 clips for prepend, 1 new code in the last 3 out of 10 clips for insertion
anywhere, and 0 new codes in the last 3 out of 5 clips for append). We achieved acceptable
internal reliability ( =0.94) for all insertion codes.

Results

We provide our full code book online [49]. We include a shorter, pictorial version of our code
book in Table 2. We describe five related, but different, themes that emerged from the codes.

All YouTubers used a diagram

As stated above, all YouTubers used a diagram. This finding indicates the prevalence of
diagrams when talking about linked lists.

YouTubers used similar terminology and talking points

Almost all YouTubers used and defined canonical linked list terminology (e.g., “head”, “tail,”
“node”), but there was little discussion on where these terms came from and little variation on
the types of terms used. For example, Video #3 states, “A linked list is made up of nodes. Each
node stores an item of data,” but doesn’t explain where the term “node” comes from. On the
other hand, Video #13 acknowledges this ambiguity: “Each of these boxes we call nodes, that’s
just what they’re called.”

With “head” and “tail,” YouTubers often alias these terms for the first and last node,
respectively. For example, Video #4 states, “The head node points to the second node, which
points to the third node, and so on until we reached the tail node that points to null, indicating the
end of the list.” However, this naming is misleading or confusing as “head” and “tail” are usually
references or pointers, a level of abstraction above the nodes themselves. When implementing
linked lists, YouTubers had different layers of encapsulation, leading to subtle changes in the
meaning of “head” and “tail.” For example, Video #2 implemented a linked list object wrapper
in Java: “We define a class, LinkedList, that’s basically going to wrap our head.” On the other
hand, Video #10 implemented a node struct in C/C++: “The first node is also called the head
node, and the only information that we keep all the time is the address of the head node or
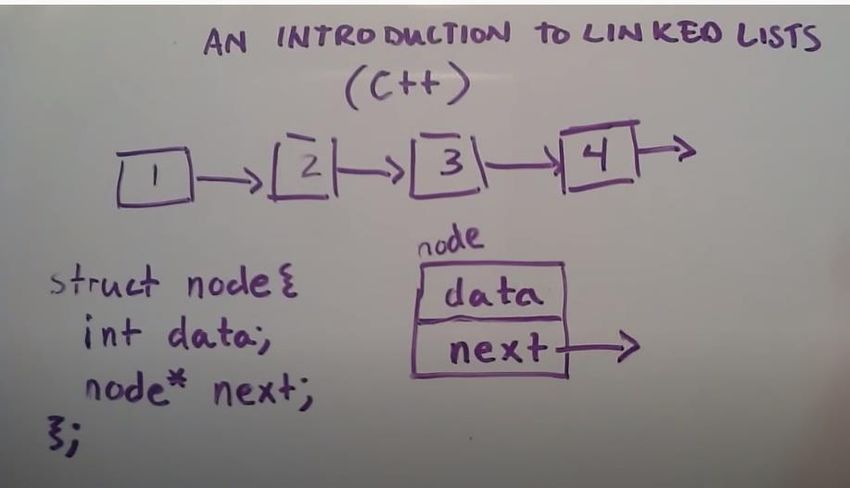
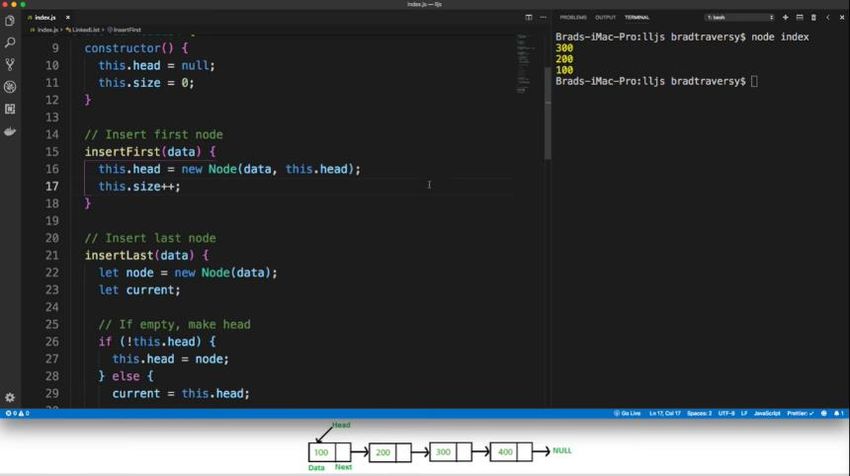
address of the first node.” Both YouTubers used the word “head,” but their differing
implementations led to two different meanings.

 Table 2: Shorter, pictorial code book used to analyze diagrams.

Other common talking points among YouTubers included comparing linked list performance to
arrays and their corresponding big-Ο analyses. Most YouTubers stored integers in their linked
lists for simplicity but mentioned linked lists can hold any data type. Some YouTubers
mentioned different types of linked lists, such as doubly linked lists or sorted linked lists.

YouTubers move between diagrams of different and varying levels of abstraction

Some YouTubers opted to show different types of diagrams to highlight different levels of
abstraction and detail. For example, Video #12 started with a box and arrow diagram, then wrote
code for the node, then illustrated the code with a multi-box and arrow diagram (see Figure 1).
Thus, the YouTuber started at a higher level of abstraction with less detail, then moved to a
lower level of abstraction with more detail. On the other hand, Video #15 started with a detailed
multi-box and arrow diagram while implementing the linked list, then illustrated linked list
traversal with a simpler box and arrow diagram.
Figure 1: Cropped screenshot taken from Video #12. The YouTuber draws a box and arrow
 diagram (top), writes a code snippet (bottom left), then draws a multi-box and arrow diagram
 (bottom right).

Next, we consider insertion videos. Analyzing insertion videos gave us clearer insight into how
diagrams changed when applied to an algorithm.

For prepending, the first node of the list is changing, thus having a head reference becomes
salient. From our analysis, 4 of 7 clips consistently used a head reference, but 2 of 7 clips, both
from the same video, added a head reference during the prepending process. Interestingly, 1 clip
did not show a head reference at all while prepending and instead opted to show static before and
after diagrams (see Figure 2).

 Figure 2: Cropped screenshot taken from Video #21. The YouTuber does not have a head
 reference while illustrating prepending.

For appending, the last node of the list is changing, thus having an explicit null (e.g., arrow to
NULL) helps identify which node is last or where the end of the list is. 3 out of 5 clips
consistently used an explicit null, 1 clip failed to have an explicit null at all while appending (see
Figure 3), and 1 clip showed an explicit null prior to appending but failed to add it back after
appending.
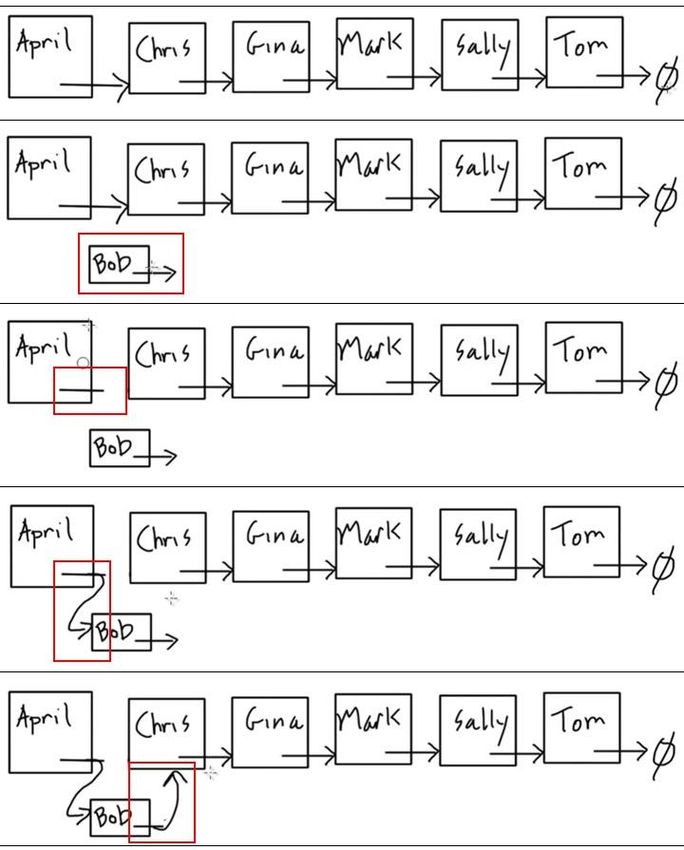
Figure 3: Cropped screenshot taken from Video #5. The YouTuber does not have an explicit
 null while illustrating appending.

Most implementations of linked lists in C/C++ incorporated addresses of nodes and next nodes
into their diagrams but no implementations in Python or Javascript incorporated addresses. For
examples in C/C++, having explicit addresses or a memory diagram may be more important to
showcase the language’s memory model (see Figure 4), but this lower level of abstraction may
not be applicable to higher-level languages like Python or Javascript.

Figure 4: Cropped screenshot taken from Video #10. The YouTuber shows how a linked list fits
 in a 1D memory layout.

Diagrams are subject to unexplained semantics that may not align with code semantics

Often, YouTubers assume diagram semantics to be self-evident, and they only label the
diagram’s parts rather than explain the rules of manipulation. Whereas code has a compiler to
check for syntax and test cases to check for correct behavior, hand-drawn diagrams or animated
slides do not have “verifiers” that enforce semantics and behavior. For example, when designing
algorithms for linked lists, diagrams often give the illusion of having access to all nodes in the
list at a time, whereas code typically has access to a single node at a time (see Figure 5). This
easily leads to out-of-order assignment for an algorithm like insertion anywhere (see Figure 6).
Additionally, many YouTubers used arrows to represent either a reference or an area for focus
but did not explicitly specify which was which, aligning with Heiser and Tversky’s [13] findings.

Insertion anywhere is arguably more complicated than prepending or appending to a linked list
as 6 out of 10 diagram-based clips analyzed showcased an incorrect algorithm, meaning if the
diagram changes were translated pedantically to code, the resulting code would exhibit incorrect
behavior. This seems to align with findings reported by Chotzen et. al [15]. For example, Video
#14 starts by creating a new node. However, the YouTuber reassigns the previous node’s next
reference first (see Figure 6). In code, this would make the programmer lose access to the rest of
the list, and thus not be able to assign the new node’s next reference correctly in the last step.
This finding stands out especially when all 4 of the clips that showed code were implemented
correctly, and only 2 out of those 4 warned about the perils of an out-of-order assignment.

Figure 5: Cropped screenshot taken from Video #2. The YouTuber writes code that manipulates
 one node at a time, but shows a diagram giving the illusion of access to all nodes at once.

Additionally, having a diagram leads to “diagram language.” Treating the arrows or lines
connecting nodes as “links” and therefore physical objects leads YouTubers to using inaccurate
language (e.g., “breaking,” “removing,” or “deleting” references) that has no direct mapping to
code.

 Figure 6: Cropped screenshots taken from Video #14. The YouTuber shows an incorrect
 insertion algorithm via out-of-order assignment. Annotations added in red.

Another limitation of drawing algorithms in real time, whether on pen and paper, whiteboard, or
digital canvas, is showing variable reassignment in two steps when, in terms of code,
reassignment is viewed as a single step (see Figure 6).
YouTubers used diagrams according to different strategies

YouTubers used diagrams for different strategies when implementing algorithms in code. For
example, Video #7 used a static image at the bottom of the screen while coding and referred to
the diagram with a lot of virtual pointing via the mouse (see Figure 7). Video #13 introduced the
topic with diagrams, then switched entirely to code. Video #5 showed the diagram, then the
code, then an animated diagram alongside the code.

 Figure 7: Screenshot taken from Video #7. The YouTuber continuously references a static
 diagram at the bottom of the screen while implementing the linked list.

In our code book, we extrapolated these behaviors to 3 levels of interaction between code and
diagram: no correspondence, ad-hoc correspondence, and one-to-one correspondence. For no
correspondence, some videos were heavily introductory and had no code implementation. Others
were focused on implementation and only showed a static diagram (see Figure 7). For ad-hoc
correspondence, some YouTubers bounced between implementing the linked list and showing an
example using the diagram, but the two were not tightly coupled. For one-to-one
correspondence, YouTubers stepped through their code and illustrated the corresponding change
in the diagram, thus keeping the program state and diagram state in sync.

Discussion

What (if anything) should we standardize?

We might be tempted to think that diagram standardization is the answer to simplify all of the
variety. Certainly, chemistry seems to rely on standardization: how one professor draws Fischer
projections in one university is how another will draw the same Fischer projection. However,
computer science is different in this sense: we have a variety of programming paradigms and use
cases for linked lists that may influence the types of diagrams we draw. We unpack some
examples of these affordances below.
Different levels of abstraction may be better for different programming paradigms. For example,
having a memory layout may make the C/C++ memory model more salient and easier to
understand, but would be too low level for languages like Python or Javascript. Similarly, having
explicit null values may be more applicable to C/C++ because memory management does not
auto-initialize values, but less applicable in auto-initializing languages like Java.

Different features become salient when implementing a linked list versus exploring theoretical
points. For example, explicitly drawing the head, tail, and appropriate object wrappers may be
more relevant when considering linked list implementation. On the other hand, a simpler
diagram may be more useful and flexible when considering big-O analysis or comparing to an
array.

Thus, moving toward a standardized linked list diagram for all data structures contexts may not
be beneficial nor feasible. Instead, we may look towards standardizing diagram semantics. Many
of the “mistakes” we found (i.e., incorrect algorithm when performing insertion on a diagram)
were likely due to loose, unexplained, and unenforced diagram semantics. Agreeing upon a set of
semantics, such as erasing nodes that are not connected to the head reference, may be easier for
instructors and more helpful for students. However, defining the most beneficial diagrams and
their associated semantics for a particular context or learning objective remains an open area for
future work.

What (if anything) is spatial about linked list diagrams?

Two of the codes in Table 2 have not yet been discussed: linear and non-linear. Most YouTubers
seemed to choose a linear layout for simplicity or to imply the linearity of the data structure
itself. In this case, moving nodes or tracing links may depend more on 2D mental translations as
the underlying spatial skill. Yet 3 of 18 generic videos and 3 of 10 insert anywhere clips
communicated the flexibility of where nodes can reside in memory by using non-linear diagrams
(see Figure 8). While the diagram may be more accurate in depicting how nodes fit in memory,
moving nodes or tracing links may be more cognitively taxing and may depend more on map
navigation as the underlying spatial skill. However, between the kind of knowledge conveyed
and the potential spatial skills involved, we cannot yet make a claim about the relationship
between the two or which is more important than the other.

 Figure 8: Cropped screenshot taken from Video #13. The YouTuber draws a non-linear linked
 list.

Additionally, varying uses of diagrams in relation to code may indicate a preference for spatial
thinking. If a YouTuber has no correspondence and little diagram interaction, then they
implicitly require the viewer to mentally animate changes. If a YouTuber shows one-to-one
correspondence, then there may be less reliance on a viewer’s spatial ability.

Uncommon parameters

Uncommon parameters represent outliers in our analysis, but they question the “status quo” of
linked list diagrams. For example, few videos drew a node or list wrapper to indicate
encapsulation. Few videos drew non-linear linked lists to highlight the randomness of node
location. Only one video showed a reference to a new node whereas many showed a reference to
the first node. Few videos explained the perils of out-of-order assignment when inserting.
However, we should not immediately take these outliers as innovations and incorporate them
into our practice. Rather, we should carefully consider what the learning objectives are for our
specific context and design diagrams accordingly.

Limitations

We acknowledge YouTube™ may not be a primary resource for traditional students studying in
a university setting and may not be up-to-standard to some. However, given the prevalence and
popularity of these videos, we believe there is a demand for these types of instructional videos
that many find helpful. To address this limitation, we are moving forward with analyzing videos
from university-level instructors. Additionally, we wanted to prevent personalized search results
from potentially biasing data collection. While we cannot fully eliminate search bias, we believe
that the “base” search bias will show what YouTube™ believes to be most relevant to our search
terms.

Conclusion

Our analysis introduces a parameter space for instructors to continue thinking critically about
how diagrams can enhance student learning and which features of a diagram are most salient to a
particular learning objective. YouTubers and instructors alike seem to have intuitions about
when certain abstractions or diagrammatic features are important for reasoning about linked lists.
For example, different features may be helpful in certain contexts (i.e., head reference when
prepending), but less relevant in others (i.e., head reference when appending). However, these
intuitions are often not made explicit. Without explicit instruction on diagram semantics or the
rules of manipulations, students may have to rely more on their spatial ability to mentally
animate diagram transformations like in Figure 2 or instructors and students alike may make easy
mistakes like out-of-order manipulations in Figure 6. Thus, we still need further research in
understanding the affordances of different diagrams and what kinds of instruction using diagrams
can especially support low spatial ability students.

Acknowledgements

Thanks to Chinny Emeka and Craig Zilles for their help in verifying and clarifying the code
book. Thanks also to Max Fowler, Vidushi Ojha, Mohammed Hassan, Abdu Alawini, and
Colleen Lewis for reviewing this draft before submission.
References

[1] ACM Computing Curricula Task Force, Ed., Computer Science Curricula 2013:
 Curriculum Guidelines for Undergraduate Degree Programs in Computer Science. ACM,
 Inc, 2013. doi: 10.1145/2534860.
[2] R. Bockmon, S. Cooper, J. Gratch, J. Zhang, and M. Dorodchi, “Can Students’ Spatial
 Skills Predict Their Programming Abilities?,” in Proceedings of the 2020 ACM Conference
 on Innovation and Technology in Computer Science Education, Trondheim Norway, Jun.
 2020, pp. 446–451. doi: 10.1145/3341525.3387380.
[3] S. Cooper, K. Wang, M. Israni, and S. Sorby, “Spatial Skills Training in Introductory
 Computing,” in Proceedings of the eleventh annual International Conference on
 International Computing Education Research - ICER ’15, Omaha, Nebraska, USA, 2015,
 pp. 13–20. doi: 10.1145/2787622.2787728.
[4] S. Jones and G. Burnett, “Spatial Ability and Learning to Program,” Hum. Technol.
 Interdiscip. J. Hum. ICT Environ., vol. 4, no. 1, pp. 47–61, May 2008, doi:
 10.17011/ht/urn.200804151352.
[5] J. Parkinson and Q. Cutts, “Investigating the Relationship Between Spatial Skills and
 Computer Science,” in Proceedings of the 2018 ACM Conference on International
 Computing Education Research, Espoo Finland, Aug. 2018, pp. 106–114. doi:
 10.1145/3230977.3230990.
[6] M. Fisher, A. Cox, and L. Zhao, “Using Sex Differences to Link Spatial Cognition and
 Program Comprehension,” in 2006 22nd IEEE International Conference on Software
 Maintenance, Sep. 2006, pp. 289–298. doi: 10.1109/ICSM.2006.72.
[7] P. J. Guo, “Online python tutor: embeddable web-based program visualization for cs
 education,” in Proceeding of the 44th ACM technical symposium on Computer science
 education - SIGCSE ’13, Denver, Colorado, USA, 2013, p. 579. doi:
 10.1145/2445196.2445368.
[8] S. Buchanan and J. J. Laviola, “CSTutor: A Sketch-Based Tool for Visualizing Data
 Structures,” ACM Trans. Comput. Educ., vol. 14, no. 1, pp. 1–28, Mar. 2014, doi:
 10.1145/2535909.
[9] M. Wilson, “Six views of embodied cognition,” Psychon. Bull. Rev., vol. 9, no. 4, pp. 625–
 636, Dec. 2002, doi: 10.3758/BF03196322.
[10] M. Hegarty, “Multimedia Learning and the Development of Mental Models,” in The
 Cambridge Handbook of Multimedia Learning, 2nd ed., R. Mayer, Ed. Cambridge:
 Cambridge University Press, 2014, pp. 673–702. doi: 10.1017/CBO9781139547369.033.
[11] M. Hegarty, M. S. Canham, and S. I. Fabrikant, “Thinking about the weather: How display
 salience and knowledge affect performance in a graphic inference task.,” J. Exp. Psychol.
 Learn. Mem. Cogn., vol. 36, no. 1, pp. 37–53, 2010, doi: 10.1037/a0017683.
[12] N. Johnson‐Glauch, D. S. Choi, and G. Herman, “How engineering students use domain
 knowledge when problem-solving using different visual representations,” J. Eng. Educ.,
 vol. 109, no. 3, pp. 443–469, 2020, doi: https://doi.org/10.1002/jee.20348.
[13] J. Heiser and B. Tversky, “Arrows in Comprehending and Producing Mechanical
 Diagrams,” Cogn. Sci., vol. 30, no. 3, pp. 581–592, 2006, doi:
 10.1207/s15516709cog0000_70.
[14] S. F. Mazumder, C. Latulipe, and M. A. Pérez-Quiñones, “Are Variable, Array and Object
 Diagrams in Java Textbooks Explanative?,” in Proceedings of the 2020 ACM Conference
on Innovation and Technology in Computer Science Education, Trondheim Norway, Jun.
 2020, pp. 425–431. doi: 10.1145/3341525.3387368.
[15] H. Chotzen, A. J. Johnson, and P. M. Desai, “Exploring the Mental Models of
 Undergraduate Programmers in the Context of Linked Lists,” in Proceedings of the 50th
 ACM Technical Symposium on Computer Science Education, New York, NY, USA, 2019,
 p. 1261. doi: 10.1145/3287324.3293862.
[16] L. E. Margulieux, “Spatial Encoding Strategy Theory: The Relationship between Spatial
 Skill and STEM Achievement,” in Proceedings of the 2019 ACM Conference on
 International Computing Education Research, Toronto ON Canada, Jul. 2019, pp. 81–90.
 doi: 10.1145/3291279.3339414.
[17] D. H. Uttal and C. A. Cohen, “Chapter Four - Spatial Thinking and STEM Education:
 When, Why, and How?,” in Psychology of Learning and Motivation, vol. 57, B. H. Ross,
 Ed. Academic Press, 2012, pp. 147–181. doi: 10.1016/B978-0-12-394293-7.00004-2.
[18] J. Wai, D. Lubinski, and C. P. Benbow, “Spatial ability for STEM domains: Aligning over
 50 years of cumulative psychological knowledge solidifies its importance.,” J. Educ.
 Psychol., vol. 101, no. 4, pp. 817–835, 2009, doi: 10.1037/a0016127.
[19] M. Stieff and S. Raje, “Expert Algorithmic and Imagistic Problem Solving Strategies in
 Advanced Chemistry,” Spat. Cogn. Comput., vol. 10, no. 1, pp. 53–81, Feb. 2010, doi:
 10.1080/13875860903453332.
[20] Y. Maeda and S. Y. Yoon, “A Meta-Analysis on Gender Differences in Mental Rotation
 Ability Measured by the Purdue Spatial Visualization Tests: Visualization of Rotations
 (PSVT:R),” Educ. Psychol. Rev., vol. 25, no. 1, pp. 69–94, Mar. 2013, doi:
 10.1007/s10648-012-9215-x.
[21] M. C. Parker, A. Solomon, B. Pritchett, D. A. Illingworth, L. E. Marguilieux, and M.
 Guzdial, “Socioeconomic Status and Computer Science Achievement: Spatial Ability as a
 Mediating Variable in a Novel Model of Understanding,” in Proceedings of the 2018 ACM
 Conference on International Computing Education Research, Espoo Finland, Aug. 2018,
 pp. 97–105. doi: 10.1145/3230977.3230987.
[22] M. Stieff, B. L. Dixon, M. Ryu, B. C. Kumi, and M. Hegarty, “Strategy training eliminates
 sex differences in spatial problem solving in a stem domain.,” J. Educ. Psychol., vol. 106,
 no. 2, pp. 390–402, 2014, doi: 10.1037/a0034823.
[23] S. Sorby, B. Casey, N. Veurink, and A. Dulaney, “The role of spatial training in improving
 spatial and calculus performance in engineering students,” Learn. Individ. Differ., vol. 26,
 pp. 20–29, Aug. 2013, doi: 10.1016/j.lindif.2013.03.010.
[24] S. A. Sorby, “Educational Research in Developing 3‐D Spatial Skills for Engineering
 Students,” Int. J. Sci. Educ., vol. 31, no. 3, pp. 459–480, Feb. 2009, doi:
 10.1080/09500690802595839.
[25] M. Hegarty and M. Kozhevnikov, “Types of Visual-Spatial Representations and
 Mathematical Problem Solving,” J. Educ. Psychol., vol. 91, no. 4, pp. 684–689, 1999, doi:
 10.1037/0022-0663.91.4.684.
[26] CS Dojo, Introduction to Linked Lists (Data Structures & Algorithms #5), (Apr. 12, 2018).
 Accessed: Jan. 13, 2021. [Online Video]. Available:
 https://www.youtube.com/watch?v=WwfhLC16bis
[27] HackerRank, Data Structures: Linked Lists, (Sep. 27, 2016). Accessed: Jan. 13, 2021.
 [Online Video]. Available: https://www.youtube.com/watch?v=njTh_OwMljA
[28] Computerphile, Linked Lists - Computerphile, (Jan. 20, 2017). Accessed: Jan. 13, 2021.
 [Online Video]. Available: https://www.youtube.com/watch?v=_jQhALI4ujg
[29] beiatrix, Linked Lists | Data Structures in JavaScript, (Jan. 26, 2019). Accessed: Jan. 13,
 2021. [Online Video]. Available: https://www.youtube.com/watch?v=ChWWEncl76Y
[30] Code Drip by Aaron Jack, Basic DATA STRUCTURES Explained - LINKED LISTS, (Jan.
 02, 2020). Accessed: Jan. 13, 2021. [Online Video]. Available:
 https://www.youtube.com/watch?v=ne1iyAP9__o
[31] Brian Faure, Python Data Structures #2: Linked List, (Aug. 26, 2017). Accessed: Jan. 13,
 2021. [Online Video]. Available: https://www.youtube.com/watch?v=JlMyYuY1aXU
[32] Traversy Media, Linked List Data Structure | JavaScript, (Jul. 03, 2019). Accessed: Jan. 13,
 2021. [Online Video]. Available: https://www.youtube.com/watch?v=ZBdE8DElQQU
[33] Vivekanand Khyade - Algorithm Every Day, Introduction to Linked List in Data Structures
 ( very easy), (Jul. 02, 2017). Accessed: Jan. 13, 2021. [Online Video]. Available:
 https://www.youtube.com/watch?v=Rs1KPyb9fHY
[34] Telusko, #5 Linked List Implementation in Java Part 1 | Data Structures, (Dec. 22, 2017).
 Accessed: Jan. 13, 2021. [Online Video]. Available:
 https://www.youtube.com/watch?v=SMIq13-FZSE
[35] mycodeschool, Introduction to linked list, (Mar. 28, 2013). Accessed: Jan. 13, 2021.
 [Online Video]. Available: https://www.youtube.com/watch?v=NobHlGUjV3g
[36] Derek Banas, Linked List in Java, (Mar. 03, 2013). Accessed: Jan. 13, 2021. [Online
 Video]. Available: https://www.youtube.com/watch?v=195KUinjBpU
[37] Paul Programming, How to Create a Linked List C++ Introduction to Linked Lists, (Dec.
 12, 2012). Accessed: Jan. 13, 2021. [Online Video]. Available:
 https://www.youtube.com/watch?v=o5wJkJJpKtM
[38] Jacob Sorber, Understanding and implementing a Linked List in C and Java, (Jul. 31,
 2019). Accessed: Jan. 13, 2021. [Online Video]. Available:
 https://www.youtube.com/watch?v=VOpjAHCee7c
[39] ReelLearning, Data Structures: Introduction to Linked Lists, (Jul. 24, 2012). Accessed: Jan.
 13, 2021. [Online Video]. Available:
 https://www.youtube.com/watch?v=pBrz9HmjFOs&feature=youtu.be
[40] mycodeschool, Linked List - Implementation in C/C++, (Apr. 04, 2013). Accessed: Jan. 13,
 2021. [Online Video]. Available:
 https://www.youtube.com/watch?v=vcQIFT79_50&feature=youtu.be
[41] CrashCourse, Data Structures: Crash Course Computer Science #14, (May 31, 2017).
 Accessed: Jan. 13, 2021. [Online Video]. Available:
 https://www.youtube.com/watch?t=265&v=DuDz6B4cqVc&feature=youtu.be
[42] Sunil Dhimal, Introduction to Linked List, (Sep. 12, 2016). Accessed: Jan. 13, 2021.
 [Online Video]. Available: https://www.youtube.com/watch?v=zR6iIQnooP0
[43] CodeWhoop, Linked List - Basics using C++, (Aug. 27, 2016). Accessed: Jan. 13, 2021.
 [Online Video]. Available: https://www.youtube.com/watch?v=Zgzoe8jjidk
[44] Vivekanand Khyade - Algorithm Every Day, Insert a node in Singly Linked List( at the
 start , middle or end), (Mar. 04, 2017). Accessed: Jan. 13, 2021. [Online Video]. Available:
 https://www.youtube.com/watch?v=0xoYNbVTiSE
[45] mycodeschool, Linked List in C/C++ - Inserting a node at beginning, (Apr. 06, 2013).
 Accessed: Jan. 13, 2021. [Online Video]. Available:
 https://www.youtube.com/watch?v=cAZ8CyDY56s
[46] LucidProgramming, Data Structures in Python: Singly Linked Lists -- Insertion, (Jan. 20,
 2018). Accessed: Jan. 13, 2021. [Online Video]. Available:
 https://www.youtube.com/watch?v=FSsriWQ0qYE
[47] Telusko, #6 Linked List Implementation in Java Part 2 | Data Structures, (Dec. 23, 2017).
 Accessed: Jan. 13, 2021. [Online Video]. Available:
 https://www.youtube.com/watch?v=AeqXFjCUcQM&feature=youtu.be
[48] K. Krippendorff, “Computing Krippendorff’s Alpha-Reliability,” p. 12, 2011.
[49] “Code book (Public),” Google Docs.
 https://docs.google.com/document/d/15_kqvyws9KGXjHhqHafRHbyIpCDR3KtdSAi0xx2
 XFXc/edit?usp=sharing (accessed Jan. 13, 2021).
You can also read