Advancing interpretation of stable isotope assignment maps: comparing and summarizing origins of known-provenance migratory bats - De Gruyter
←
→
Page content transcription
If your browser does not render page correctly, please read the page content below
                                                                                                Anim. Migr. 2020; 7: 27–41

Research Article

Caitlin J. Campbell*, Matthew C. Fitzpatrick, Hannah B. Vander Zanden, David M. Nelson

Advancing interpretation of stable isotope
assignment maps: comparing and summarizing
origins of known-provenance migratory bats
https://doi.org/10.1515/ami-2020-0004
                                                                             at a given level of accuracy than the odds-ratio and
Received July 6, 2019; accepted March 12, 2020
                                                                             quantile-only approaches, and many threshold values
Abstract: Probability-of-origin maps deduced from                            were associated with a relatively high degree (> 300 km)
stable isotope data are important for inferring broad-                       of variation in minimum distance traveled. Overall, these
scale patterns of animal migration, but few resources and                    results reinforce the importance of validating assignment
tools for interpreting and validating these maps exist.                      techniques with known-origin individuals when possible.
For example, quantitative tools for comparing multiple                       We present the tools discussed as part of an R package,
probability-of-origin maps do not exist, and many existing                   ‘isocat’ (“Isotope Origin Clustering and Assignment
approaches for geographic assignment of individuals have                     Tools”).
not been validated or compared with respect to precision
and accuracy. To address these challenges, we created                        Keywords: isoscape, geographic assignment, spatial
and analyzed probability-of-origin maps using stable                         similarity, isocat
hydrogen isotope values from known-origin individuals
of three species of migratory bat. We used a metric of
                                                                             Identifying the connections between habitats used by
spatial overlap to group individuals by areas of origin
                                                                             migratory animals is essential to understanding the
without a priori knowledge of such regions. The metric
                                                                             ecology and movement of wildlife as well as informing
of spatial similarity allowed for quantitative comparison
                                                                             conservation and management [1, 2]. Endogenous markers
of geographic origins and grouping of individuals with
                                                                             are particularly useful in this regard. For example, stable
similar origins. We then compared four approaches for
                                                                             hydrogen isotope (δ2H) values obtained from metabolically
inferring origins (cumulative-sum, odds-ratio, quantile-
                                                                             inert tissues (e.g., hair, feathers) provide a cost-effective
only, and quantile-simulation) across a range of
                                                                             means of identifying the geographic origins, and thus
thresholds and probable minimum distance traveled. The
                                                                             movement and connectivity, of terrestrial organisms [3,
accuracy of geographic origins and minimum distance
                                                                             4]. The rationale behind this approach is that δ2H values
traveled varied across species at most threshold values
                                                                             of animal tissues reflect those of the environment where
for most approaches. The cumulative-sum and quantile-
                                                                             they were synthesized [3]. Thus, δ2H values obtained from
simulation approaches had generally higher precision
                                                                             tissues grown at one location and sampled elsewhere
                                                                             can be used to infer the location(s) where the tissues
*Corresponding author: Caitlin J. Campbell, Department of Biology,           were grown, given an understanding of spatial variation
University of Florida, Gainesville, FL, USA, 32611; Department of
                                                                             in environmental δ2H values and relationships between
Biology, Frostburg State University, Frostburg, MD, USA, 21532; Uni-
versity of Maryland Center for Environmental Science, Appalachian
                                                                             environmental and tissue δ2H values.
Laboratory, Frostburg, MD, USA, 21532, E-mail: caitjcampbell@                     In recent years, a general framework has been
gmail.com                                                                    developed for using δ2H values to generate probability-
Matthew C. Fitzpatrick, University of Maryland Center for Environ-           of-origin maps of individual organisms. By comparing
mental Science, Appalachian Laboratory, Frostburg, MD, USA, 21532            tissue δ2H values to model projections of δ2H values of
Hannah B. Vander Zanden, Department of Biology, University of
                                                                             precipitation (known as isoscapes), one can generate
Florida, Gainesville, FL, USA, 32611
David M. Nelson, University of Maryland Center for Environmental             predictions of the relative likelihood of a tissue sample’s
Science, Appalachian Laboratory, Frostburg, MD, USA, 21532                   true origin being a particular location (e.g., [5, 6]).
                                                                             Different approaches have then been used to identify
                                                                             likely regions of origin from these maps, summarize

  Open Access. © 2020 Caitlin J. Campbell et al., published by De Gruyter.          This work is licensed under the Creative Commons Attribution 4.0
Public License.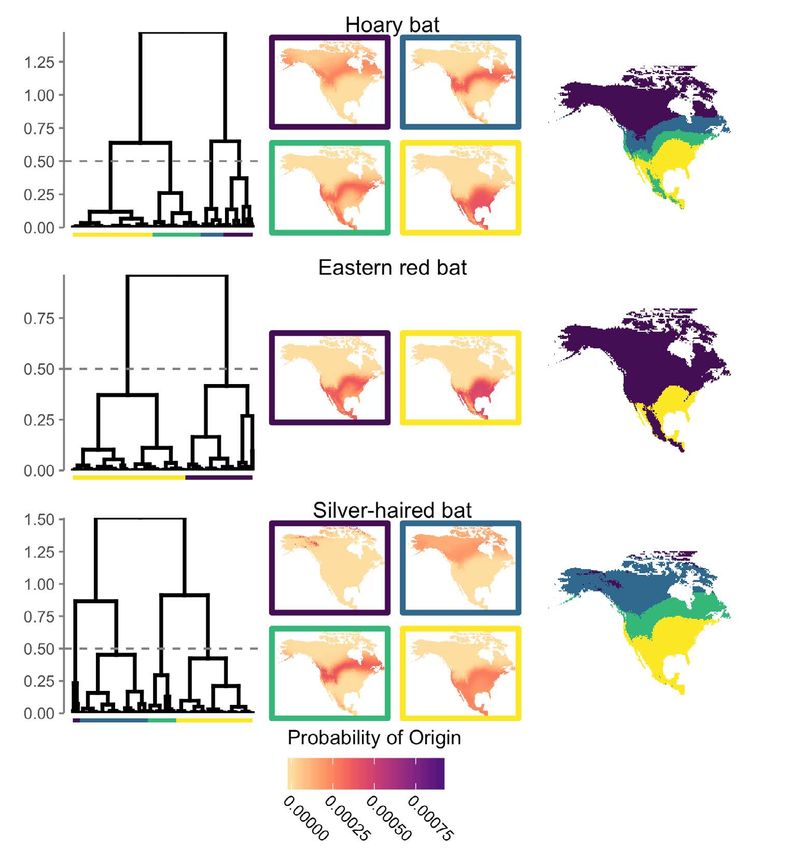
28        C.J. Campbell, et al.

patterns across individuals, and quantify the distance           likely region of origin of individuals and compile results
and direction of movement (e.g., [7, 8]). However, tools         from multiple individuals into collective maps [18, 19].
for interpreting model output, including classifying and         However, shortcomings of these approaches include: (1)
comparing groups of individuals of similar origins post-         that much of the probabilistic information of the original
hoc, have lagged behind the development of tools for             surfaces is lost [9], (2) they can obscure unique-but-
creating isoscapes and probability-of-origin maps (e.g., [5,     uncommon regions of origin among individuals [20], and
9]).                                                             (3) aggregate surfaces can become difficult to interpret
                                                                 when applied to numerous individuals with overlapping

1 Existing approaches for interpre-                              or differently-sized regions of most-likely origin.
                                                                      Recent studies have also used data from individuals
ting model output                                                of known geographic origin to assess the likelihood that
                                                                 individuals of uncertain origin came from particular areas
Some prior studies have summarized animal origins                [21, 22]. This approach uses Monte Carlo simulations of
inferred from probability-of-origin maps by partitioning         the minimum probability values that contain the true
probability surfaces into previously identified discrete         location of known-origin individuals to select a threshold
geographic regions, such as breeding ground locations            to establish areas of origin for individuals of unknown
(e.g., [10–12]) or management units (e.g., [13, 14]). This       origin. However, the ability of this method to identify the
approach calculates the mean of all probability-of-              geographic region of origin of individuals has not been
origin values associated with all cells within a particular      assessed relative to more widely used methods, such as
geographic region of the probability surface of each             the odds-ratio approach (e.g., [23]).
organism; individuals are then typically considered                   Finally, recent studies have estimated seasonal
to originate from the region with the highest mean               animal movement distance using probability-of-origin
probability. However, identifying the region of origin           maps derived from stable isotope data. For example, the
of individuals based on the highest mean probability             distance between the sampling location and the nearest
can be problematic. For example, by summarizing all              cell(s) of maximum probability [8, 9] or to centroids or
probabilities within a region with the mean probability,         boundaries of likely regions-of-origin has been quantified
potential biases could be introduced as a result of              [24, 25] and used to assess the potential distance traveled
disparate region sizes or skewed within-region probability       by individuals. However, these approaches have not been
distributions. Additionally, an individual assigned to one       rigorously compared and the uncertainty associated with
geographic region might have a similar mean probability          such distance estimates is unknown.
of originating in another region, and such differentiation            We herein develop and compare approaches for
between regions based on minor differences in mean               using continuous probability surfaces generated from
probability values may be arbitrary and/or insignificant.        stable isotope data to assess the geographic origins of
Furthermore, a priori information about potential regions        individuals, and we present an R package for performing
of geographic origin (e.g., breeding locations) is largely       such analyses. Although the approaches we use are
unknown for many species [15] and therefore it is often not      widely applicable, we illustrate them with δ2H data from
possible to define meaningful regions of potential origin        known-origin individuals of three North American bat
for comparison.                                                  species: the hoary bat (Lasiurus cinereus), eastern red bat
     As an alternative to a priori identification of potential   (Lasiurus borealis), and silver-haired bat (Lasionycteris
geographic regions of origin, relative probabilities of origin   noctivagans). These three tree-roosting Vespertilionid bat
may be spatially projected as a continuous probability           species are thought to be long-distance seasonal migrants
surface in which every location (i.e., raster cell) contains     with broad geographic ranges, but given that they are
a probability value. Prior studies have used different           difficult to re-capture and too small to carry modern real-
approaches for distilling and summarizing these data-rich        time geographic tracking systems, little is known about
surfaces to emphasize the most likely region of origin. For      their habitat use, abundance, and migration patterns [8,
example, several studies have divided probability surfaces       26]. There is growing interest in using δ2H data to assess
into binary regions of “high” and “low” probability of           the movement of these and similar species that present
origin (e.g., [16, 17]). By considering only cells of highest    challenges to traditional methods of tracking movement
relative probability, the most likely regions of origin for      [27]. Our study has two primary objectives: (1) Demonstrate
multiple individuals can be compared and summarized.             a hierarchical clustering approach to group individuals
These approaches have been used to identify the most             to similar geographic regions of origin without a priori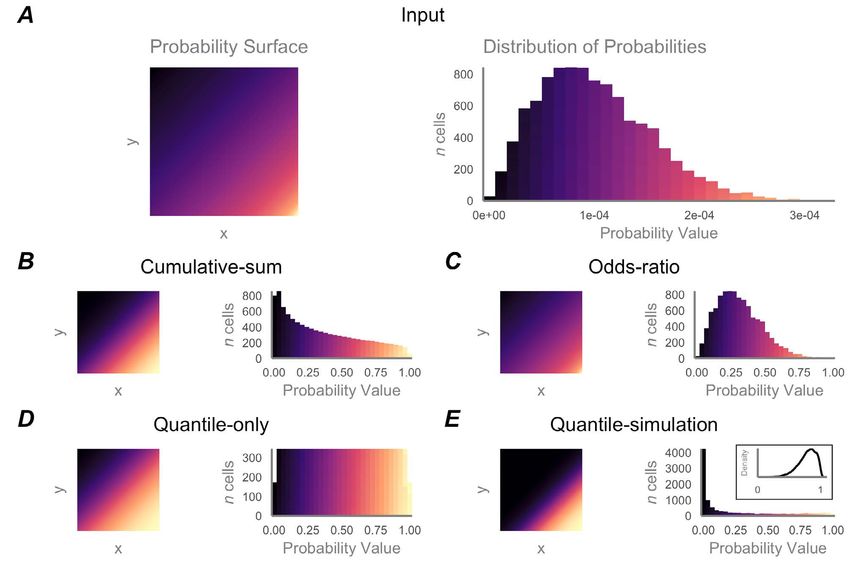
Interpretation of stable isotope assignment maps         29

knowledge of such regions and (2) Quantify the efficacy                  methods developed and explored herein are available in
with four methods commonly applied for delineating (a)                   the R package ‘isocat’ [30].
region of geographic origin and (b) probable distance
traveled. In each of the four methods, every potential
origin (cell in a probability-of-origin surface) was adjusted
                                                                         2 Methods
as follows: (1) a cumulative-sum approach, for which
probabilities-of-origin were transformed to reflect the                  2.1 Isotope data and analysis, isoscape, and
cumulative-sum of probabilities below the original value                 probability surfaces
[28]; (2) an odds-ratio approach, where probabilities
were transformed to reflect the relativized odds of                      We collected and analyzed δ2H values of hair (δ2Hhair) from
assignment with respect to the odds of the maximum                       hoary (n = 147), eastern red (n = 182), and silver-haired
probability of origin [29]; (3) a quantile-only approach,                (n = 39) bats, sampled from turbine-killed carcasses, live
where probabilities were ranked by quantile with respect                 captures, and museum specimens. We combined these
to all probabilities in the original surface; and (4) a                  results with published δ2Hhair data from these same species
quantile-simulation approach, which uses Monte Carlo                     (hoary, n = 432; eastern red, n = 124; and silver-haired,
simulation to estimate the likelihood that the quantile                  n = 88) as reported respectively in [8, 17, 31] (Figure 2). All
probability could fall within a distribution of quantiles                1,012 individuals were of known geographic origin (i.e.,
of individuals of known geographic origin [22, 24]. The                  they were sampled during the period of presumed molt)

Figure 1. An example, theoretical individual probability-of-origin surface of 10,000 grid cells (Panel A, left) and histogram of its probability
values (Panel A, right). Below, the example probability surface has been transformed using each method we evaluated: cumulative-sum
(Panel B), odds ratio (Panel C), quantile-only (Panel D), and quantile-simulation (Panel E). Inset of Panel E shows density of quantile probabi-
lities of simulated known-origin individuals used to generate the quantile-simulation surface.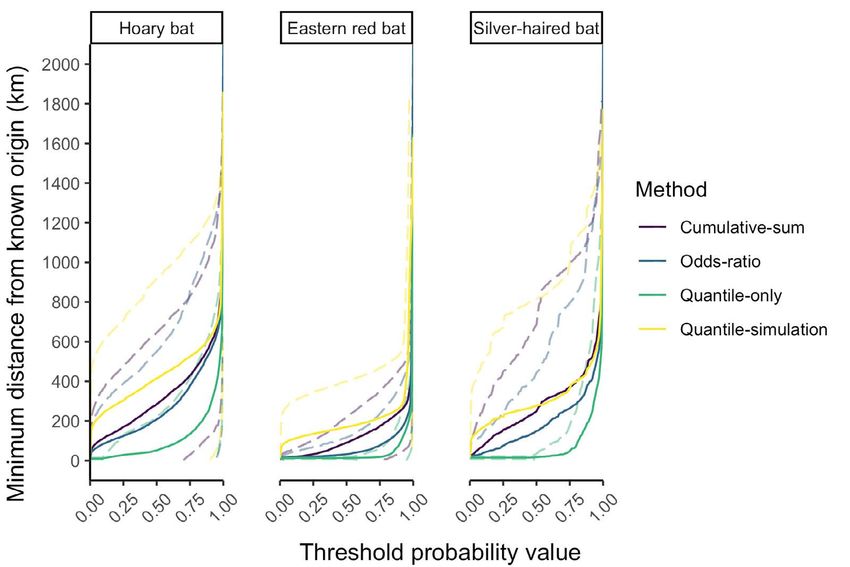
30       C.J. Campbell, et al.

based on estimated dates of molt from [8, 17, 31].
     Hair samples for which isotope analysis had not been
previously performed were prepared using the sample
preparation and δ2H measurement protocols detailed in
[31]. In brief, samples were cleaned using 1:200 Triton
X-100 detergent, 100% ethanol, and then air-dried [32]. To
account for exchange of keratin hydrogen with ambient
vapor, we used a comparative equilibration approach
(Wassenaar & Hobson, 2003) in which samples were
analyzed alongside international standards (USGS42;
USGS43; CBS, Caribou Hoof Standard; KHS, Kudu Horn
Standard; [32, 34]) and an internal keratin standard
(porcine hair and skin, product # K3030; Spectrum
Chemicals, New Brunswick, NJ, USA). The cleaned,
homogenized hair from each sample was exposed to
ambient air to permit equilibration of exchangeable
hydrogen in keratin. Samples were analyzed for δ2H values
using a ThermoFisher high temperature conversion/
elemental analyzer (TC/EA) pyrolysis unit interfaced with
a ThermoFisher Delta V+ isotope ratio mass spectrometer.
Values of δ2H were normalized to the Vienna Standard
Mean Ocean Water-Standard Light Antarctic Precipitation
(VSMOW-SLAP) scale using USGS42, USGS43, CBS, and
KHS. The δ2H values of non-exchangeable hydrogen
of these standards are -72.9, -44.4, -157.0, and -35.5‰,
respectively [33, 35].
     Elevation, latitude, and latitude2 were used to
generate a 2 km2 resolution isoscape of June – August δ2H
values of precipitation (δ2Hprecip) across North America
using IsoMAP (IsoMAP jobs 66087 and 66098, see [5, 31,
36]). Values of δ2Hprecip were obtained from the isoscape for
the site that each known-origin individual was sampled.
When geographic coordinates for a sample site were
not available, georeferencing to site or county level was
conducted using the ‘geocode’ function of the R package
ggmap (v. 2.6.1; [37]. We fit reduced major axis regressions
between values of δ2Hhair and δ2Hprecip for each species. All
δ2Hhair values were transformed into δ2Hprecip values using
mean regression coefficients (Figure S1).
     The probability of an individual having originated
in a given cell of the isoscape was predicted using the
following equation, as described in [5]:

                                                                Figure 2. Locations of samples from three species of bats with δ2Hhair
where the probability that the given cell represented           values from known summer locations used in the present study.
the origin of the individual with a given δ2Hprecip value y     Point size corresponds with the number of samples from a location.
                                                                Range maps for each species are shown in blue (International Union
is f(y|μ,σ), given an expected mean (μ) and combined
                                                                for Conservation of Nature, 2015). Insets include images of each
error (σ) within the δ2Hprecip isoscape and mean regression     species: Panel A hoary bat inset photo by Eric Hough (CC BY-NC 4.0);
coefficients. The combined error was defined as:                Panel B eastern red bat photo by iNaturalist user adamdv18 (CC
                                                                BY-NC 4.0); Panel C silver-haired bat photo by Erica Krimmel (CC0
                                                                1.0).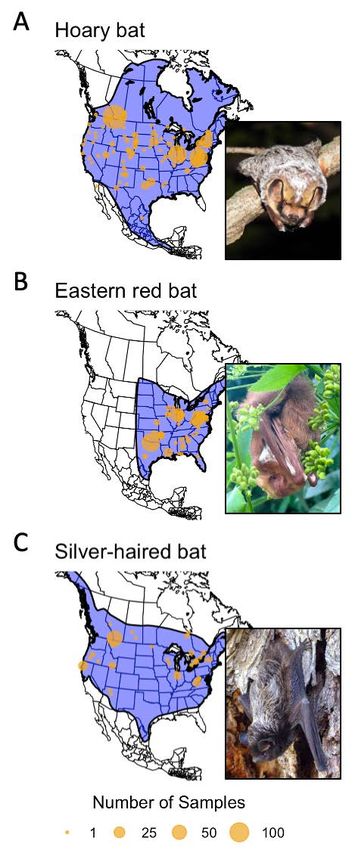
Interpretation of stable isotope assignment maps        31

                                                                         2.2 Surface similarity and clustering

where σisoscape is the standard deviation of a given cell                To quantitatively compare continuous probability
of the isoscape model (IsoMAP jobs 66087 and 66098)                      surfaces, we used a metric of niche overlap, Schoener’s
and σregression is the standard deviation of the variance                D-metric ([40]; as described in [41] and reviewed in [42]):
of the major axis regression between δ2Hhair and δ2Hprecip
for each species (Figure S1). The resulting surfaces were
normalized to sum to 1. Analyses were performed in R v.
                                                                         where z1i and z2i are two surfaces z1 and z2 with values in
3.3.1 [38] using the likelihood function adapted from [39]
                                                                         grid cell i. The metric is applied to normalized surfaces
within the isocat function ‘isotopeAssignmentModel’.
                                                                         and varies between no overlap (D = 0) and complete
                                                                         overlap (i.e., identical surfaces, D = 1). We conducted
                                                                         pairwise analyses among the probability surfaces for all
                                                                         individuals of each species, populating a n x n symmetric
                                                                         matrix with D values where n is the number of individuals.

Figure 3. Left) Results of hierarchical clustering based on similarity matrices of known-origin individuals of each species. Groups (indicated
by colored bars) were defined at height h = 0.5, indicated by a dashed grey line on each tree. Center) Mean probability-of-origin maps for
each group (colored box outlines) were summarized as described in the text. Right) Spatial projections based on mean surfaces by group.
Colors represent the cluster associated with highest mean within-cluster probability for a given cell and are meant to indicate the geogra-
phic regions of origin most associated with each specific cluster.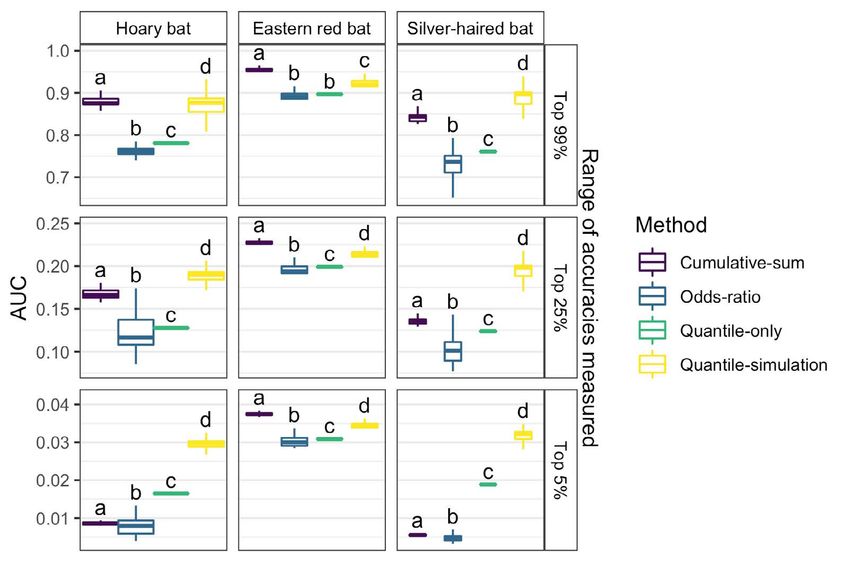
32       C.J. Campbell, et al.

      To create groups of individuals of each species          X = 1 / (ORi + 1), e.g., odds-ratio threshold values of 0.5
that had similar probable regions of origin, we applied        correspond to 1:1 odds and an expected accuracy of 50%,
hierarchical clustering to each similarity matrix using the    threshold values of 0.25 with 3:1 odds and an expected
“average” method to cluster by correlation distance in         accuracy of 75%, and threshold values of 0.05 to 19:1 odds
the R package pvclust (v. 2.0-0; [43]). We cut each tree at    and an expected accuracy of 95% (Figure S2).
height h = 0.5 (Figure 3) to account for different sample           The quantile-only (QO) surfaces were determined by
sizes among species while retaining a similar likelihood       estimating the quantile value at each sampling location
of detecting unique regions of origin. However, numerous       relative to all probabilities within the probability-of-
qualitative and quantitative methods exist for deciding        origin surface using an empirical cumulative distribution
the height at which to cut dendrograms (e.g., [43–46]) and     function. This function estimates the quantiles of surface
such approaches could be explored in future studies.           z for cell values X = (z1, z2, …, zn) where  is the fraction
      For each group of individuals, we created a mean         of observations less than or equal to t:
probability surface representing the average probability-
of-origin for group members. To assess the degree to
which grouping individuals improves a summarized
representation of all likely origins, we compared the          … and the output quantile-only surface is a transformed
probabilities-of-origin at known sampling sites between        probability surface where the value of grid cell zi is:
mean aggregate surfaces summarizing within-species
(i.e., before clustering) and within-cluster (i.e., after
                                                               Like the quantile-only method, the quantile-simulation
clustering) probabilities using a paired t-test. For summary
                                                               approach also estimates quantile probabilities, but then
purposes, we also used these mean aggregated surfaces to
                                                               quantifies the similarity of those quantile probabilities
depict spatially distinct regions of probable origin of each
                                                               to those of known-origin individuals. This simulation
species.
                                                               element effectively corrects for poor or variable model
                                                               accuracy by incorporating the model performance of
                                                               known-origin individuals. Our quantile-simulation
2.3 Comparison of existing methods for
                                                               approach, modified from Pylant et al. (2016), incorporated
interpreting model output                                      model performance for known-origin individuals as
                                                               follows: we fit six candidate distribution functions
Using data from the known-origin bats, we evaluated four
                                                               (normal, log-normal, exponential, Weibull, γ, and logistic)
thresholding methods to delineate the most likely region
                                                               to the distribution of 1 – q values, where q is the quantile
of origin for each individual: cumulative sum, odds-ratio,
                                                               of the probability at the sampling location of each known-
quantile-only, and quantile-simulation (Figure 1). The
                                                               origin individual, using maximum likelihood estimation
cumulative-sum surfaces were created with reference
                                                               within the ‘fitdistrplus’ package (v. 1.0.9, [47]). When fitting
to the entire probabilities in the surface. That is, the
                                                               the quantile-simulation model, the best-fit distributions
cumulative sum value (CS) of each grid cell zi in surface z
                                                               for each species were Weibull, exponential, and γ (AIC
was the sum of all cells in z less than or equal to zi:
                                                               scores -369.3, -55.8, -18.4, Figure S3) for hoary, eastern
                                                               red, and silver-haired bats, respectively. We subsampled
                                                               (with replacement) from the best-fit distribution for each
                                                               species 10,000 times, discarding values outside of [0, 1].
Since input probability surfaces had been normalized to
                                                               We applied Monte Carlo simulation to each surface cell,
sum to 1, the outputs of the cumulative sum model ranged
                                                               counting how many times 1 – q fell below the simulated
from the minimum of the original surface (the smallest
                                                               values; output was the proportion of times 1 – q for a given
probability value) to 1 (the largest original probability
                                                               cell remained below the simulated values. The resulting
value).
                                                               surface was rescaled between 0 and 1.
    The odds-ratio (OR) surfaces were calculated for each
                                                                    We assessed the accuracy of each of the four methods
probability surface using the ratio of ratios:
                                                               by measuring the proportion of “true origins” (sampling
                                                               sites of known-origin individuals) with probabilities
                                                               greater than each of a range of threshold proportional
within grid cell i of surface z (note that probability         probability values (from 0.0 – 1.0 in increments of 0.01).
surfaces had already been normalized to sum to 1). These       All individuals would be expected to be included with a
ORi values correspond to the X:1 odds-ratio format with        probability threshold value of 0, with progressively fewer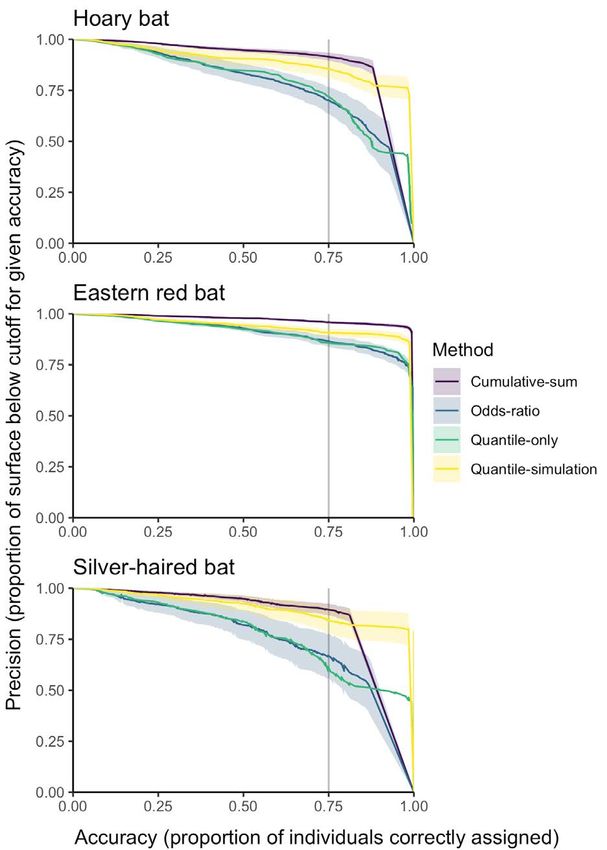
Interpretation of stable isotope assignment maps        33

included as the probability thresholds increased. We                     or greater than a specific threshold) for each standardized
calculated the precision of each method as the proportion                probability surface for each method (i.e., cumulative-
of cells in the whole surface higher than each candidate                 sum, odds-ratio, quantile-only, and quantile-simulation).
threshold value. To recommend thresholds for geographic                  We then calculated the AUC for each individual for each
assignment for each of the four methods, we selected the                 threshold/distance curve. To evaluate the relationships
smallest threshold that correctly assigned > 75% of known-               among approaches across species with respect to AUC,
origin individuals of each species. We calculated the area               we conducted a two-way factorial ANOVA (‘aov’ function,
under the curve (AUC; an indicator of model precision and                [38]). To summarize the distance to the edge of each
accuracy) for both the threshold/accuracy curves (for each               potential threshold for each surface, we considered mean
species and method) and the accuracy/precision curves                    and variance in minimum distance from the sampling
(for each individual) using the ‘auc’ function of the “MESS”             location of each individual to the nearest cell containing
package (v. 0.5.6, [48]) in R. We calculated AUC for every               a given threshold.
range under the curve associated with the top 99−0% of
thresholds and accuracies, respectively. To provide a basis
for comparing the accuracy/precision tradeoffs associated                3 Results
with each approach [49], we report several ranges of AUC
for the threshold/accuracy curves, corresponding to very                 The δ2Hhair values for the 1,012 individuals included in this
high accuracies (accuracies encompassing 95% and 100%                    study ranged between 24 and -210 ‰. There was a strong
of validation individuals included), moderate to high                    positive relationship between δ2Hhair and δ2Hprecip values
(between 75% and 100% included), and low to high (1%                     during the presumed period of molt for each species
to 100% included).                                                       (Figure S1).
     For each method, we also measured the geographic                         Pairwise comparisons of spatial similarity (Schoener’s
distance from each known-origin individual’s sampling                    D metric) conducted on the normalized probability-of-
location to the nearest cell with a probability greater                  origin surfaces revealed mean within-species similarity
than each threshold value as follows: for each cell in                   values across all individuals of 0.53 (range: 1.210×10⁻⁷ to
the specified isoscape, the distance to the sampling                     1). After clustering of the similarity matrices of D values
location was computed using the ‘distanceFromPoints’                     for each species, individuals were assigned to 4 (hoary),
function of the ‘raster’ package (v. 3.0-7, [50]) in R. Then,            2 (eastern red), and 4 (silver-haired) groups of likely
we calculated the minimum distance from the sampling                     origin (Table 1) based on cutting at h = 0.5 (Figure 3).
location to the nearest edge of the region delineated by a               The aggregated probabilities of origin at “true origins”
given threshold (in which the surface values were equal to               increased when probabilities of origin were averaged

Table 1. Summary of cluster results.

                                                         Pre-clustering sample size Within-cluster sample size (n)

Species                     Clusters (k)                 n                            Mean                         Range

Hoary bat                   4                            579                          144.75                       74 - 257

Eastern red bat             2                            306                          153.00                       115 - 191

Silver-haired bat           4                            127                          31.75                        5 - 54

Table 2. Mean relativized probability-of-origin values at individual sample sites comparing pre-clustering (i.e., by species) and post-cluste-
ring (by species and cluster) approaches.

                     Aggregate Probability Surface

                     By Species                         By Species and Cluster             t-test results

Species              Mean              sd               Mean             sd                t                df                 p
Hoary bat            1.44e-04          6.67e-05         2.24e-04         1.22e-04          -1.39e+01        8.93e+02           7.12e-40

Eastern red bat      3.65e-04          2.33e-05         3.78e-04         7.24e-05          -2.90e+00        3.66e+02           3.99e-03

Silver-haired bat    9.45e-05          2.05e-05         1.91e-04         8.84e-05          -1.20e+01        1.40e+02           3.08e-23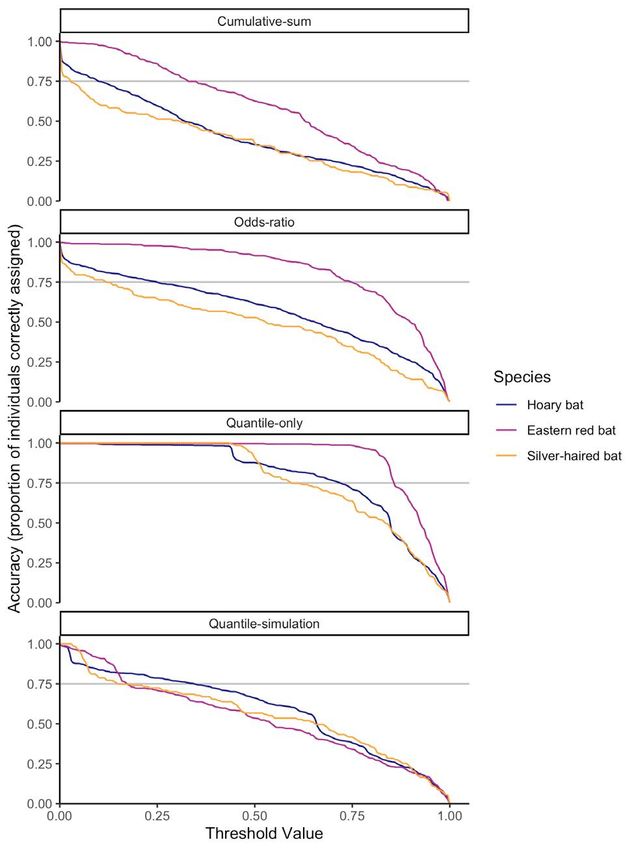
34 C.J. Campbell, et al.
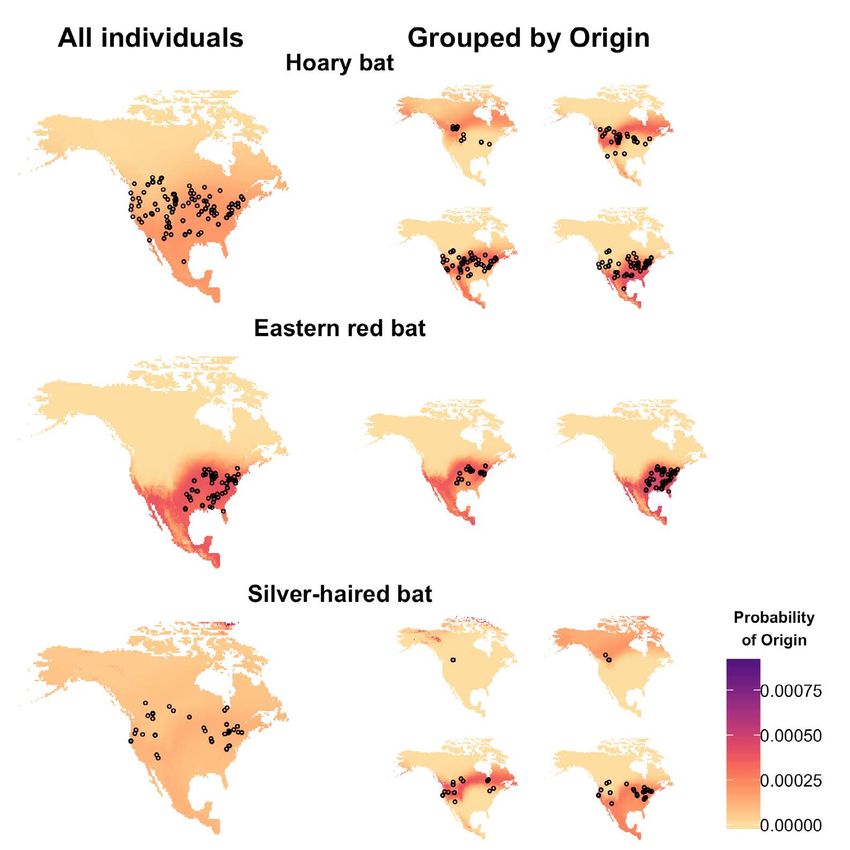
Figure 4. Mean aggregate surfaces, with shading denoting mean probability of origin and points the sampling locations of known-origin
individuals. Left: Spatial projections based on mean aggregate surfaces for each species. Right: Spatial projections based on mean aggre-
gate surfaces within groups of individuals of similar origin (i.e., those defined in Figure 3) for each species.
across all within-group surfaces (Figure 4) relative to Table 3. Area under entire threshold/accuracy curve (AUC) for each
ungrouped aggregate probability surfaces (p < 0.001; species and method evaluated.
Table 2). Method Hoary bat Eastern red Silver-haired
The accuracy of assignment for known-origin bat bat
individuals at a given threshold varied among species for Cumulative-sum 0.402 0.592 0.363
each method (Figure 5). Among species, there was a 48.1%
Odds-ratio 0.574 0.822 0.489
difference between the minimum and maximum AUC for
the cumulative-sum approach, 50.8% difference for the Quantile-only 0.792 0.912 0.776
odds-ratio approach, a 16.2% difference for the quantile- Quantile-simulation 0.586 0.533 0.557
only approach, and a 9.4% difference for the quantile-
simulation approach (Table 3). At the commonly applied
As expected, there was a trade-off between accuracy
odds ratio of 2:1 [29, 51] (corresponding to a threshold
and precision of geographic assignment for known-
value of 0.33 and expected accuracy of 66%, Figure S2),
origin individuals of each species at a given threshold for
72, 96, and 59% of known-origin hoary, eastern red, and
each method. As accuracy (proportion of known-origin
silver-haired bats, respectively, were accurately assigned
individuals correctly assigned) increased between 0 and
(Figure 5).
~0.75, precision (representing the proportion of the surfaceInterpretation of stable isotope assignment maps 35
Figure 5. The proportion of individual bats (vertical axes) for which Figure 6. Accuracy (proportion of known-origin individuals assigned
the known origin is contained within the probability-of-origin to their known-origin sampling location at each proportional proba-
surface region exceeding a given threshold value (horizontal axes) bility value) of each method relative to the precision of each method
for each of the four thresholding methods. The horizontal lines indi- (inferred by the proportion of the probability-of-origin model surface
cate 75% accuracy, i.e., 75% of individuals of a given species having below a given threshold) for each species. Solid lines indicate mean
probability-of-origin values above the corresponding threshold precision at a given accuracy; shaded areas indicate the range of
value. one standard deviation from the mean for given accuracy. The verti-
cal lines indicate 75% accuracy of assignment as local.
of the quantile-simulation approach for silver-haired bats.
below the threshold cutoff for a given accuracy) gradually
For the top 25 and 5% of accuracies the cumulative-sum
declined, with some variation in the rate of decline
approach, followed by the quantile-simulation approach,
among species and methods. For example, the decline
had the highest AUC values for eastern red bats. In
in precision across species was greater for the odds-ratio
contrast, the quantile-simulation approach, followed by
and quantile-only approaches than for the cumulative-
cumulative-sum approach (for the top 25% of accuracies)
sum and quantile-simulation approaches. As accuracy
and quantile-only approach (for the top 5% of accuracies),
increased beyond ~0.75, precision generally declined more
had the highest AUC values for hoary and silver-haired
rapidly (Figure 6). Across species, the mean precision with
bats (Figure 7).
respect to accuracy varied among methods (Figure 7). The
Across species, the distance from each known-origin
mean AUC for the top 99% of all accuracies ranged from a
individual’s sampling location to the nearest cell with a
minimum of 0.74 for silver-haired bats with the odds-ratio
probability greater than each threshold value increased
approach to a maximum of 0.95 for eastern red bats with
gradually below threshold values of ~0.75 and more
the cumulative-sum approach. At this accuracy level, the
rapidly thereafter (Figure 8). There was no difference in
odds-ratio and quantile-only approaches had the lowest
distance with respect to threshold values across method
AUC values for each species, and the cumulative-sum
(ANOVA of AUC values across methods: p = 0.45, F = 0.89,
approach had the highest AUC value for eastern red bats,
df = 3), although there were differences across species (p
a similar AUC value to that of the quantile-simulation
< 0.001, F = 240, df = 2). At the commonly-applied odds-
approach for hoary bats, and a lower AUC value than that
ratio threshold of 0.33 (2:1 odds), this mean distance was36 C.J. Campbell, et al. Figure 7. Area under the curve (AUC) relating accuracy and precision values for each species and method. Panels arranged vertically show the AUC for varying ranges of accuracy, from (respectively) 99% of all potential accuracies (from 1% accurate to 100% accurate), the top 25% (from 75% to 100% accurate), and the top 5% (from 95% to 100% accurate). Letters denote the results of Tukey’s HSD tests (p-value < 0.05) for within-species and AUC-threshold analyses. Figure 8. Minimum distance from the known origin of each species of bat to the cell with greater than or equal to threshold value. Solid lines denote mean minimum distance and dashed lines the standard deviation.
Interpretation of stable isotope assignment maps   37

relatively low but with moderate variance (mean error            origins across individuals. Finally, aggregate maps
across species = 117 km, sd = 329). The distance extending       representing the common origins of groups of individuals
from each known-origin individual’s sampling location            retain the entirety of the data within those surfaces while
was 448 km (sd = 466 km) at the 99th quantile of cells, 723      avoiding potential drawbacks associated with high/
km (sd = 448 km) at the odds-ratio threshold of 0.99, 1053       low designations (e.g., arbitrary thresholding, loss of
km (sd = 1128 km) at the quantile-simulation threshold           relatively low-probability—yet potentially informative—
of 0.99, and 642 km (sd = 613 km) at the cumulative-sum          regions of each map) and remaining suitable for further
threshold of 0.99.                                               analyses (e.g., of spatial connectivity, distance, and/or
                                                                 direction traveled).

4 Discussion                                                         Future studies could build upon the hierarchical
                                                                 clustering approach presented herein. We divided the bats
                                                                 in our study into a relatively small number of groups per
4.1 Spatial similarity and hierarchical                          species (2 – 4) based on a subjective tree-pruning height
clustering                                                       specification (h = 0.5; Table 1, Figures 3-4). This approach
                                                                 could be modified to suit specific research objectives.
Our results illustrate that Schoener’s D-metric and              For example, the number of clusters could alternatively
hierarchical clustering provide a powerful approach for          be selected by k-means. Hierarchical clustering could
grouping and comparing probability-of-origin maps.               also potentially be performed across, rather than within,
Furthermore, we found that hierarchical clustering               species to assess inter-specific differences in geographic
using mean aggregate surfaces increased the relative             origins. After defining probable regions of origin, one can
probability of origin at the sampling location of known-         quantify the strength of migratory connectivity (e.g., [54])
origin individuals relative to their probability values prior    by associating individual sampling locations with each
to clustering. A key advantage of this clustering approach       probable region of origin. Future studies could apply this
relative to existing approaches for partitioning probability     clustering method to help estimate the presence and type
surfaces is that the results of the former can be used to        of migratory structure (e.g., chain, leapfrog migration)
define geographic regions of origin without a priori             exhibited by various species.
knowledge of such regions.
     The use of continuous aggregate probability surfaces
overcomes challenges associated with other methods               4.2 Comparison of existing methods for
of combining probability surfaces and summarizing                interpreting model output
individual origins. First, the resulting probability surfaces
from the clustering approach are straightforward to read         We found substantial variation in model accuracy among
and interpret, even when analyzing and presenting large          species at most realistic thresholds (i.e., > 50% accuracy),
datasets. It is often difficult to compare and interpret large   which indicates that those thresholds may not correspond
numbers of individual probability surfaces or a single           predictably or consistently to expected accuracy
summary map of the origins of multiple individuals,              levels. For example, there was substantial variation in
especially when the probable regions of origin of different      accuracy across species at an odds-ratio threshold of
individuals overlap substantially and/or differ in size          0.33 (corresponding to 2:1 odds), with a 37% difference
[9]. When applying hierarchical clustering to create and         in accuracy between silver-haired and eastern red bats
group aggregate probability surfaces, the maximum                (Figure 5). Such variation in accuracy has implications
sample size yielding interpretable output is unlimited.          for studies that compare the geographic origin at a given
Second, relatively small subsets of individuals with             threshold for multiple species, since it indicates that a
unique origins that may be unnoticed in a group mean             single threshold is unlikely to yield assignments with the
or potentially biased sampling effort within an aggregate        same accuracy among different species. For example,
probability surface are not obscured using the cluster           Pylant et al. [22] used a single quantile-simulation
approach. Grouping individuals by common origin should           threshold value of 0.5 for assessing the whether hoary
be preferred over approaches that consider only average          and eastern red bats obtained as carcasses at wind-energy
within-group (e.g., species or demographic subgroup)             facilities in the central Appalachian Mountains were
origins (e.g., [52]) or stacked regions of probability (e.g.,    killed in their geographic region of origin. Our results
[29, 53]) because the grouping approach retains all of the       suggest that there is likely a ≥ 12% difference in accuracy
available information about the diversity of geographic          of classification between these species at this threshold
38 C.J. Campbell, et al.
value. Furthermore, thresholds selected a priori for a species (hoary and silver-haired bats, Figure 7). This
given species or dataset may not necessarily reflect a outcome is likely a result of the Monte Carlo simulation
predictably accurate level of assignment. When possible, component of the quantile-simulation approach, which
we recommend that future studies comparing summary accounts for many of the relatively low initial probability-
statistics (e.g., distance moved from a probability of-origin values for known-origin individuals of these two
threshold-defined region) among species use known- species (Figure S3). For the eastern red bats, which had
origin individuals to select species-specific thresholds relatively high initial quantile values for known-origin
associated with consistent accuracy levels to ensure individuals, the cumulative-sum method outperformed
comparable levels of data accuracy across species. the quantile-simulation approach. Thus, we infer that
We consider the accuracy/precision relationship to the cumulative-sum approach is likely to perform well in
be the most reliable indicator of how well a method for situations where the initial isotope assignment of origin
interpreting model output performs [55]. Probability performs well, which is when known-origin individuals
threshold selection should be associated with high have relatively high and unimodal initial probabilities of
accuracy rates; however, accuracy is not the only indicator origin at their sampling sites. However, we expect that high
of the utility of a method. Precision is similarly important, and unimodal initial probabilities of origin at sampling
since high accuracy but low precision would result in sites will not be the norm for many species. Thus, when
increased uncertainty of geographic assignment. To data from known-origin individuals are available, we
minimize potential sources of spatial biases across species recommend the quantile-simulation method because of
in our accuracy/precision comparisons, we considered the its more consistent precision (Figure 6) and incorporation
entire extent of North America with respect to potential of model performance into designation of geographic
origins of individuals, rather than clipping or weighting origin. In cases where the quantile-simulation approach
potential origins by species range or habitat suitability. is not applicable (e.g., because data from known-origin
However, future studies might apply this accuracy/ individuals do not exist), we recommend the cumulative-
precision framework when evaluating the addition of sum approach because it is the most consistently accurate
other factors to further constrain isotope-based models of method at fixed threshold values (Figures 5 and 7).
animal origin, e.g., occupancy data [56] and abundance However, there was substantial variation in accuracy
[8, 55, 57]. among species at common threshold values using this
Within the scope of our study, each method method, so future studies should avoid or cautiously
performed at a reasonably high degree of accuracy at apply comparisons between species when selection of a
most threshold values across species and maintained threshold is necessary, but potentially arbitrary.
relatively high levels of precision with respect to most We expected that the distance from each known-
accuracy levels (Figures 5-7). However, differences origin individual’s sampling location to the nearest
in accuracy and precision among species illustrate cell above each threshold value would be inversely
considerations for selecting which approach to use to proportional to precision (Figures 6 and 8). That is,
infer geographic origin and distance traveled. Of the with increasing precision, the area included within a
four methods considered, the quantile-simulation and particular threshold shrinks, thus the distance from a
cumulative-sum approaches appear generally superior sampling location outside that threshold to the edge of the
to the odds-ratio and quantile-only approaches based encompassed area would increase. Thus, we propose that
on the former two approaches having relatively higher these distances should be considered a quantification of
precision at a given level of accuracy (Figure 6). Since uncertainty at a given threshold, i.e., as a mechanism to
accuracy/precision relationships vary depending on the establish probable error in calculating minimum distance
range of the curves under which AUC is measured, we traveled. These results have implications for studies that
considered the AUC ranges for three potential accuracy estimate distance of animal movement using probability-
ranges: very high (accuracies encompassing 95% and of-origin maps. For example, Cryan et al. [8] used the
100% of validation individuals included), moderate to points of highest probability in probability-of-origin maps
high (between 75% and 100% included), and low to high to approximate the probable movement and distance
(1% to 100% included). For the former two AUC ranges, traveled by hoary bats in North America. As the point of
which should be considered the most informative (as they highest probability is contained within the 99th quantile,
correspond to high rates of accuracy at corresponding our quantile-only error validation suggests a general
probability thresholds), the quantile-simulation method mean error of > 448 km, with a hoary bat-specific mean
outperformed the other methods for two of the three error of > 496 km, for the estimates of distance traveledInterpretation of stable isotope assignment maps 39
in that study. We recommend that future studies consider the R package ‘isocat’ (Isotope Clustering and Assignment
distance traveled from the boundary associated with a Tools), which is available on CRAN (“https://CRAN.R-
threshold corresponding to a fixed and high accuracy project.org/package=isocat”) and GitHub (“https://
rate, or to develop methods of incorporating the entire github.com/cjcampbell/isocat”).
probability surface into a probabilistic assessment of
distance traveled. Acknowledgements: We thank Lori Pruitt, Amanda
Data from known-origin individuals are not available Hale, Meghan Lout, Juliet Nagel, Ed Gates, Anna Weaver,
for many species because of the high cost and challenges Patrick Moore, Becky Abel, Ted Weller, Hannah Holmes,
involved with obtaining such datasets. In such situations Jason Williams, Jeffrey Clerc, and others for supporting
the predictability of model accuracy at a given threshold the collection of tissue samples analyzed as part of this
value (i.e., as shown in Figure 5) is an important research. We thank J. Edward Gates, Paul Gugger, and
consideration when selecting a method to interpret Richard Raesly for providing feedback on early versions
probability surfaces. In cases where all individuals are of of this manuscript, as well as two anonymous reviewers
unknown origin, a method that performs with a consistent for valuable input that improved the clarity of the text.
degree of accuracy vs. threshold value would be valuable. Robin Paulman assisted with stable isotope analysis,
Our results indicate that the cumulative-sum method and Michael Belitz and Lauren Holian assisted with
performs best in this respect. Relatively few studies have development and testing of the ‘isocat’ package. This
quantified accuracy at given thresholds using known- study was funded by the Maryland Department of Natural
origin individuals (e.g., [58]), but those that exist indicate Resources, the U.S. Fish and Wildlife Service, and the U.S.
that odds ratios have been documented to perform above National Park Service.
[20] and below [9] expected accuracy levels. Similarly,
in our study the odds-ratio approach performed at both Authors’ contributions: CJC and DMN conceived the
higher and lower levels of accuracy than predicted, ideas; CJC, MCF, and HBVZ designed methodologies; CJC
depending on species (Figures 5 and S2). Our results also collected and analyzed the data; CJC and DMN led the
indicate that even methods that consistently perform writing of the manuscript. All authors contributed critically
within an acceptable range of accuracies across thresholds to the drafts and gave final approval for publication.
might vary across species in terms of accuracy at a specific
threshold. For example, we found substantial variation in
accuracy across species at the commonly applied odds-
References
ratio of 2:1. Thus, studies that do not have access to known- [1] Bolger D.T., Newmark W.D., Morrison T.A., Doak D.F., The
origin individuals and must select an arbitrary threshold need for integrative approaches to understand and conserve
value should expect potentially high and unpredictable migratory ungulates, Ecol. Lett., 2008, 11, 63–77
levels of uncertainty of geographic assignment. [2] Wilcove D.S., Wikelski M., Going, going, gone: Is animal
The use of known-origin individuals to quantify migration disappearing?, PLoS Biol., 2008, 6, 1361–1364
[3] Hobson K.A., Barnett-Johnson R., Cerling T., Using Isoscapes
an acceptable level of accuracy presents a promising
to Track Animal Migration, In: Isoscapes: Understanding
approach to improving the consistency and applicability Movement, Pattern, and Process on Earth Through Isotope
of isotope assignment approaches, and we encourage Mapping, 2010, 273–298
the collection of known-origin individuals whenever [4] Wunder M.B., Determining geographic patterns of migration
possible. As isotopic data become available in publicly- and dispersal using stable isotopes in keratins, J. Mammal.,
2012, 93, 360–367
available repositories (e.g., as proposed by [59]), we
[5] Bowen G.J., Liu Z., Vander Zanden H.B., Zhao L., Takahashi
anticipate the opportunity to quantify expected accuracy G., Geographic assignment with stable isotopes in IsoMAP,
and/or distance-based error at specific threshold values Methods Ecol. Evol., 2014, 5, 201–206
for many taxa. Such future studies will permit a more [6] Courtiol A., Rousset F., Rohwäder M.-S., Soto D.X., Lehnert
informed selection of threshold values in studies for L.S., Voigt C.C., et al., Isoscape Computation and Inference of
which known-origin individuals are not available. Thus, Spatial Origins With Mixed Models Using the R package IsoriX,
In: Tracking Animal Migration with Stable Isotopes, 2016
even when accuracy for a particular group of individuals
[7] Hobson K.A., Isotopic ornithology: A perspective, J. Ornithol.,
cannot be quantified, it could be estimated based on the 2011, 152
distributions of accuracy for similar species and spatial [8] Cryan P.M., Stricker C.A., Wunder M.B., Continental-scale,
extents at a given threshold. seasonal movements of a heterothermic migratory tree bat,
The hierarchical clustering methods and associated Ecol. Appl., 2014, 24, 602–616
spatial similarity metrics described herein are available in40 C.J. Campbell, et al.
[9] Vander Zanden H.B., Nelson D.M., Wunder M.B., Conkling [24] Katzner T.E., Nelson D.M., Braham M.A., Doyle J.M.,
T.J., Katzner T.E., Application of stable isotopes to determine Fernandez N.B., Duerr A.E., et al., Golden Eagle fatalities and
geographic origin of terrestrial wildlife for conservation the continental-scale consequences of local wind-energy
management, Biol. Conserv., 2018, 228, 268–280 generation, Conserv. Biol., 2017, 31, 406–415
[10] Flockhart D.T.T., Wassenaar L.I., Martin T.G., Hobson K.A., [25] Zenzal T.J., Contina A.J., Kelly J.F., Moore F.R., Temporal
Wunder M.B., Norris D.R., Tracking multi-generational migration patterns between natal locations of ruby-throated
colonization of the breeding grounds by monarch butterflies hummingbirds (Archilochus colubris) and their Gulf Coast
in eastern North America, Proc. R. Soc. B Biol. Sci., 2013, 280, stopover site, Mov. Ecol., 2018, 6
20131087–20131087 [26] Cryan P.M., Seasonal distribution of migratory tree bats
[11] Wunder M.B., Norris D.R., Improved estimates of certainty in (Lasiurus and Lasionycteris) in North America, J. Mammal.,
stable-isotope-based methods for tracking migratory animals, 2003, 84, 579–593
Ecol. Appl., 2008, 18, 549–559 [27] Lehnert L.S., Kramer-schadt S., Teige T., Hoffmeister U.,
[12] Pajuelo M., Bjorndal K.A., Reich K.J., Vander Zanden H.B., Popa-lisseanu A., Bontadina F., et al., Variability and
Hawkes L.A., Bolten A.B., Assignment of nesting loggerhead repeatability of noctule bat migration in Central Europe :
turtles to their foraging areas in the Northwest Atlantic using evidence for partial and differential migration, Proc. R. Soc. B,
stable isotopes, Ecosphere, 2012, 3 2018
[13] Wassenaar L.I., Hobson K.A., A stable-isotope approach to [28] Ma C., Bowen G., assignR: Infer Geographic Origin from
delineate geographical catchment areas of avian migration Isotopic Data, 2019
monitoring stations in North America, Environ. Sci. Technol., [29] Hobson K.A., Wunder M.B., Van Wilgenburg S.L., Clark R.G.,
2001, 35, 1845–1850 Wassenaar L.I., A method for investigating population declines
[14] Flockhart D.T.T., Brower L.P., Ramirez M.I., Hobson K.A., of migratory birds using stable isotopes: Origins of harvested
Wassenaar L.I., Altizer S., et al., Regional climate on the lesser scaup in North America, PLoS One, 2009, 4, e7915
breeding grounds predicts variation in the natal origin of [30] Campbell C.J., isocat: Isotope Origin Clustering and
monarch butterflies overwintering in Mexico over 38 years, Assignment Tools. R package version 0.2.4, 2019
Glob. Chang. Biol., 2017, 23, 2565–2576 [31] Pylant C.L., Nelson D.M., Keller S.R., Gandini P., Stable
[15] Webster M.S., Marra P.P., Haig S.M., Bensch S., Holmes R.T., hydrogen isotopes record the summering grounds of eastern
Links between worlds: unraveling migratory connectivity, red bats (Lasiurus borealis), PeerJ, 2014, 2, e629
Trends Ecol. Evol., 2002, 17, 76–83 [32] Coplen T.B., Qi H., USGS42 and USGS43: Human-hair stable
[16] Hobson K.A., Soto D.X., Paulson D.R., Wassenaar L.I., Matthews hydrogen and oxygen isotopic reference materials and
J.H., A dragonfly (δ2H) isoscape for North America: a new tool analytical methods for forensic science and implications for
for determining natal origins of migratory aquatic emergent published measurement results., Forensic Sci. Int., 2012, 214,
insects, Methods Ecol. Evol., 2012, 3, 766–772 135–41
[17] Fraser E.E., Brooks D., Longstaffe F.J., Stable isotope [33] Wassenaar L., Hobson K., Comparative equilibration and online
investigation of the migratory behavior of silver-haired bats technique for determination of non-exchangeable hydrogen of
(Lasionycteris noctivagans) in eastern North America, J. keratins for use in animal migration studies., Isotopes Environ.
Mammal., 2017, 38, 2067–2069 Health Stud., 2003, 39, 211–217
[18] Van Wilgenburg S.L., Hobson K.A., Combining stable- [34] Wassenaar L.I., Hobson K.A., Two new keratin standards (δ2H,
isotope (δD) and band recovery data to improve probabilistic δ18O) for daily laboratory use in wildlife and forensic isotopic
assignment of migratory birds to origin, Ecol. Appl., 2011, 21, studies, Conf. Appl. Stable Isot., 2010
1340–1351 [35] Soto D.X., Koehler G., Wassenaar L.I., Hobson K.A.,
[19] Hobson K.A., Van Wilgenburg S.L., Dunn E.H., Hussell D.J.T., Re-evaluation of the hydrogen stable isotopic composition of
Taylor P.D., Collister D.M., Predicting origins of passerines keratin calibration standards for wildlife and forensic science
migrating through Canadian migration monitoring stations applications, Rapid Commun. Mass Spectrom., 2017, 31,
using stable-hydrogen isotope analyses of feathers: a new tool 1193–1203
for bird conservation, Avian Conserv. Ecol., 2015, 10, 3 [36] Bowen G.J., Statistical and geostatistical mapping of
[20] Brennan S.R., Schindler D.E., Linking otolith microchemistry precipitation water isotope ratios, In: West, J.B., Bowen,
and dendritic isoscapes to map heterogeneous production of G.J., Dawson, T.E., Tu, K.P. (Eds.), Isoscapes: Understanding
fish across river basins, Ecol. Appl., 2017, 27, 363–377 Movement, Pattern, and Process on Earth through Isotope
[21] Nelson D.M., Braham M., Miller T.A., Duerr A.E., Cooper J., Mapping, Springer, New York, 2010, 139–160
Lanzone M., Stable hydrogen isotopes identify leapfrog [37] Kahle D., Wickham H., ggmap : Spatial Visualization with
migration, degree of connectivity, and summer distribution ggplot2, R J., 2013
of golden eagles in eastern North America, Condor, 2015, 117, [38] R Core Team, R: A language and environment for statistical
1–17 computing, R Core Team, 2019
[22] Pylant C.L., Nelson D.M., Fitzpatrick M.C., Gates J.E., Keller [39] Vander Zanden H.B., Wunder M.B., Hobson K.A., Van
S.R., Geographic origins and population genetics of bats killed Wilgenburg S.L., Wassenaar L.I., Welker J.M., et al., Contrasting
at wind-energy facilities, Ecol. Appl., 2016, 26, 1381–1395 assignment of migratory organisms to geographic origins using
[23] López-Calderón C., Van Wilgenburg S.L., Roth A.M., Flaspohler long-term versus year-specific precipitation isotope maps,
D.J., Hobson K.A., An evaluation of isotopic (δ2H) methods Methods Ecol. Evol., 2014, 5, 891–900
to provide estimates of avian breeding and natal dispersal, [40] Schoener T.W., Nonsynchronous spatial overlap of lizards in
Ecosphere, 2019, 10 patchy habitats, Ecology, 1970, 51, 408–418Interpretation of stable isotope assignment maps 41
[41] Broennimann O., Fitzpatrick M.C., Pearman P.B., Petitpierre Alberta: evidence from stable isotopes, Ecosphere, 2014, 5,
B., Pellissier L., Yoccoz N.G., et al., Measuring ecological niche 1–17
overlap from occurrence and spatial environmental data, Glob. [53] Van Wilgenburg S.L., Hobson K.A., Brewster K.R., Welker J.M.,
Ecol. Biogeogr., 2012, 21, 481–497 Assessing dispersal in threatened migratory birds using stable
[42] Warren D.L., Glor R.E., Turelli M., Environmental niche hydrogen isotope (δD) analysis of feathers, Endanger. Species
equivalency versus conservatism: quantitative approaches to Res., 2012, 16, 17–29
niche evolution, Evolution (N. Y)., 2008, 62 [54] Cohen E.B., Hostetler J.A., Hallworth M.T., Rushing C.S.,
[43] Suzuki R., Shimodaira H., Pvclust: An R package for assessing Sillett T.S., Marra P.P., Quantifying the strength of migratory
the uncertainty in hierarchical clustering, Bioinformatics, 2006 connectivity, Methods Ecol. Evol., 2017
[44] Langfelder P., Zhang B., Horvath S., Defining clusters from a [55] Rushing C.S., Marra P.P., Studds C.E., Incorporating breeding
hierarchical cluster tree: The Dynamic Tree Cut package for R, abundance into spatial assignments on continuous surfaces,
Bioinformatics, 2008, 24, 719–720 Ecol. Evol., 2017, 1–9
[45] Hennig C., fpc: Flexible Procedures for Clustering, 2019 [56] Fournier A.M.V. V., Sullivan A.R., Bump J.K., Perkins M.,
[46] White D., Gramacy R.B., maptree: Mapping, pruning, and Shieldcastle M.C., King S.L., et al., Combining citizen science
graphing tree models, 2012 species distribution models and stable isotopes reveals
[47] Delignette-Muller M.L., Dutang C., fitdistrplus: An R Package migratory connectivity in the secretive Virginia rail, J. Appl.
for Fitting Distributions, J. Stat. Softw., 2015 Ecol., 2016, 54, 618–627
[48] Ekstrøm C.T., MESS: Miscellaneous Esoteric Statistical Scripts, [57] Andrew Royle J., Rubenstein D.R., Royle A.J., Rubenstein D.R.,
2018 The role of species abundance in determining breeding origins
[49] Peterson A.T., Papeş M., Soberón J., Rethinking receiver of migratory birds with stable isotopes, Ecol. Appl., 2004, 14,
operating characteristic analysis applications in ecological 1780–1788
niche modeling, Ecol. Modell., 2008, 213, 63–72 [58] Trueman C.N., MacKenzie K.M., St John Glew K., Stable isotope-
[50] Hijmans R.J., raster: Geographic Data Analysis and Modeling, based location in a shelf sea setting: accuracy and precision
2019. are comparable to light-based location methods, Methods Ecol.
[51] Asante C.K., Jardine T.D., Van Wilgenburg S.L., Hobson K.A., Evol., 2017, 8, 232–240
Tracing origins of waterfowl using the Saskatchewan River [59] Pauli J.N., Newsome S.D., Cook J.A., Harrod C., Steffan S.A.,
Delta: Incorporating stable isotope approaches in continent- Baker C.J.O., et al., Opinion: Why we need a centralized
wide waterfowl management and conservation, Condor, 2017, repository for isotopic data, Proc. Natl. Acad. Sci., 2017, 114,
119, 261–274 2997–3001
[52] Baerwald E.F.F., Patterson W.P.P., Barclay R.M.R., Origins and
migratory patterns of bats killed by wind turbines in southernYou can also read